Tag

consumer packaged goods

3 insights

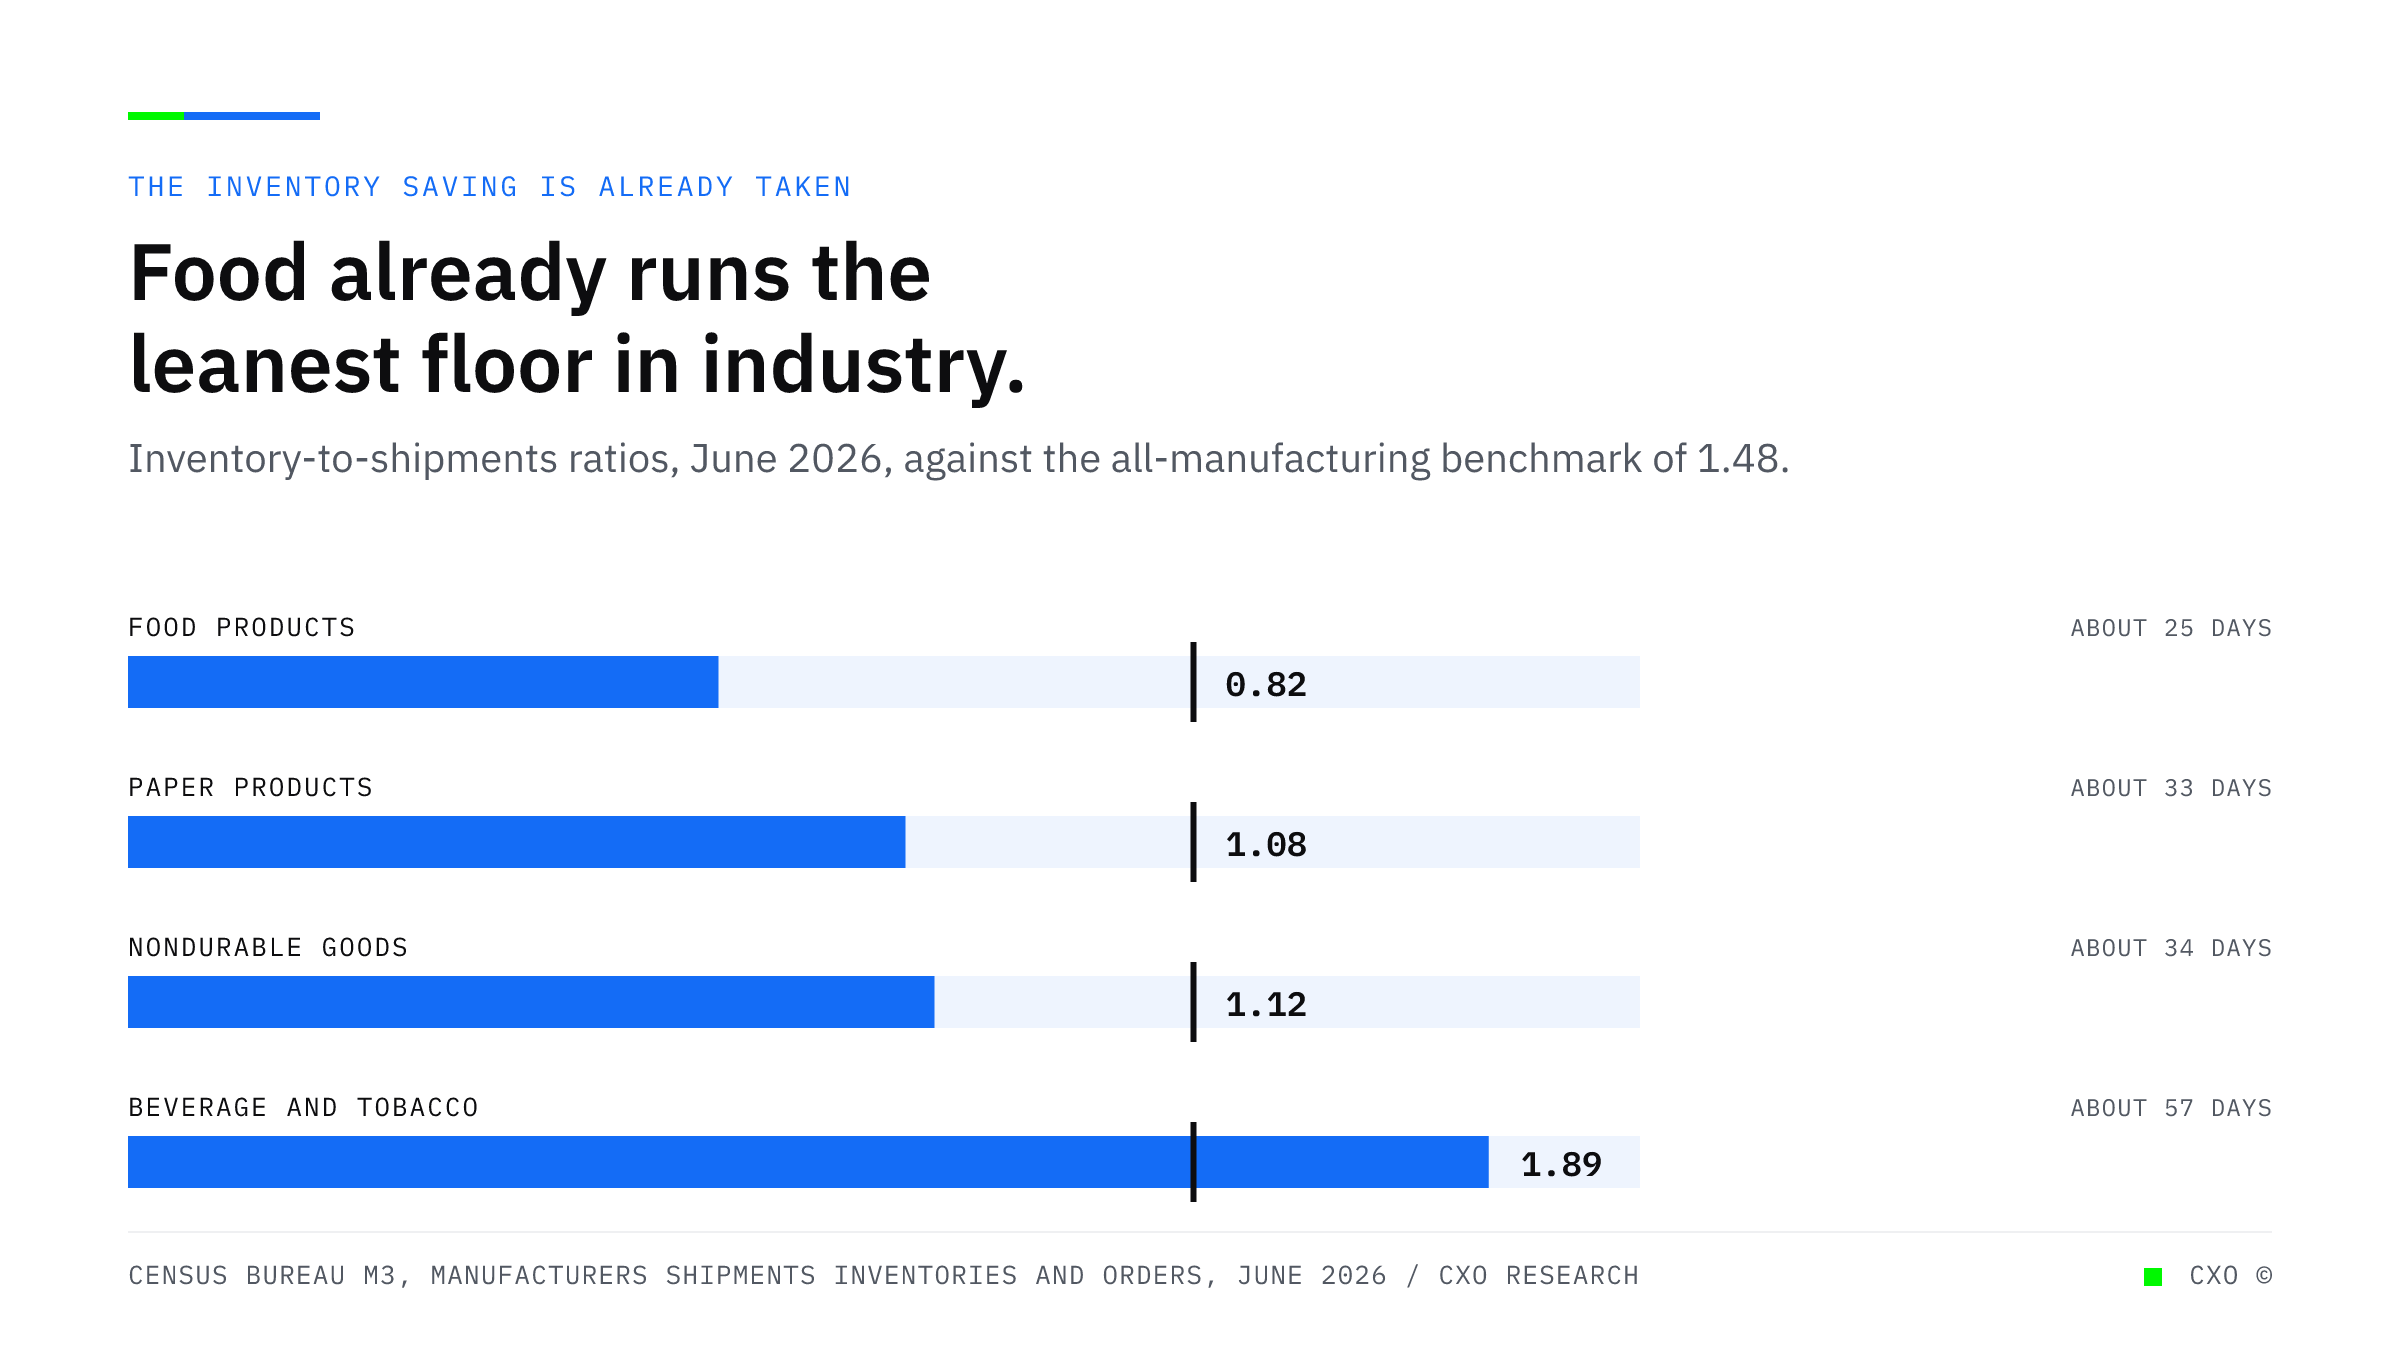
Bullet bars showing inventory-to-shipments ratios in June 2026: food products at 0.82, paper products at 1.08, nondurable goods at 1.12, and beverage and tobacco at 1.89, each measured against the all-manufacturing benchmark of 1.48.

Food Manufacturing Already Runs the Leanest Inventory in Manufacturing. The Next Dollar Is Somewhere Else.

Food products carry an inventory-to-shipments ratio of 0.82 against 1.48 for manufacturing overall. The inventory savings are already taken, so the remaining working capital sits in the order-to-cash cycle, not on the floor.
View Insight
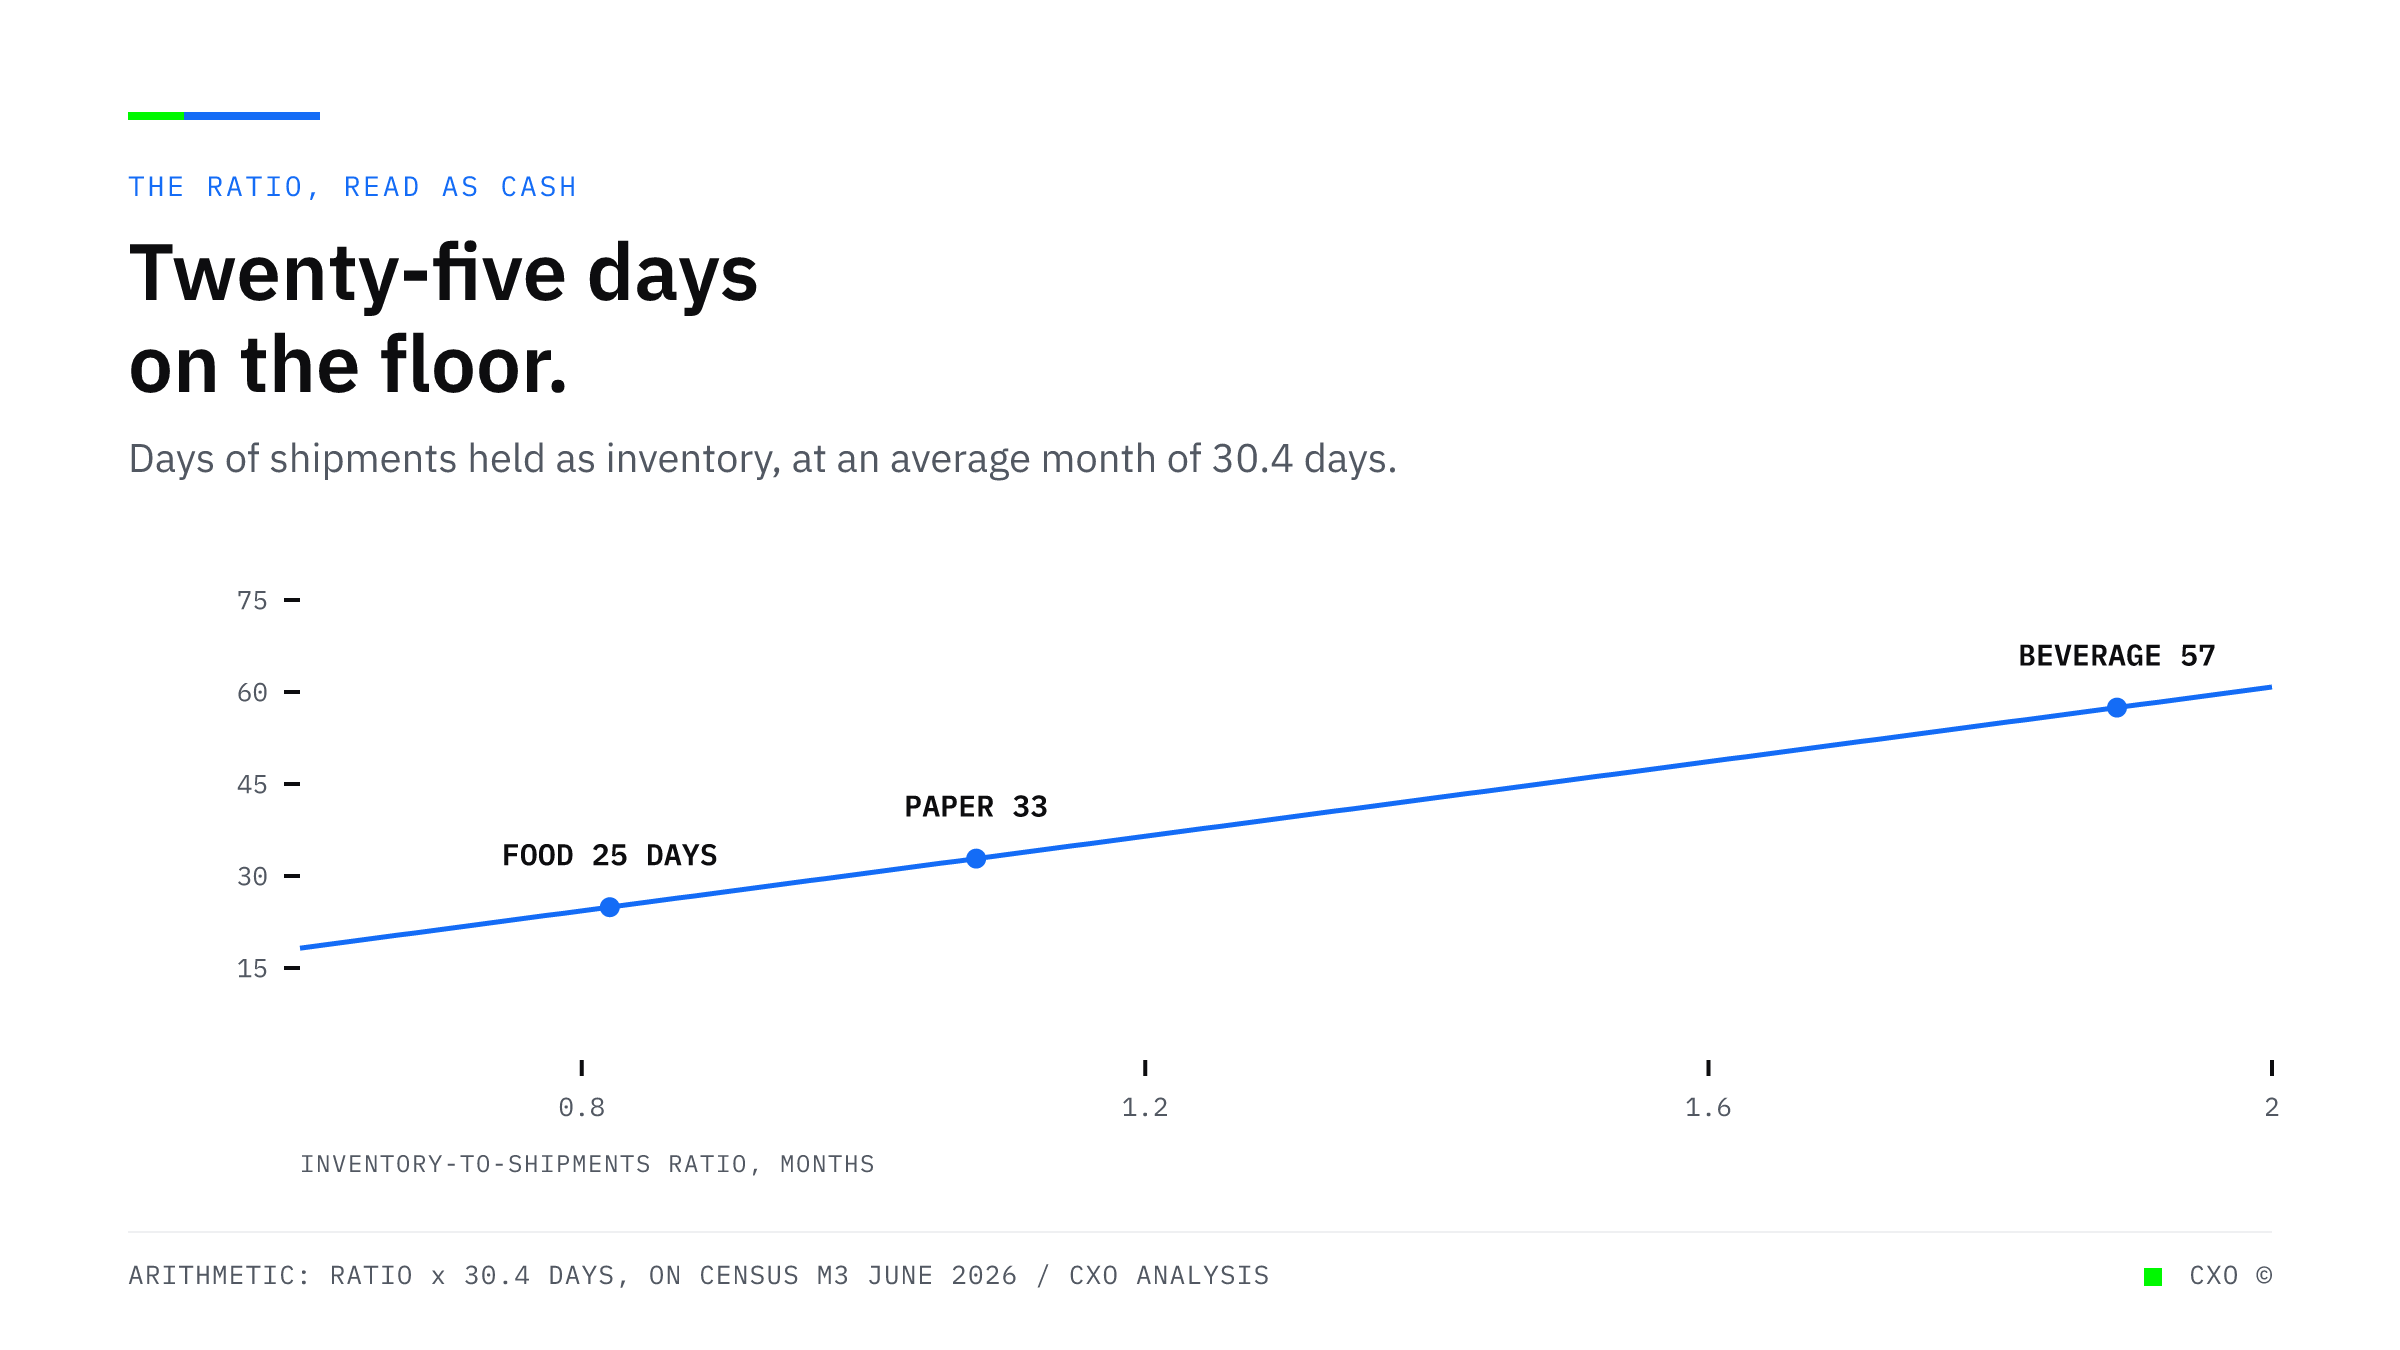
A curve showing days of shipments held as inventory rising with the inventory-to-shipments ratio, marked at food products with 0.82 and 25 days, paper products at 1.08 and 33 days, and beverage and tobacco at 1.89 and 57 days.

Food Manufacturers Carry 25 Days of Shipments as Inventory. Beverage Carries 57.

Inventory-to-shipments ratios of 0.82 for food and 1.89 for beverage and tobacco translate into very different working capital positions. The ratio is a cash number that most operations only read as a volume number.
View Insight
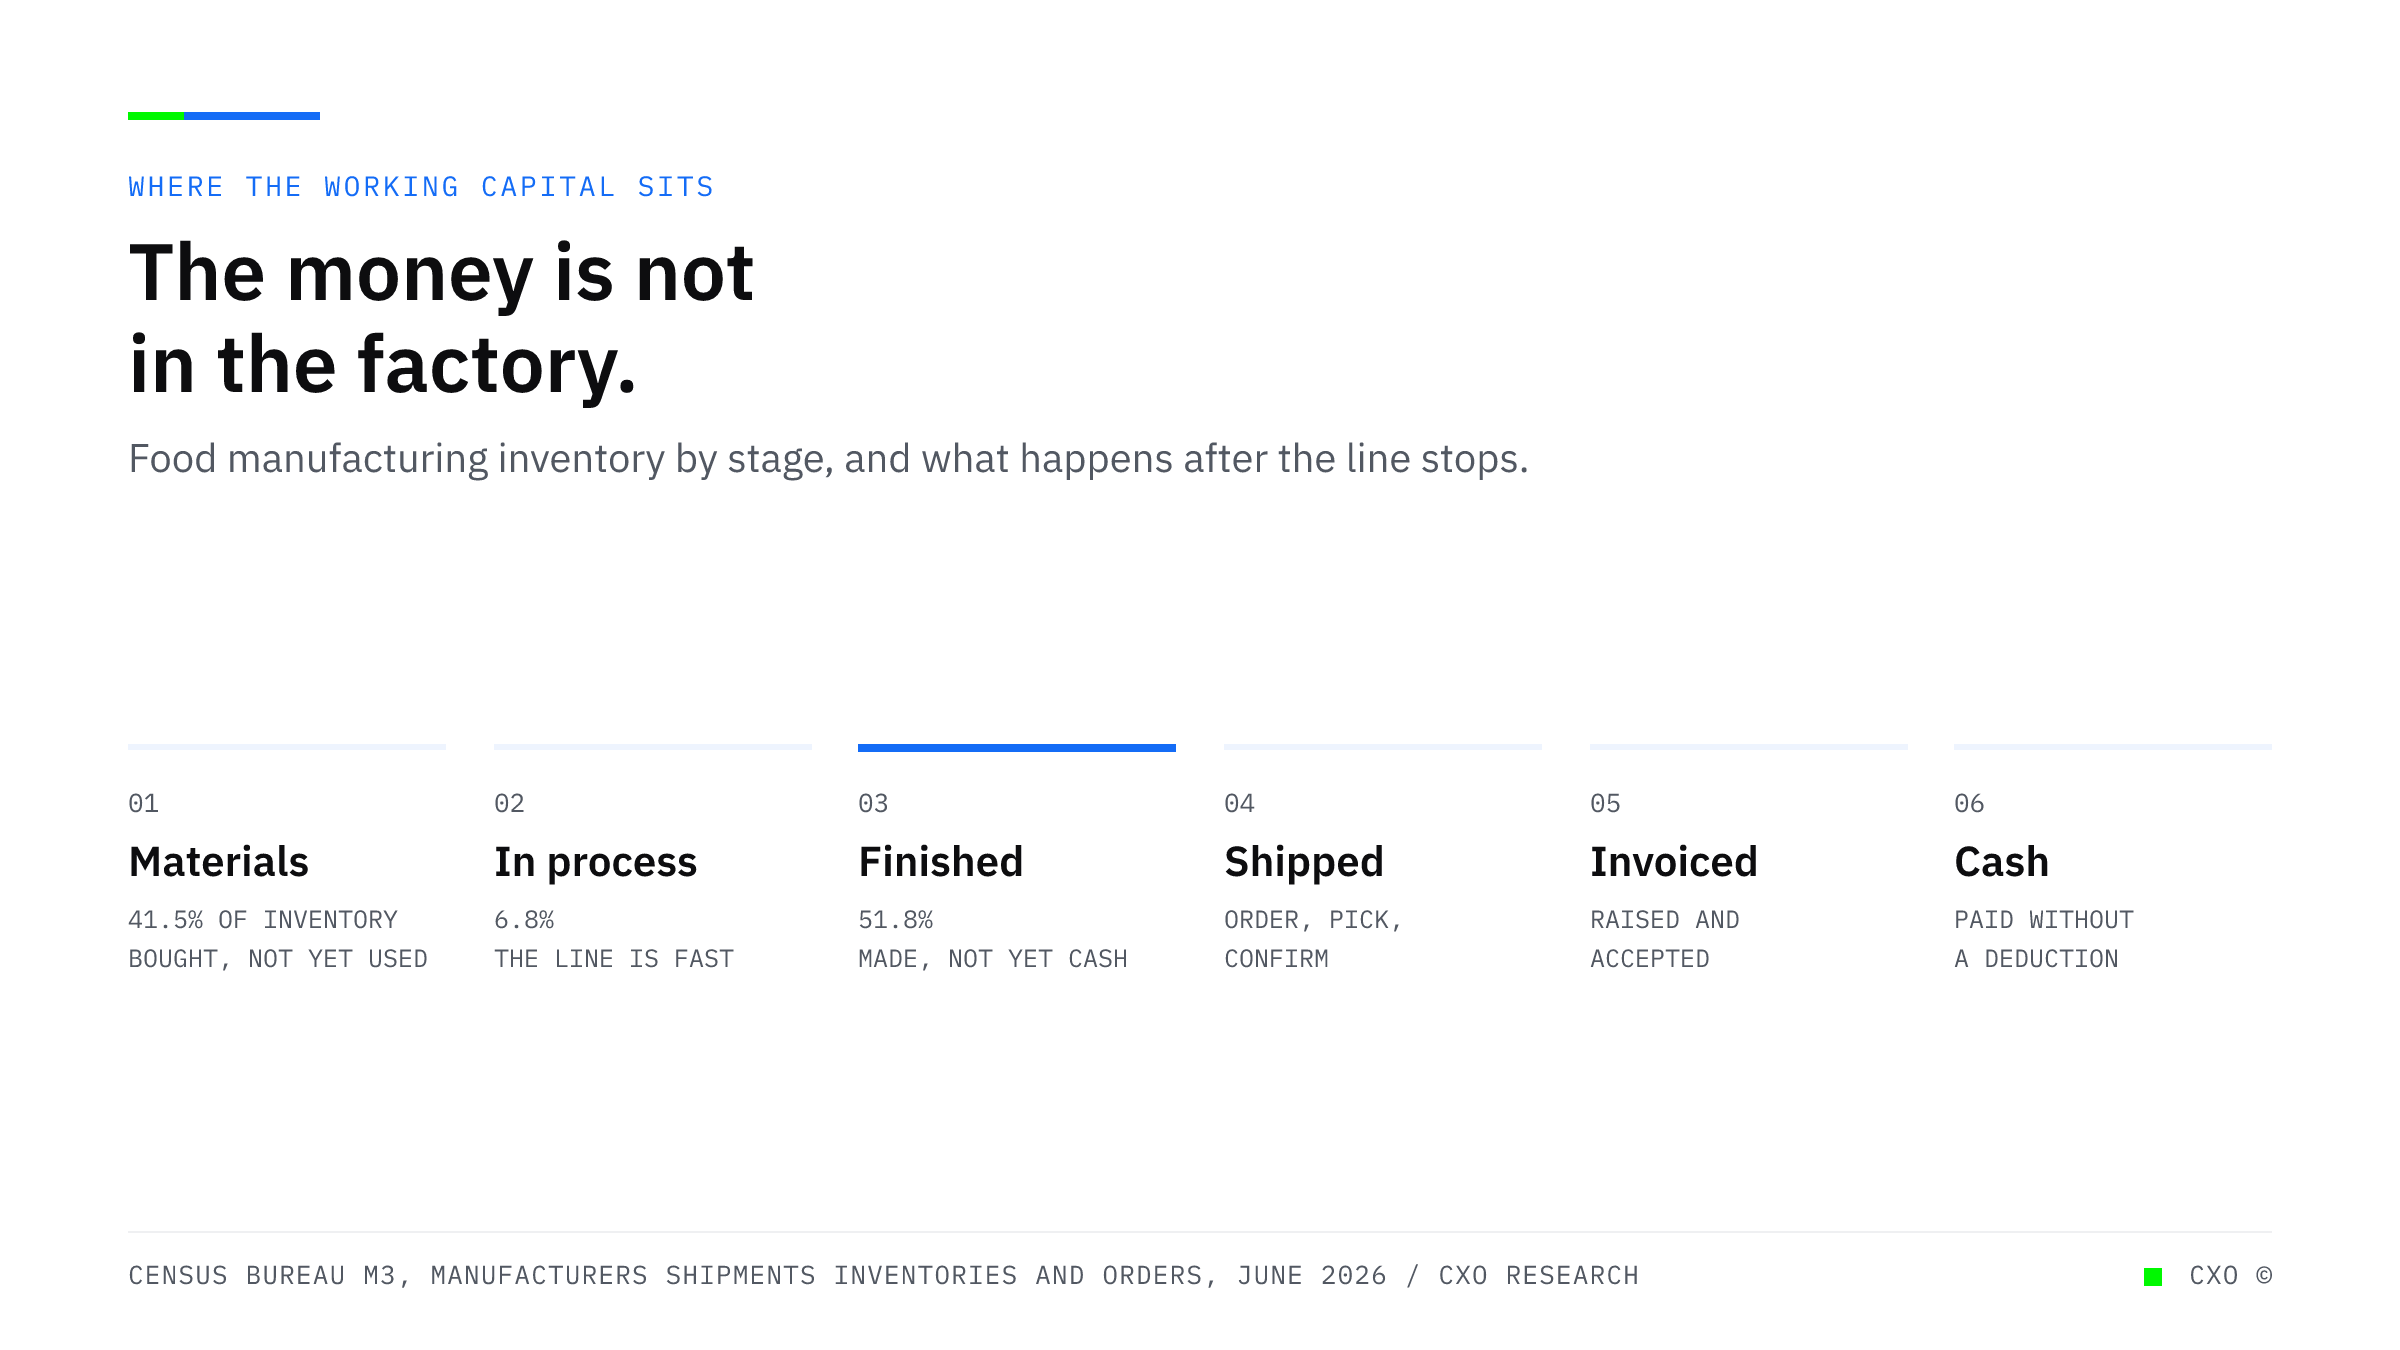
A labeled diagram of six stages from materials through cash, marking finished goods as the stage holding 51.8 percent of food manufacturing inventory against 6.8 percent in work in process.

Food Manufacturers Hold Half Their Inventory as Finished Goods. Only 7 Percent Is Actually Being Made.

Census data puts 51.8 percent of food manufacturing inventory in finished goods and 6.8 percent in work in process. The working capital is not tied up in production. It is tied up in everything that happens after production.
View Insight

Start with the process that costs you most.

A conversation first. A structured assessment when it earns one. Or see what a discovery finds before you book anything.

Book a discovery call See what a discovery finds