CXO Research

Insights

Selected writing from the practice.

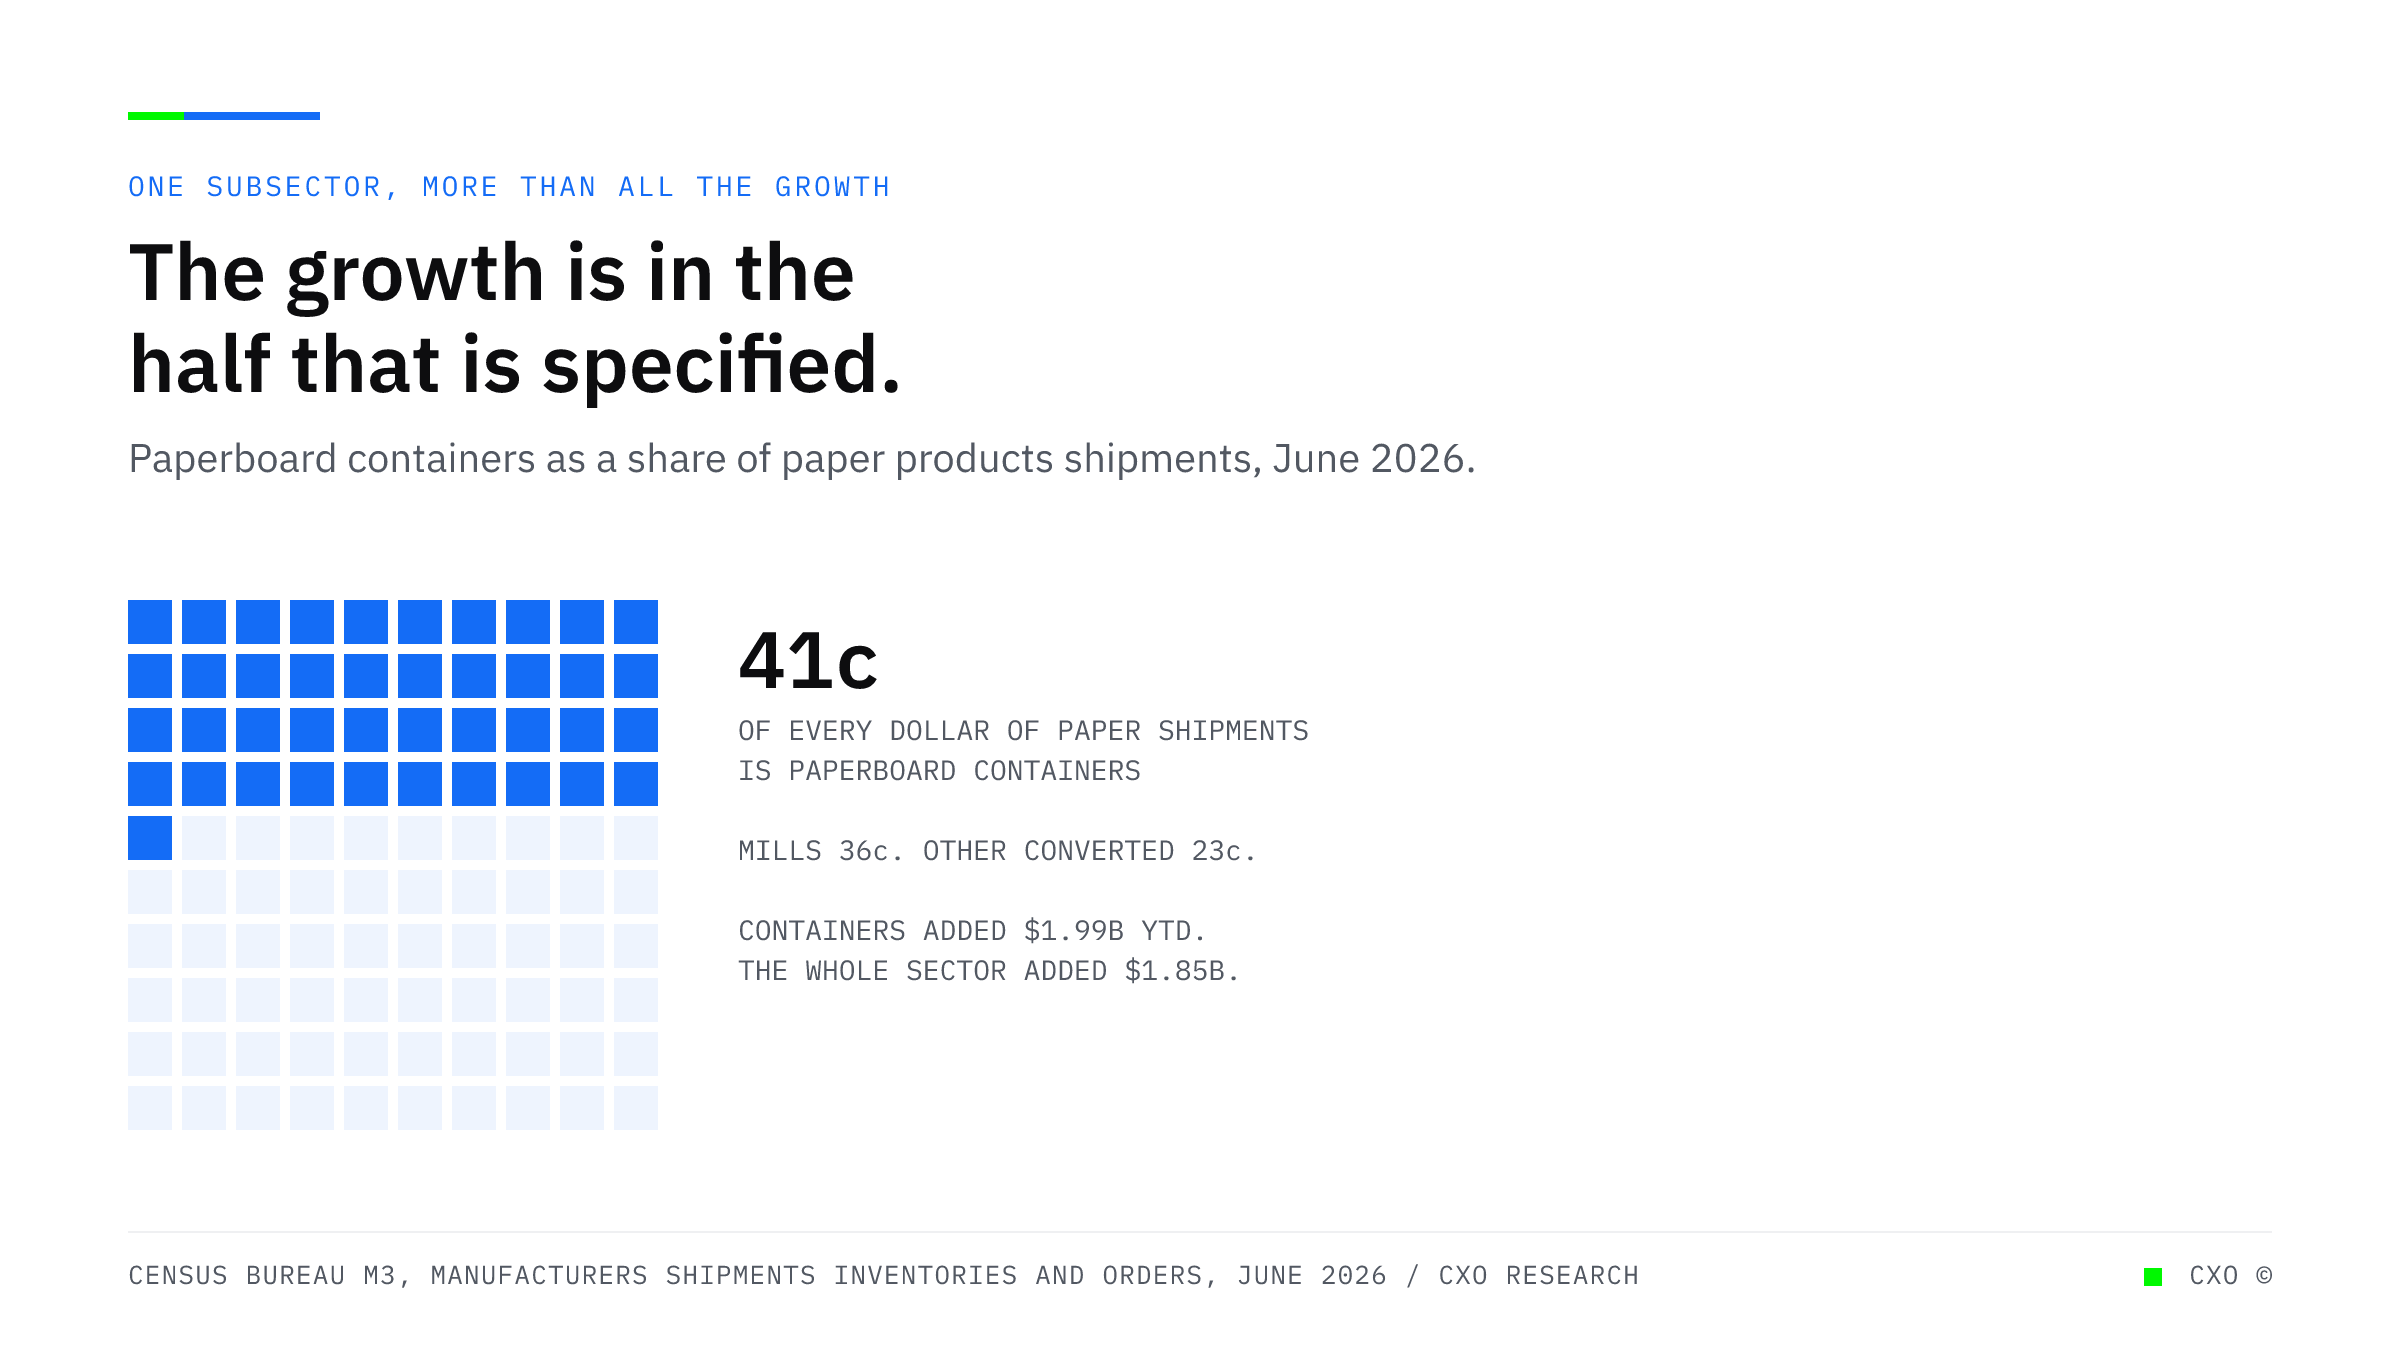
A waffle grid of 100 squares with 41 marked, showing that paperboard containers account for 41 cents of every dollar of paper products shipments, while pulp and paper mills account for 36 cents and other converted products the remainder.

All of the Growth in Paper Is in the Half That Has to Be Specified First

Paperboard containers added $1.99 billion of year-to-date shipments while the whole paper products sector added $1.85 billion. One subsector accounts for more than all the growth, and it is the one where every dollar arrives with a specification.
View Insight
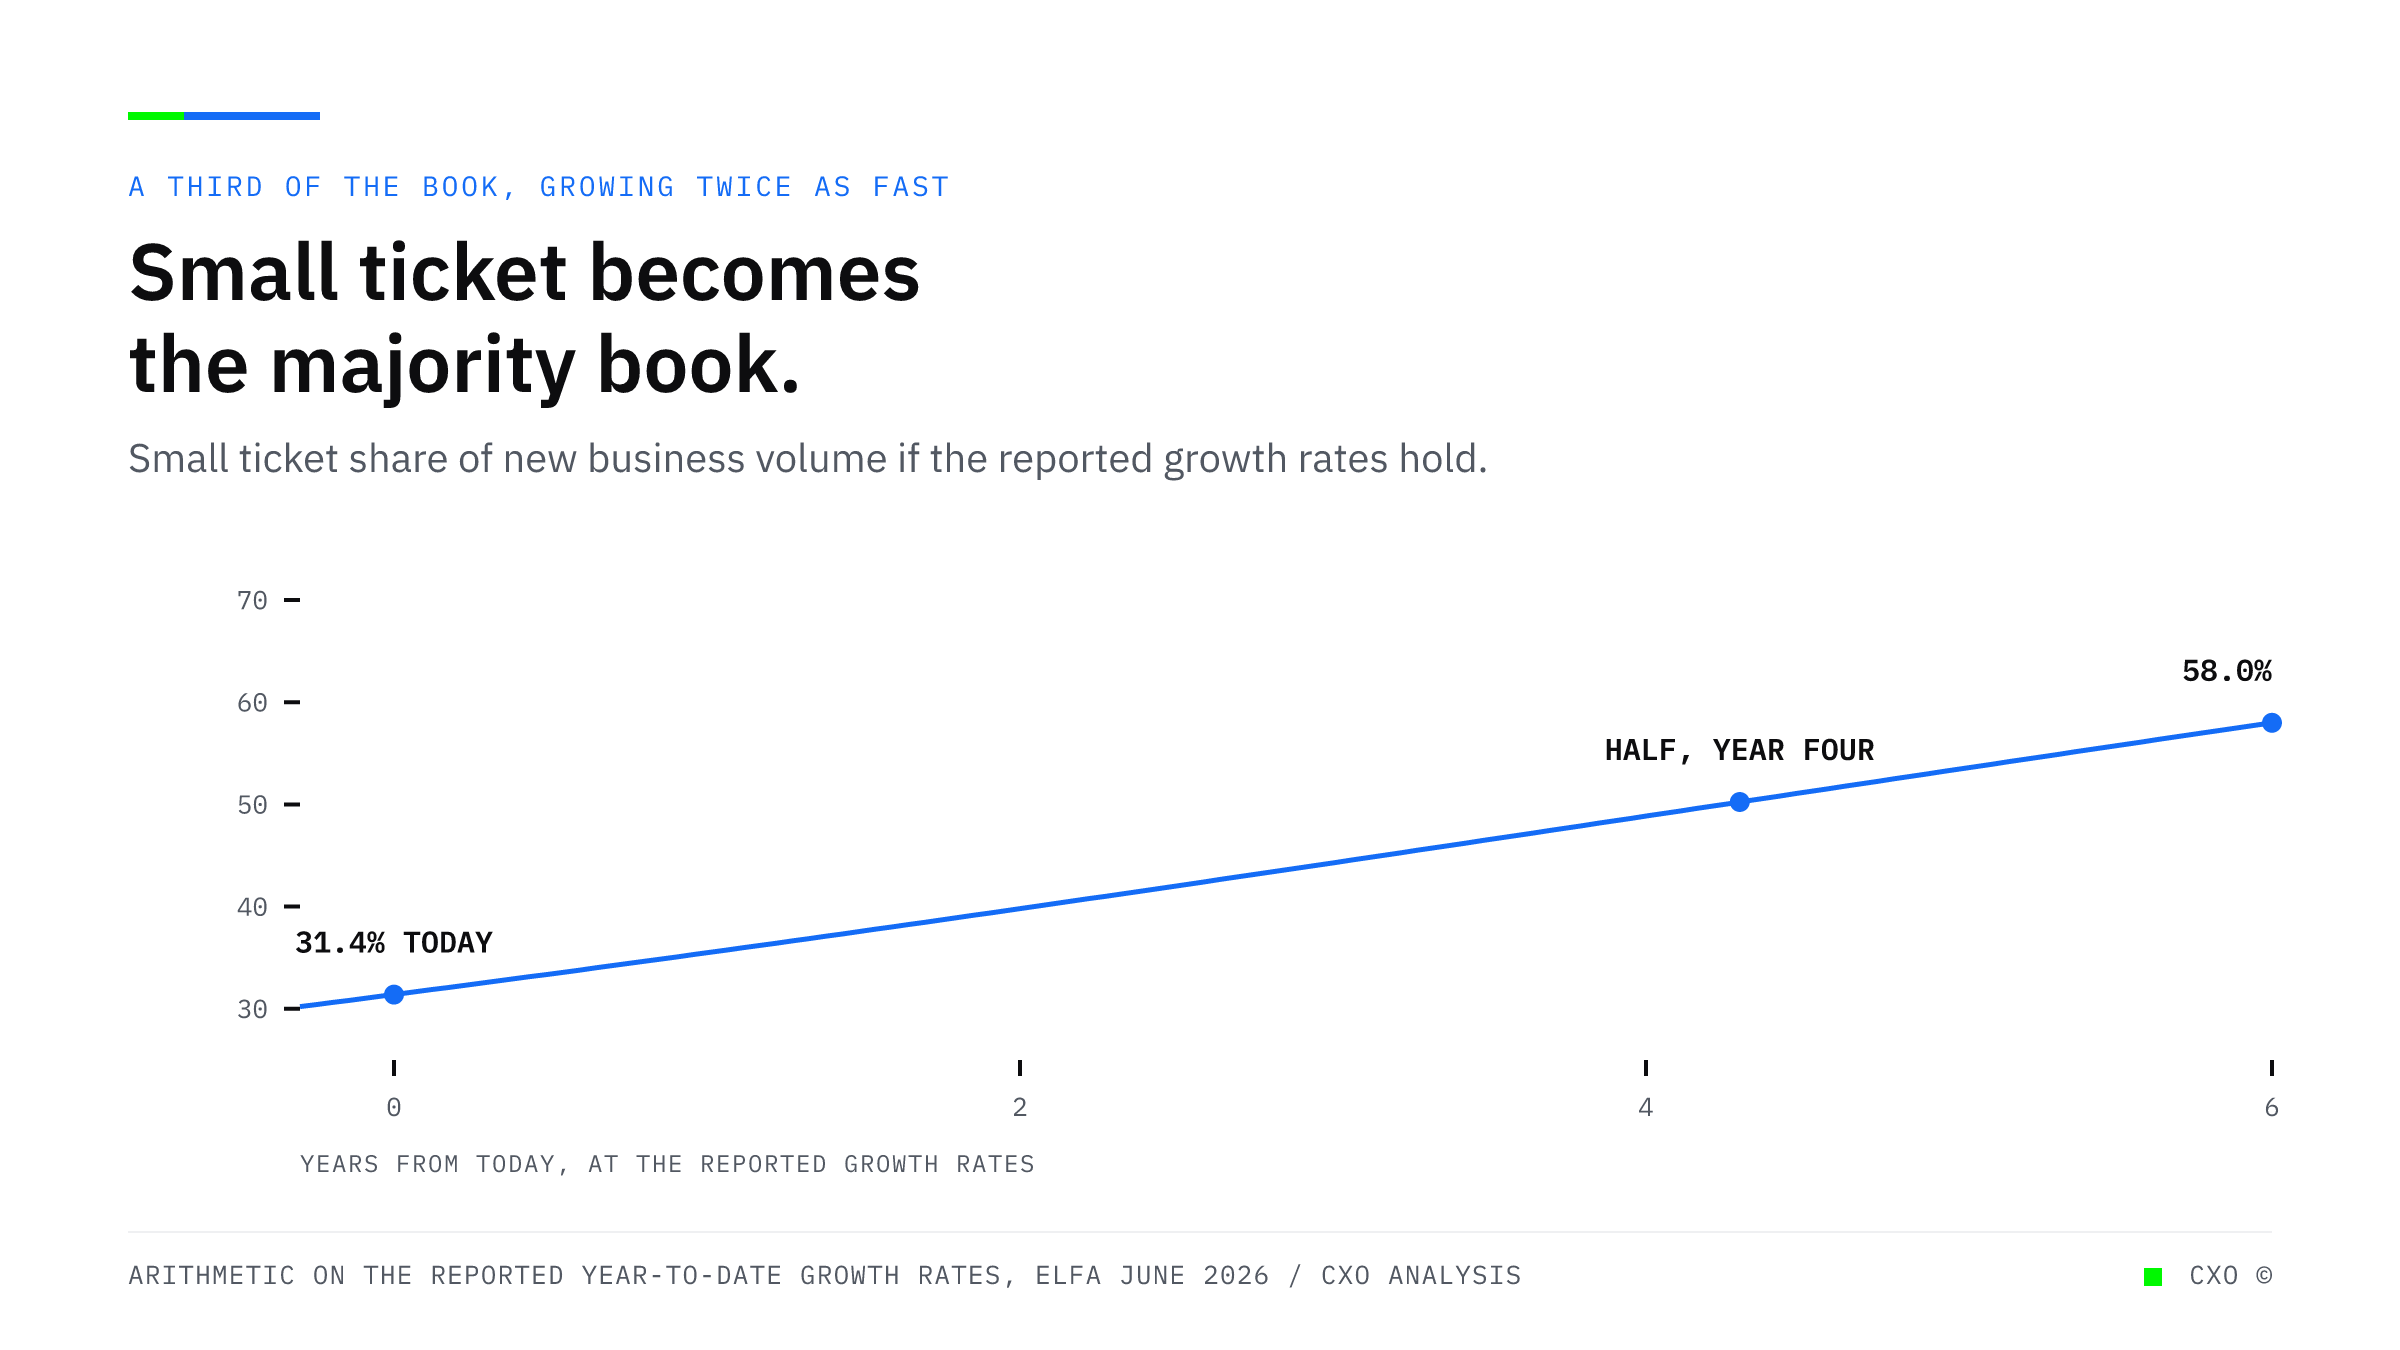
A rising curve showing the small ticket share of new business volume, starting at 31.4 percent today and reaching 50 percent in about four years and 58 percent in six, holding the reported year-to-date growth rates of 25.8 percent for small ticket and 11.3 percent overall.

Equipment Finance Is Growing Fastest in the Segment Where Margin Is Set by Cost Per Deal

Small ticket new business volume is up 25.8 percent year to date against 11.3 percent for the industry overall. The segment growing fastest is the one whose economics are decided by processing cost and cycle time rather than by credit spread.
View Insight
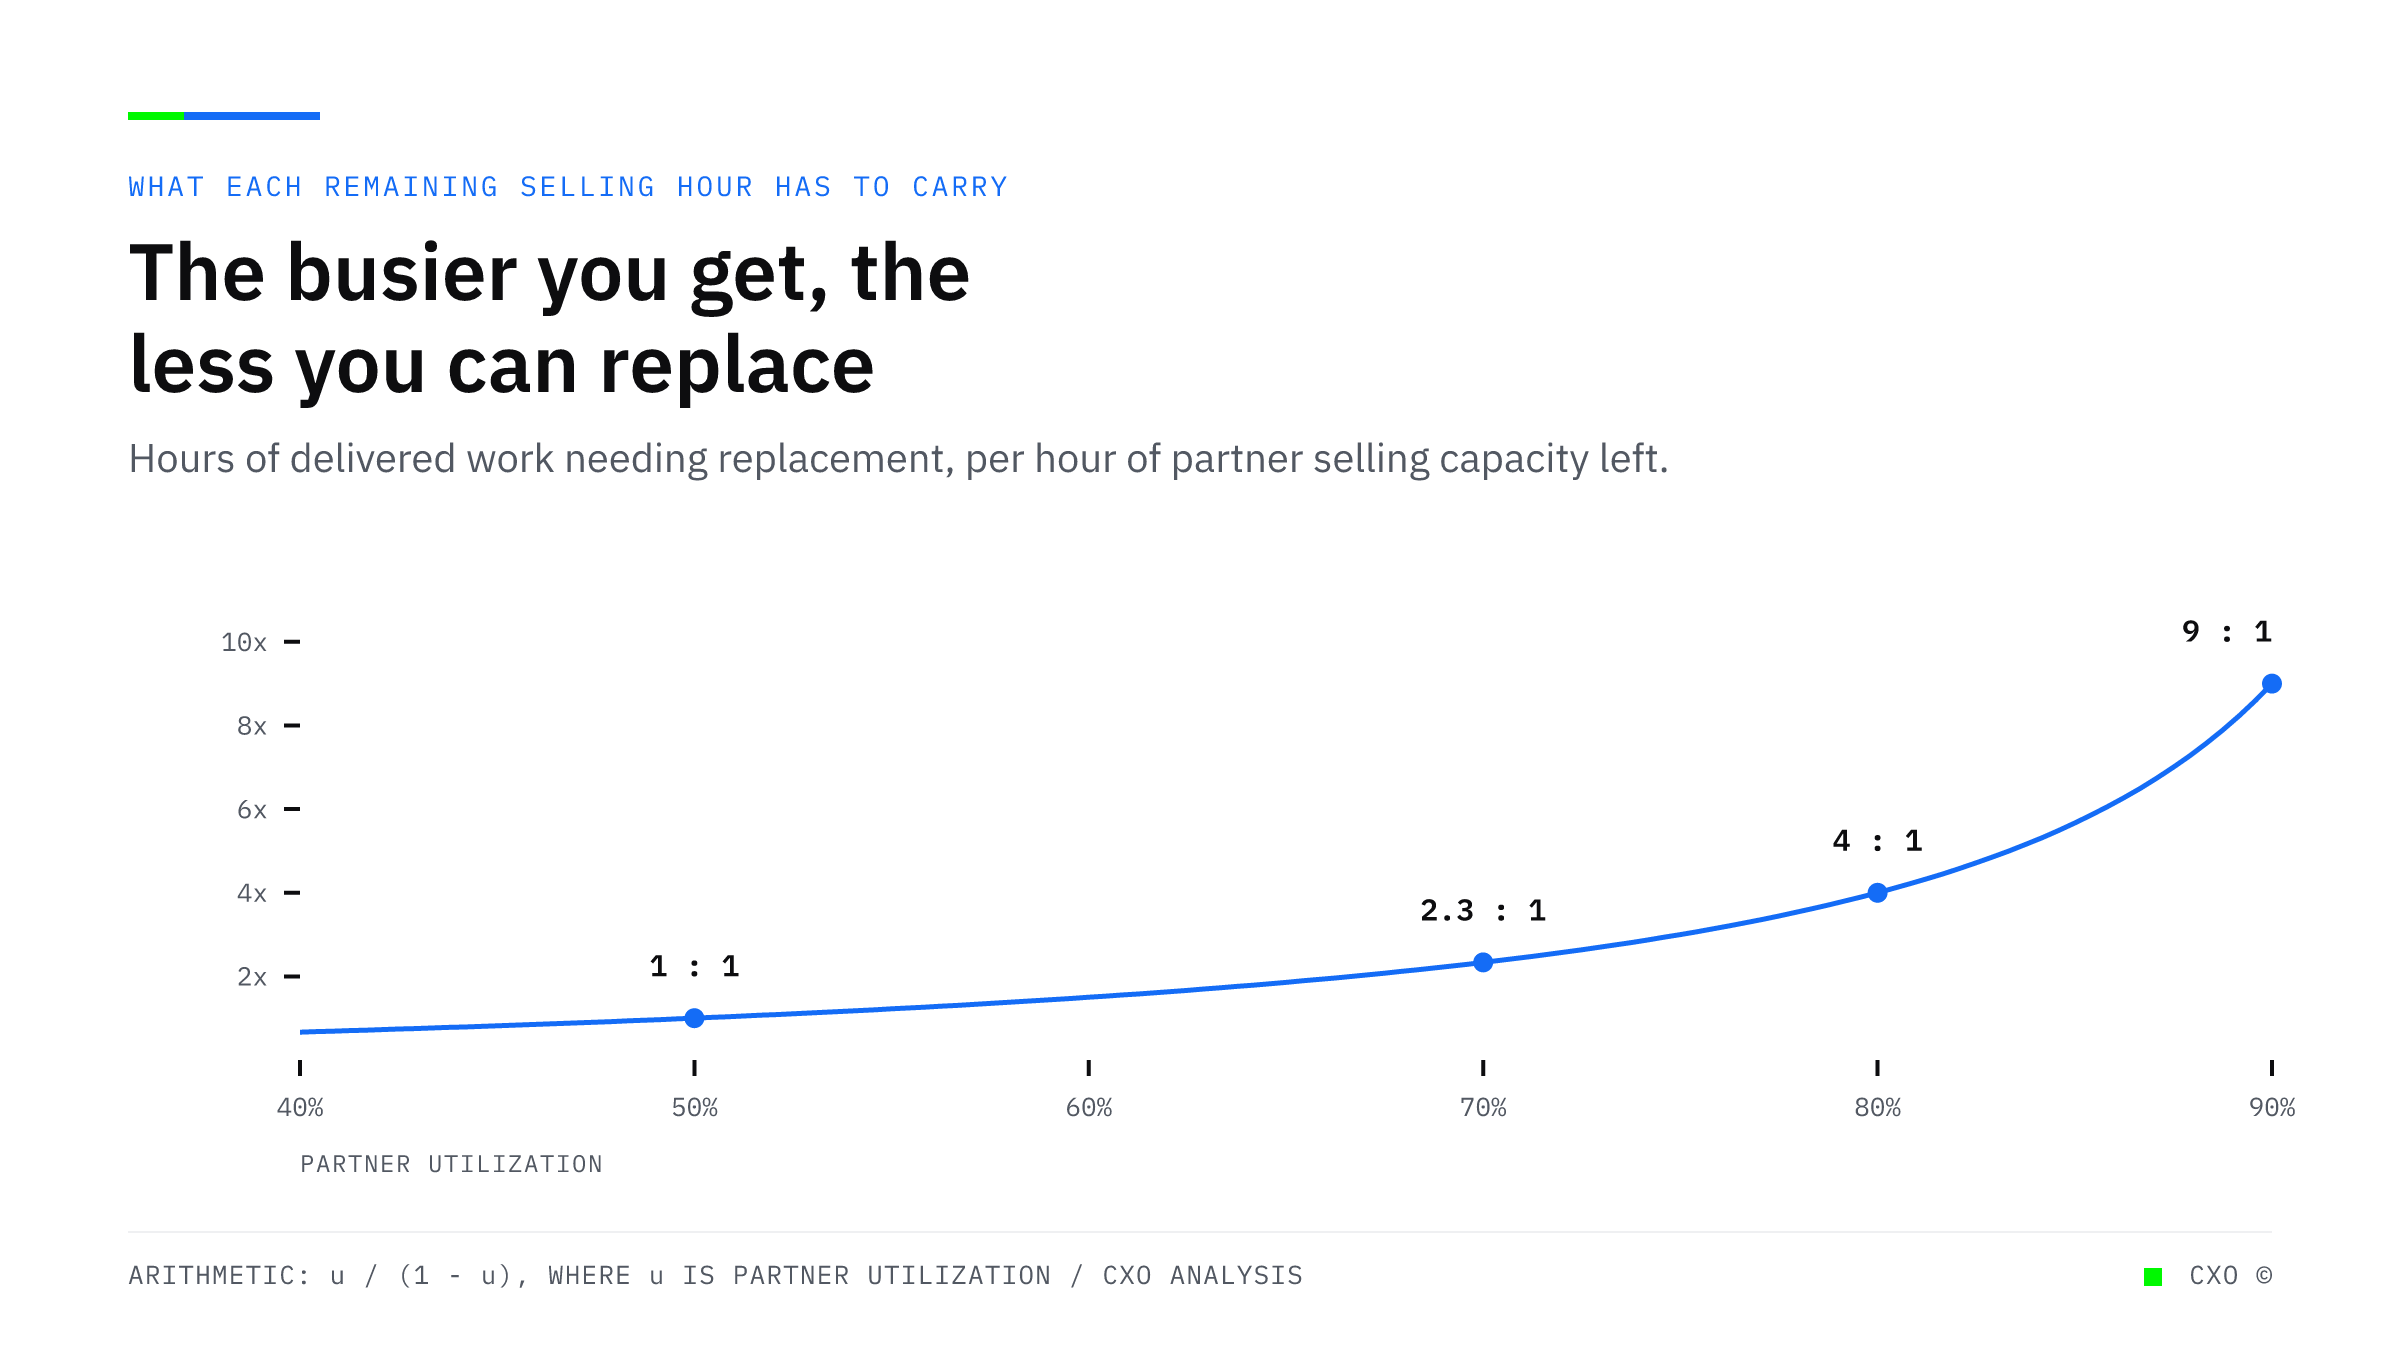
A rising curve showing hours of delivered work needing replacement per hour of remaining selling capacity, climbing from one to one at 50 percent partner utilization to four to one at 80 percent and nine to one at 90 percent.

Your Selling Capacity Is Whatever Delivery Did Not Consume. That Is Why the Firm Oscillates.

In a professional services firm the person who sells is the person who delivers, so business development is a residual rather than a budget. The arithmetic of that residual explains a revenue cycle most firms blame on the market.
View Insight
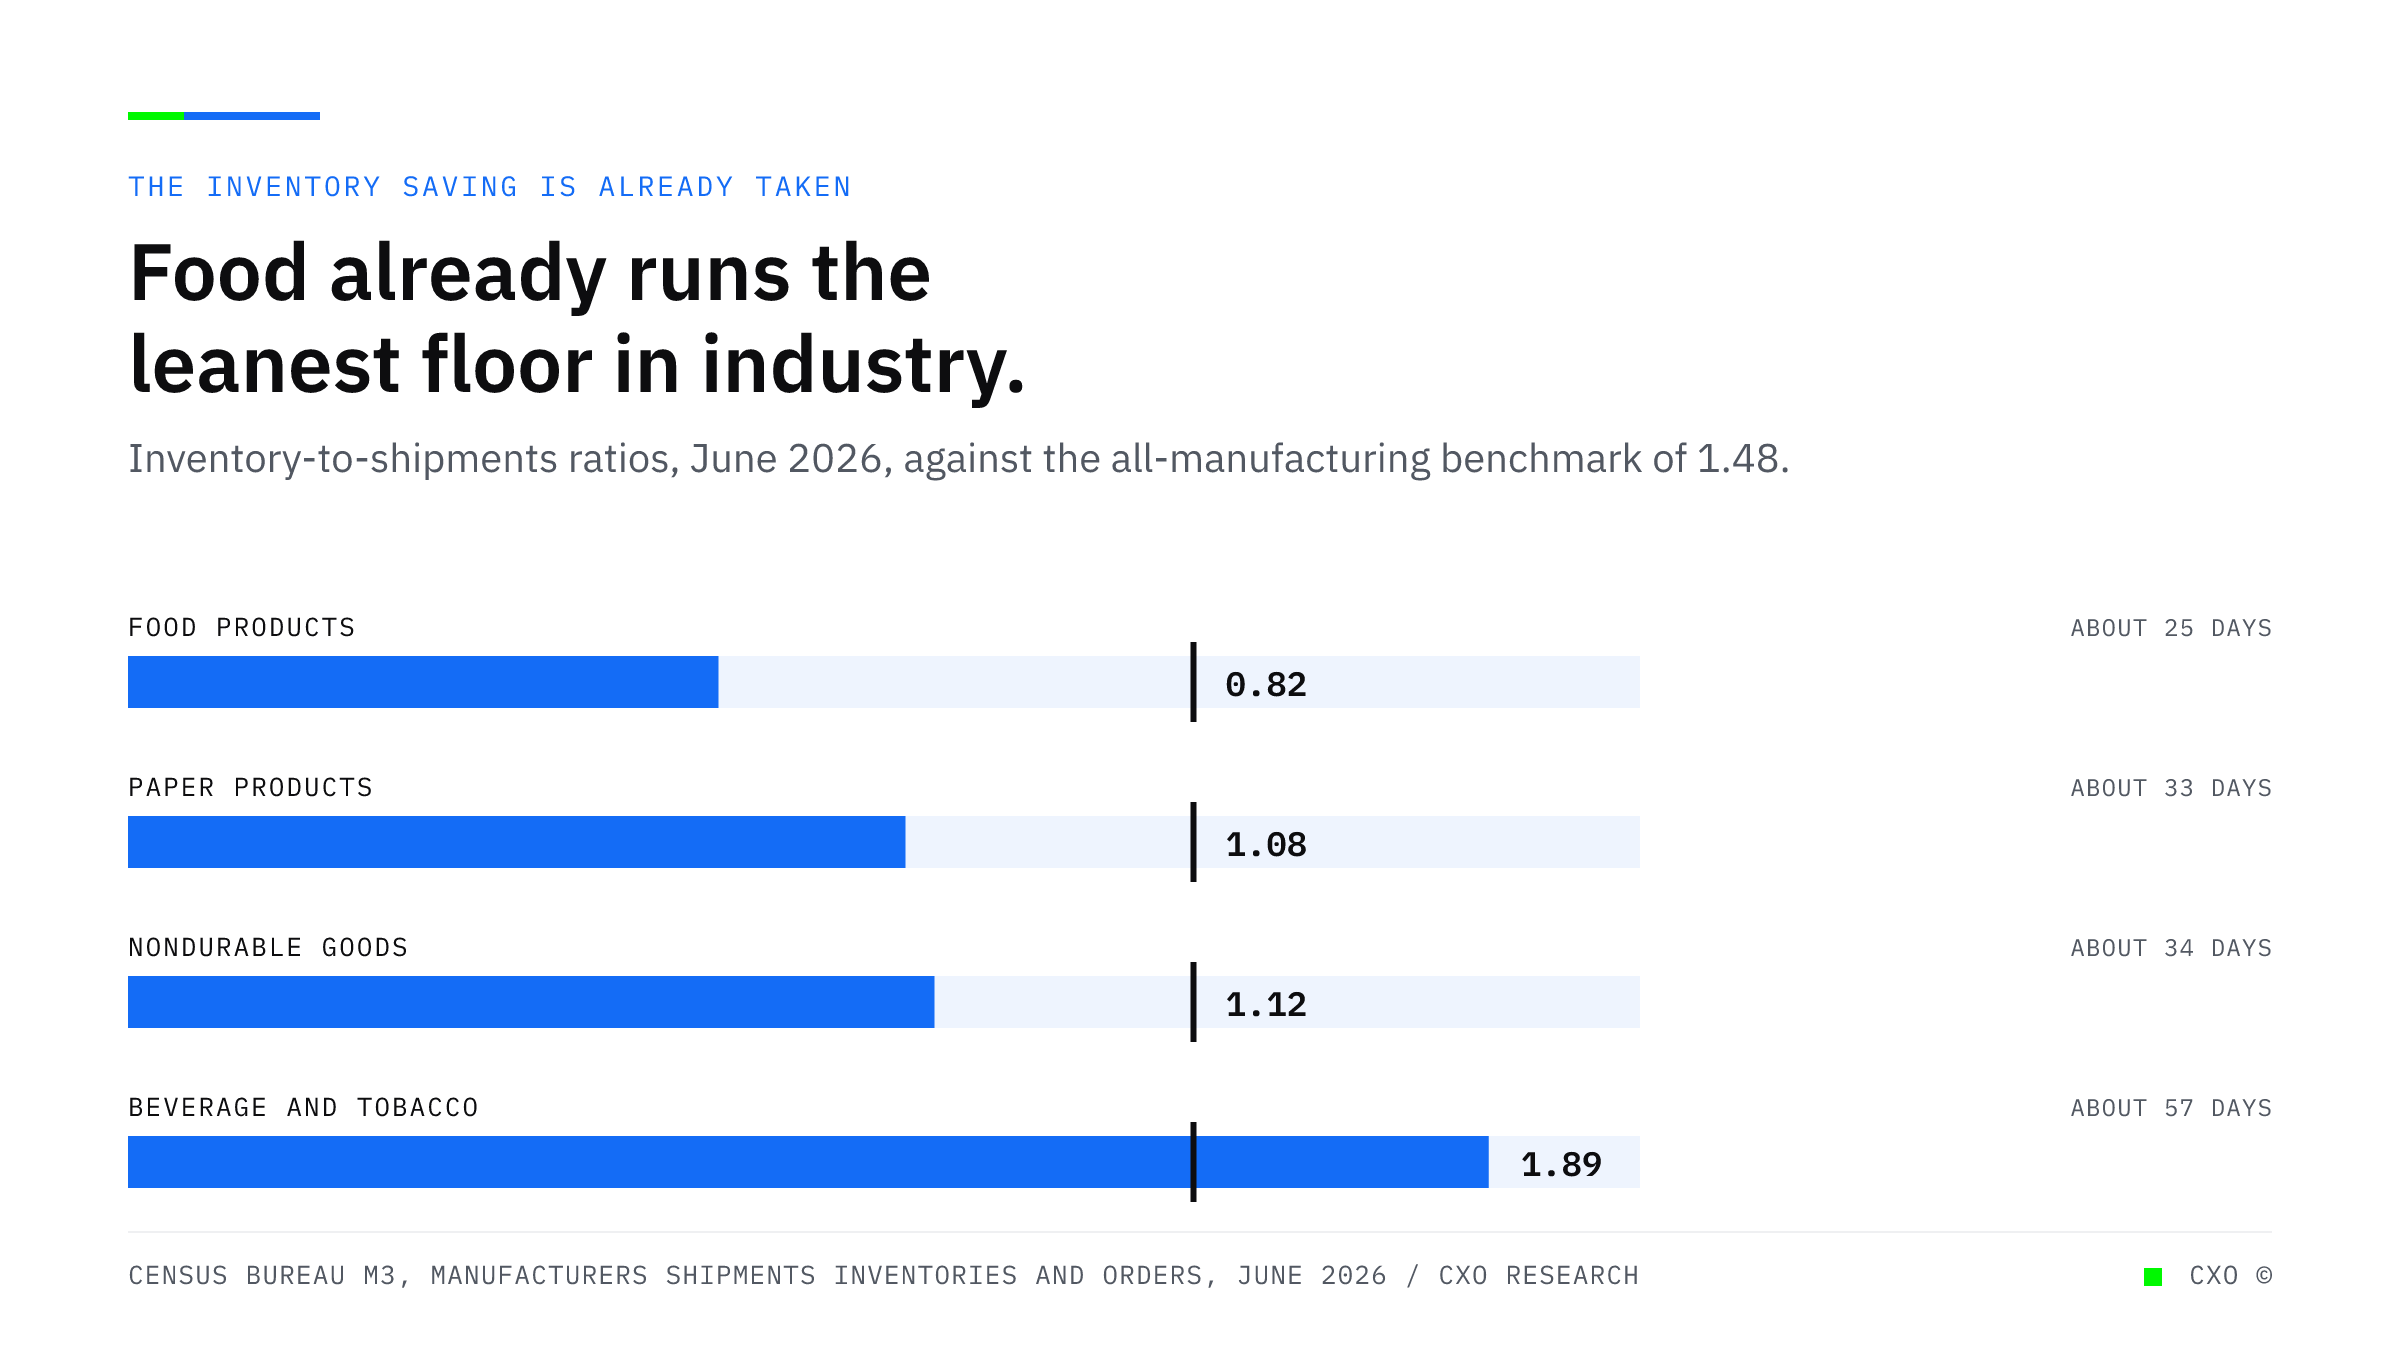
Bullet bars showing inventory-to-shipments ratios in June 2026: food products at 0.82, paper products at 1.08, nondurable goods at 1.12, and beverage and tobacco at 1.89, each measured against the all-manufacturing benchmark of 1.48.

Food Manufacturing Already Runs the Leanest Inventory in Manufacturing. The Next Dollar Is Somewhere Else.

Food products carry an inventory-to-shipments ratio of 0.82 against 1.48 for manufacturing overall. The inventory savings are already taken, so the remaining working capital sits in the order-to-cash cycle, not on the floor.
View Insight
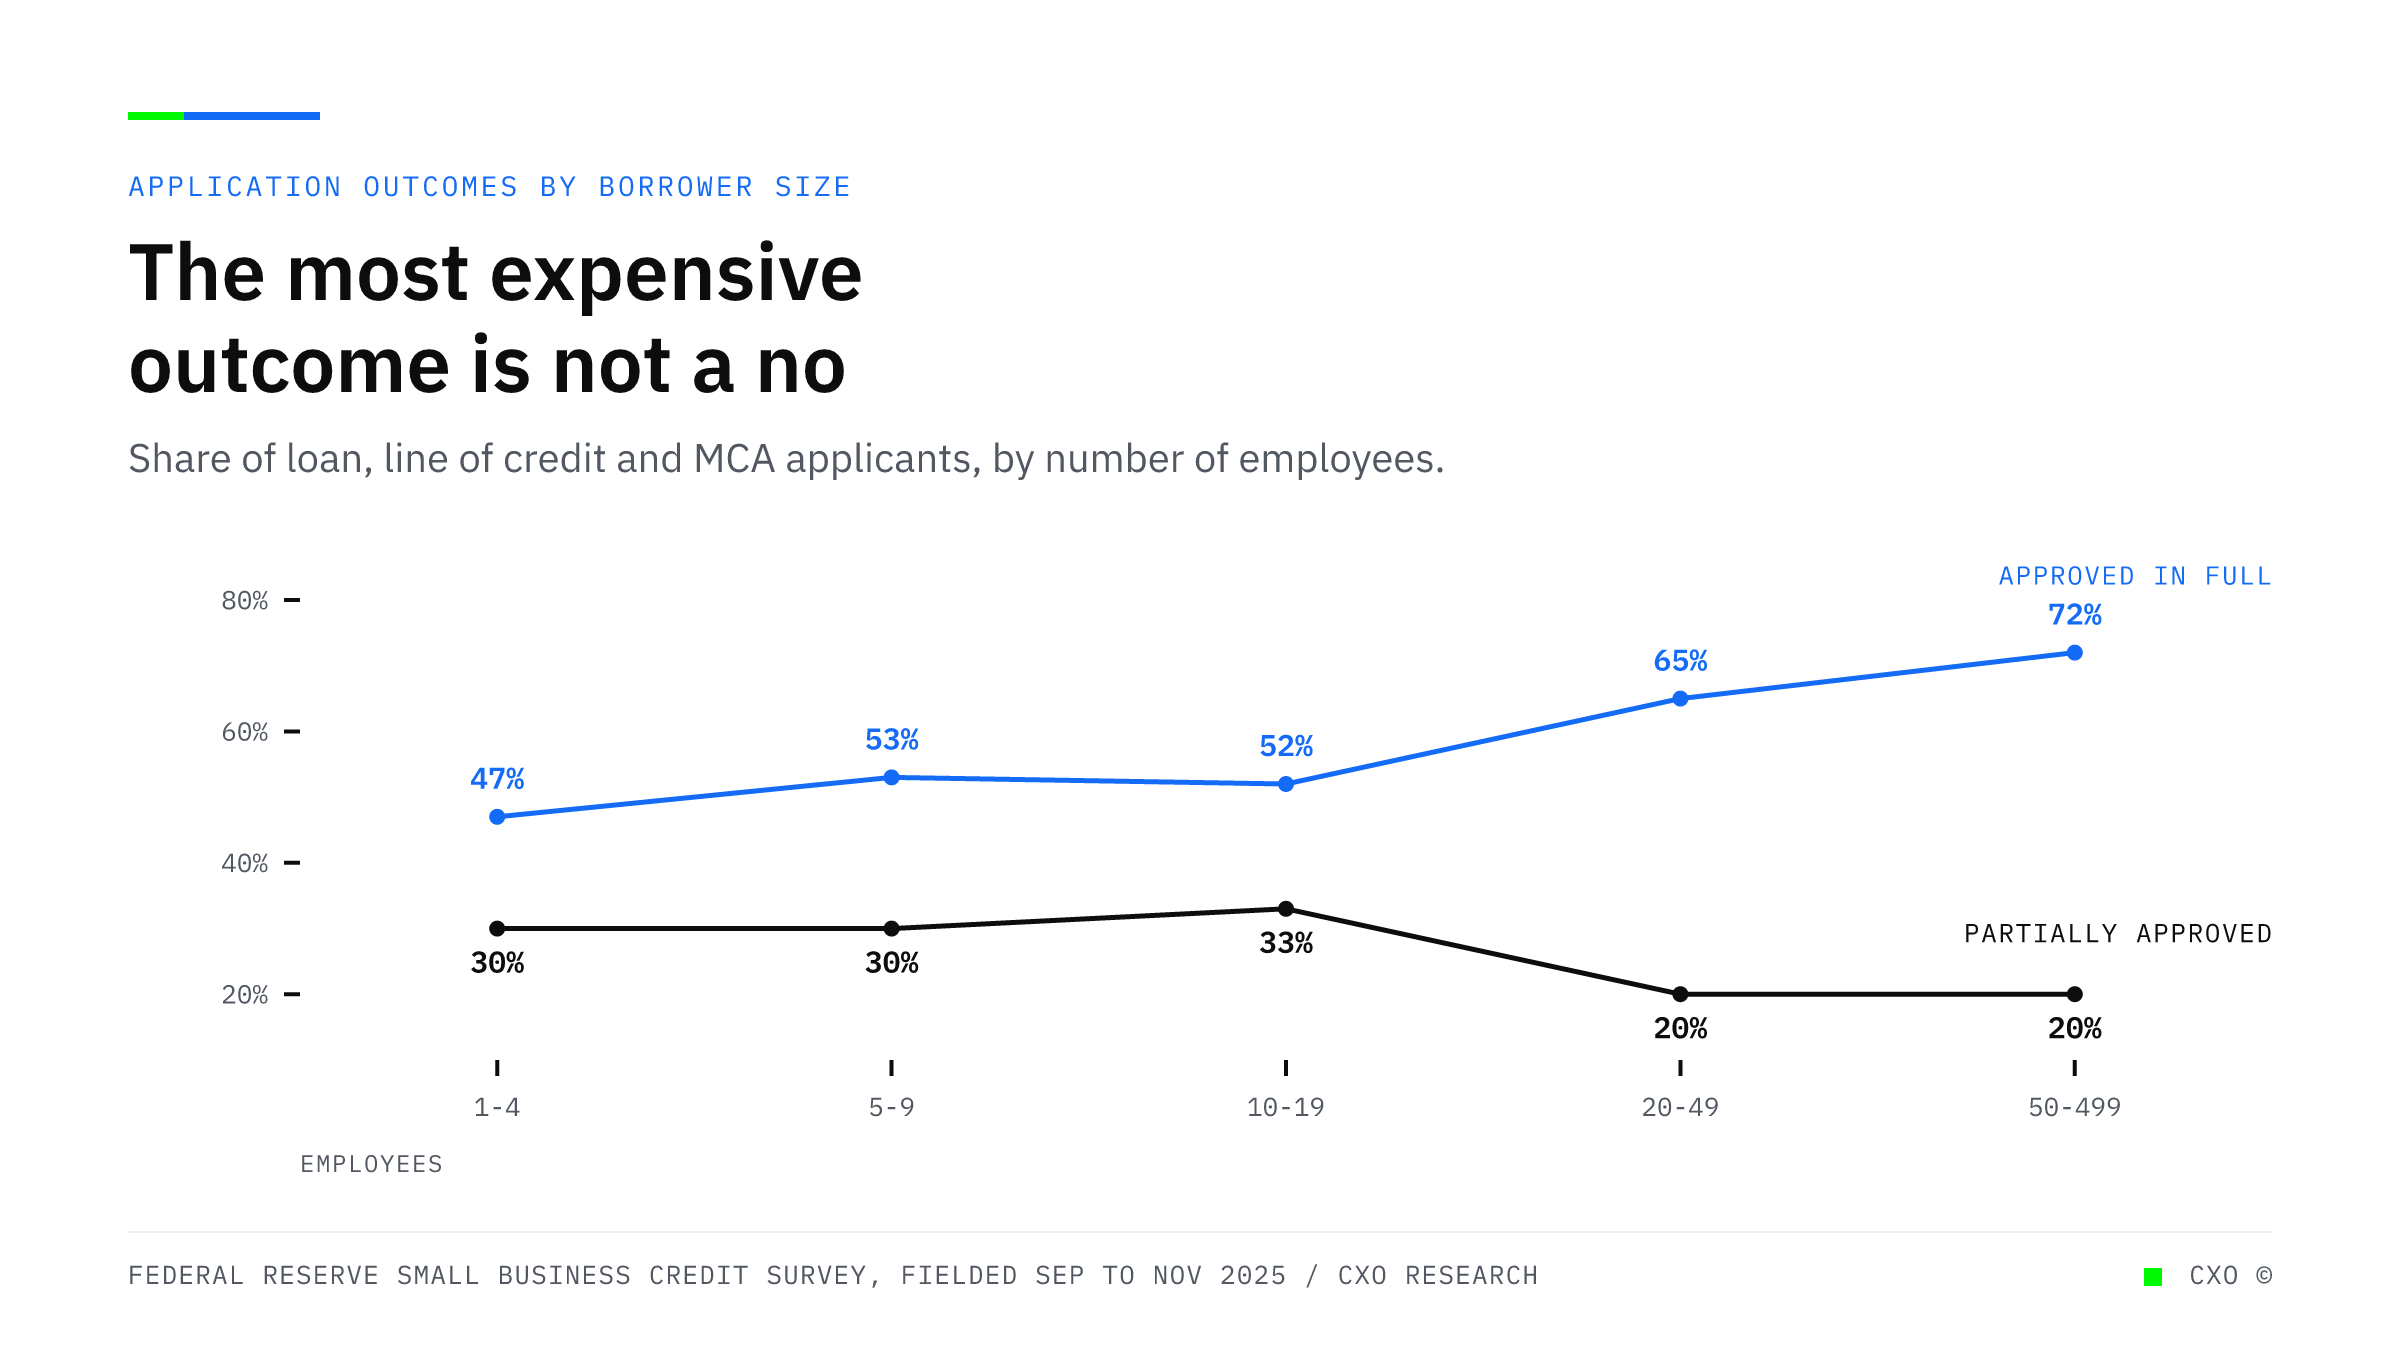
Two lines across five employment size bands: applications approved in full rise from 47 percent at firms with 1 to 4 employees to 72 percent at 50 to 499, while partial approvals fall from 30 percent to 20 percent.

The Most Expensive Outcome in Your Book Is Not a Decline. It Is a Partial Approval.

Approval rate counts a partial as a win. It is the one outcome that consumes the entire cost of a yes and books a fraction of the revenue, and it concentrates in exactly the size band the non-bank channel serves.
View Insight
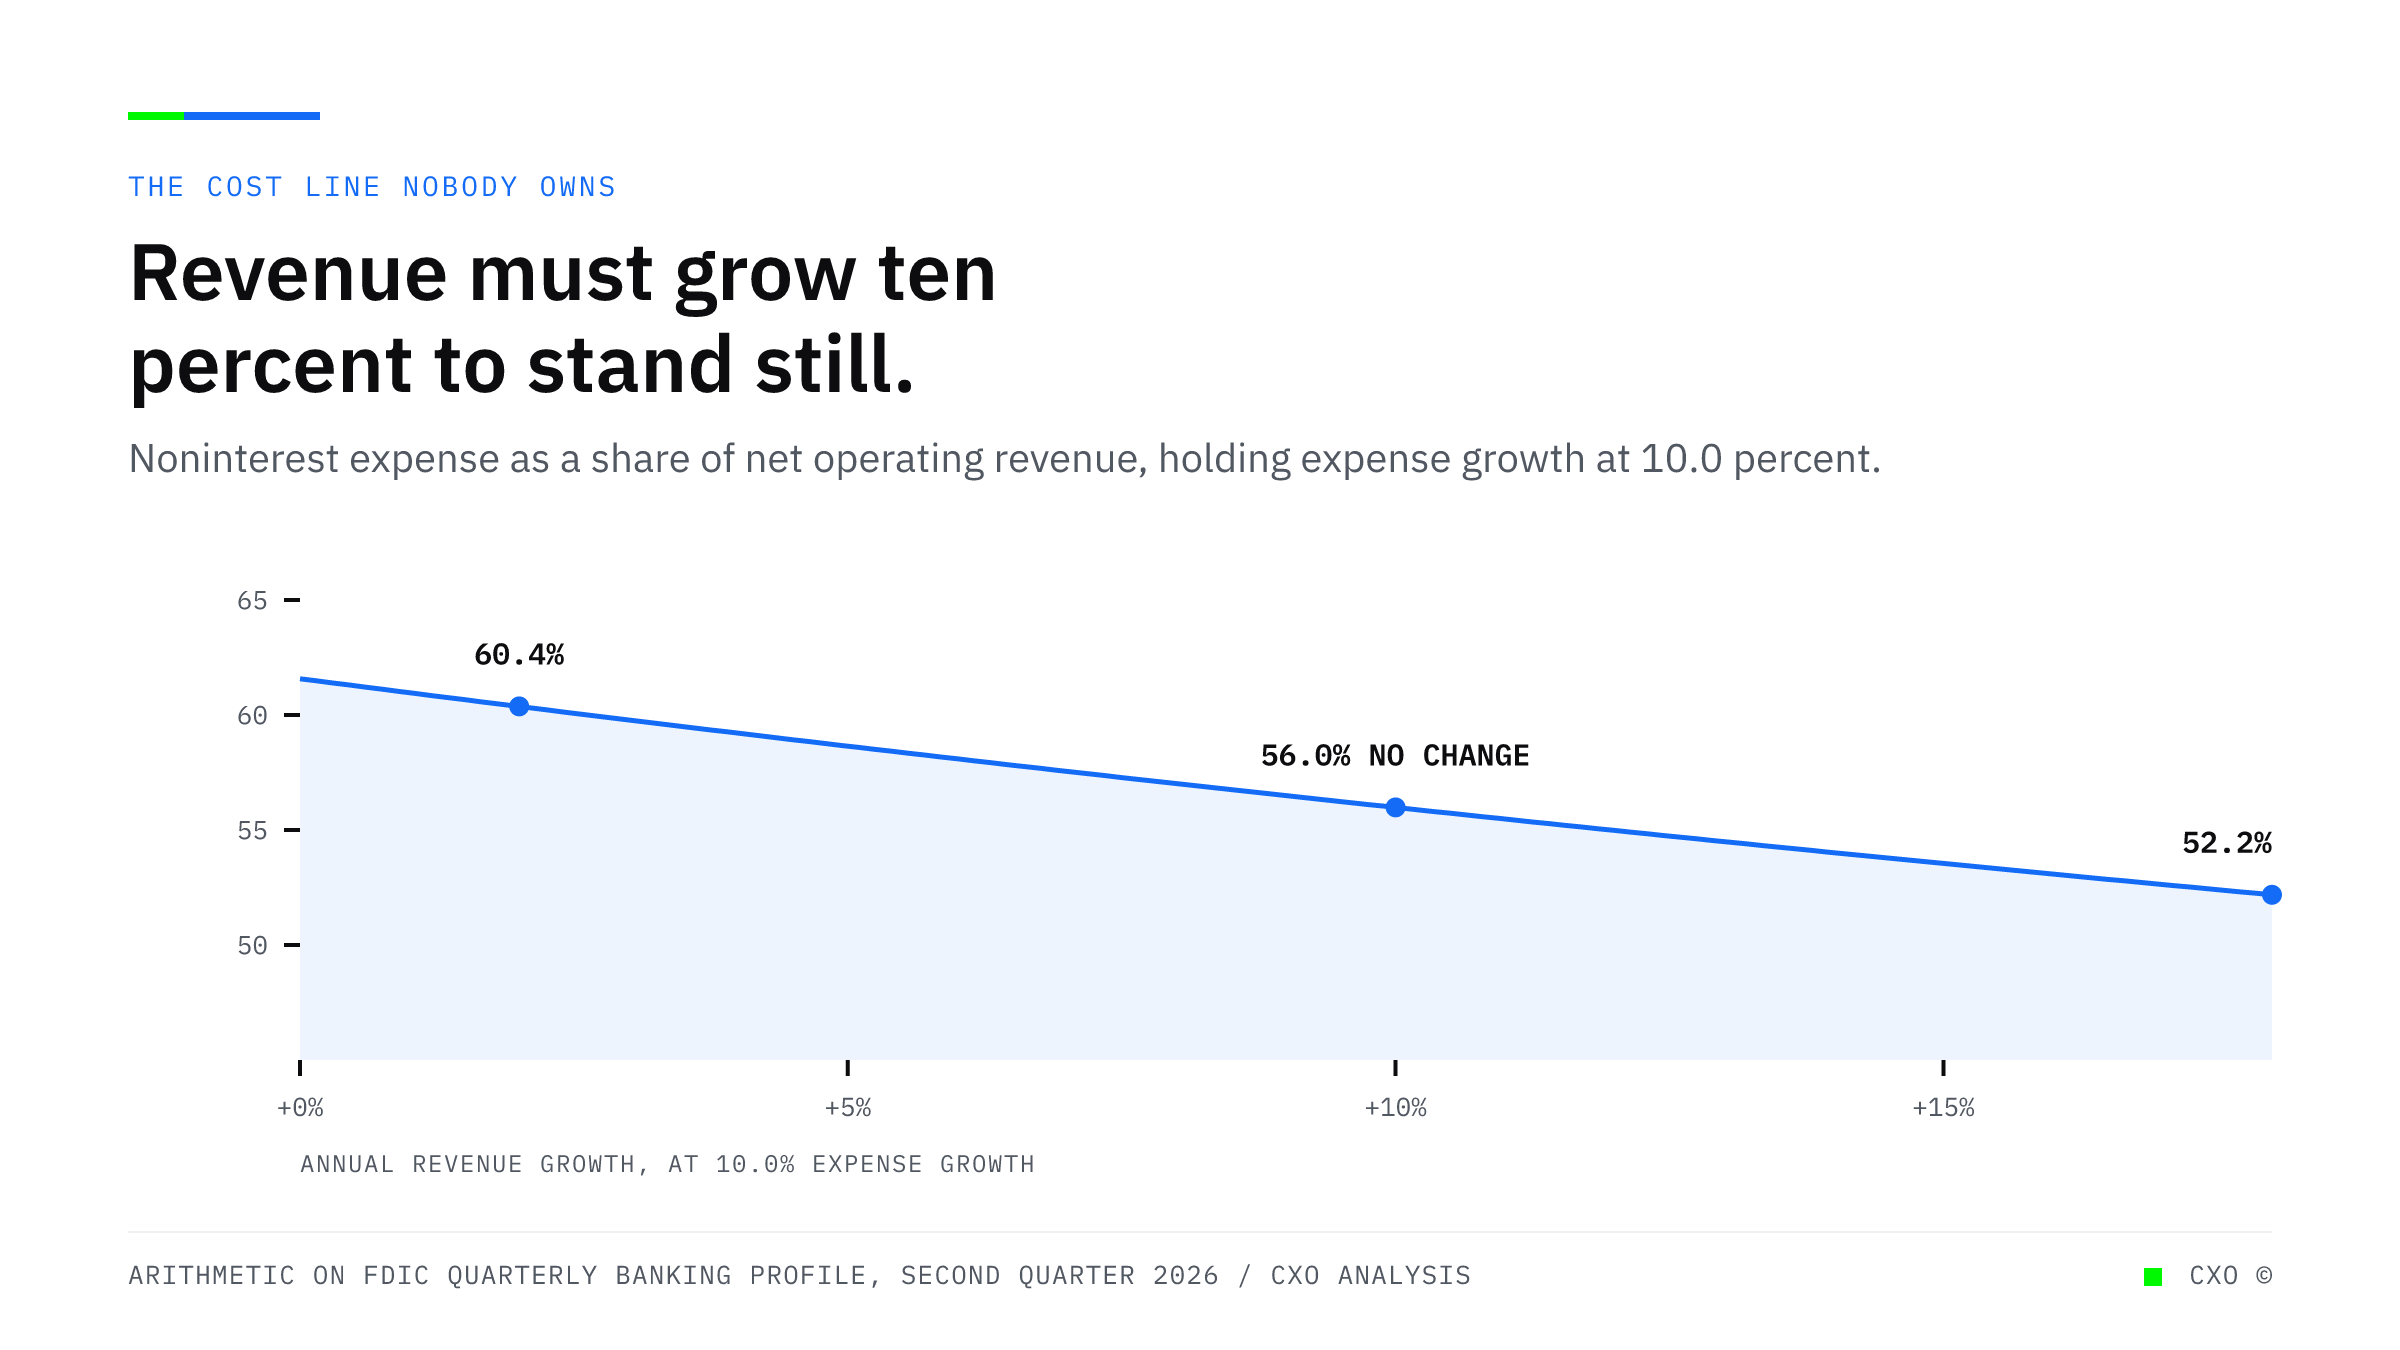
A curve showing noninterest expense as a share of net operating revenue at insured institutions, holding expense growth at 10 percent, falling from about 62 percent at flat revenue to about 52 percent at 18 percent revenue growth, and crossing today's share only when revenue also grows 10 percent.

The Fastest Growing Cost in Banking Is the One That Has No Owner

All other noninterest expense at insured institutions rose 14.7 percent over the year while salaries rose 6.6 percent. The line growing fastest is the one no executive owns, which makes it structural rather than a budgeting problem.
View Insight
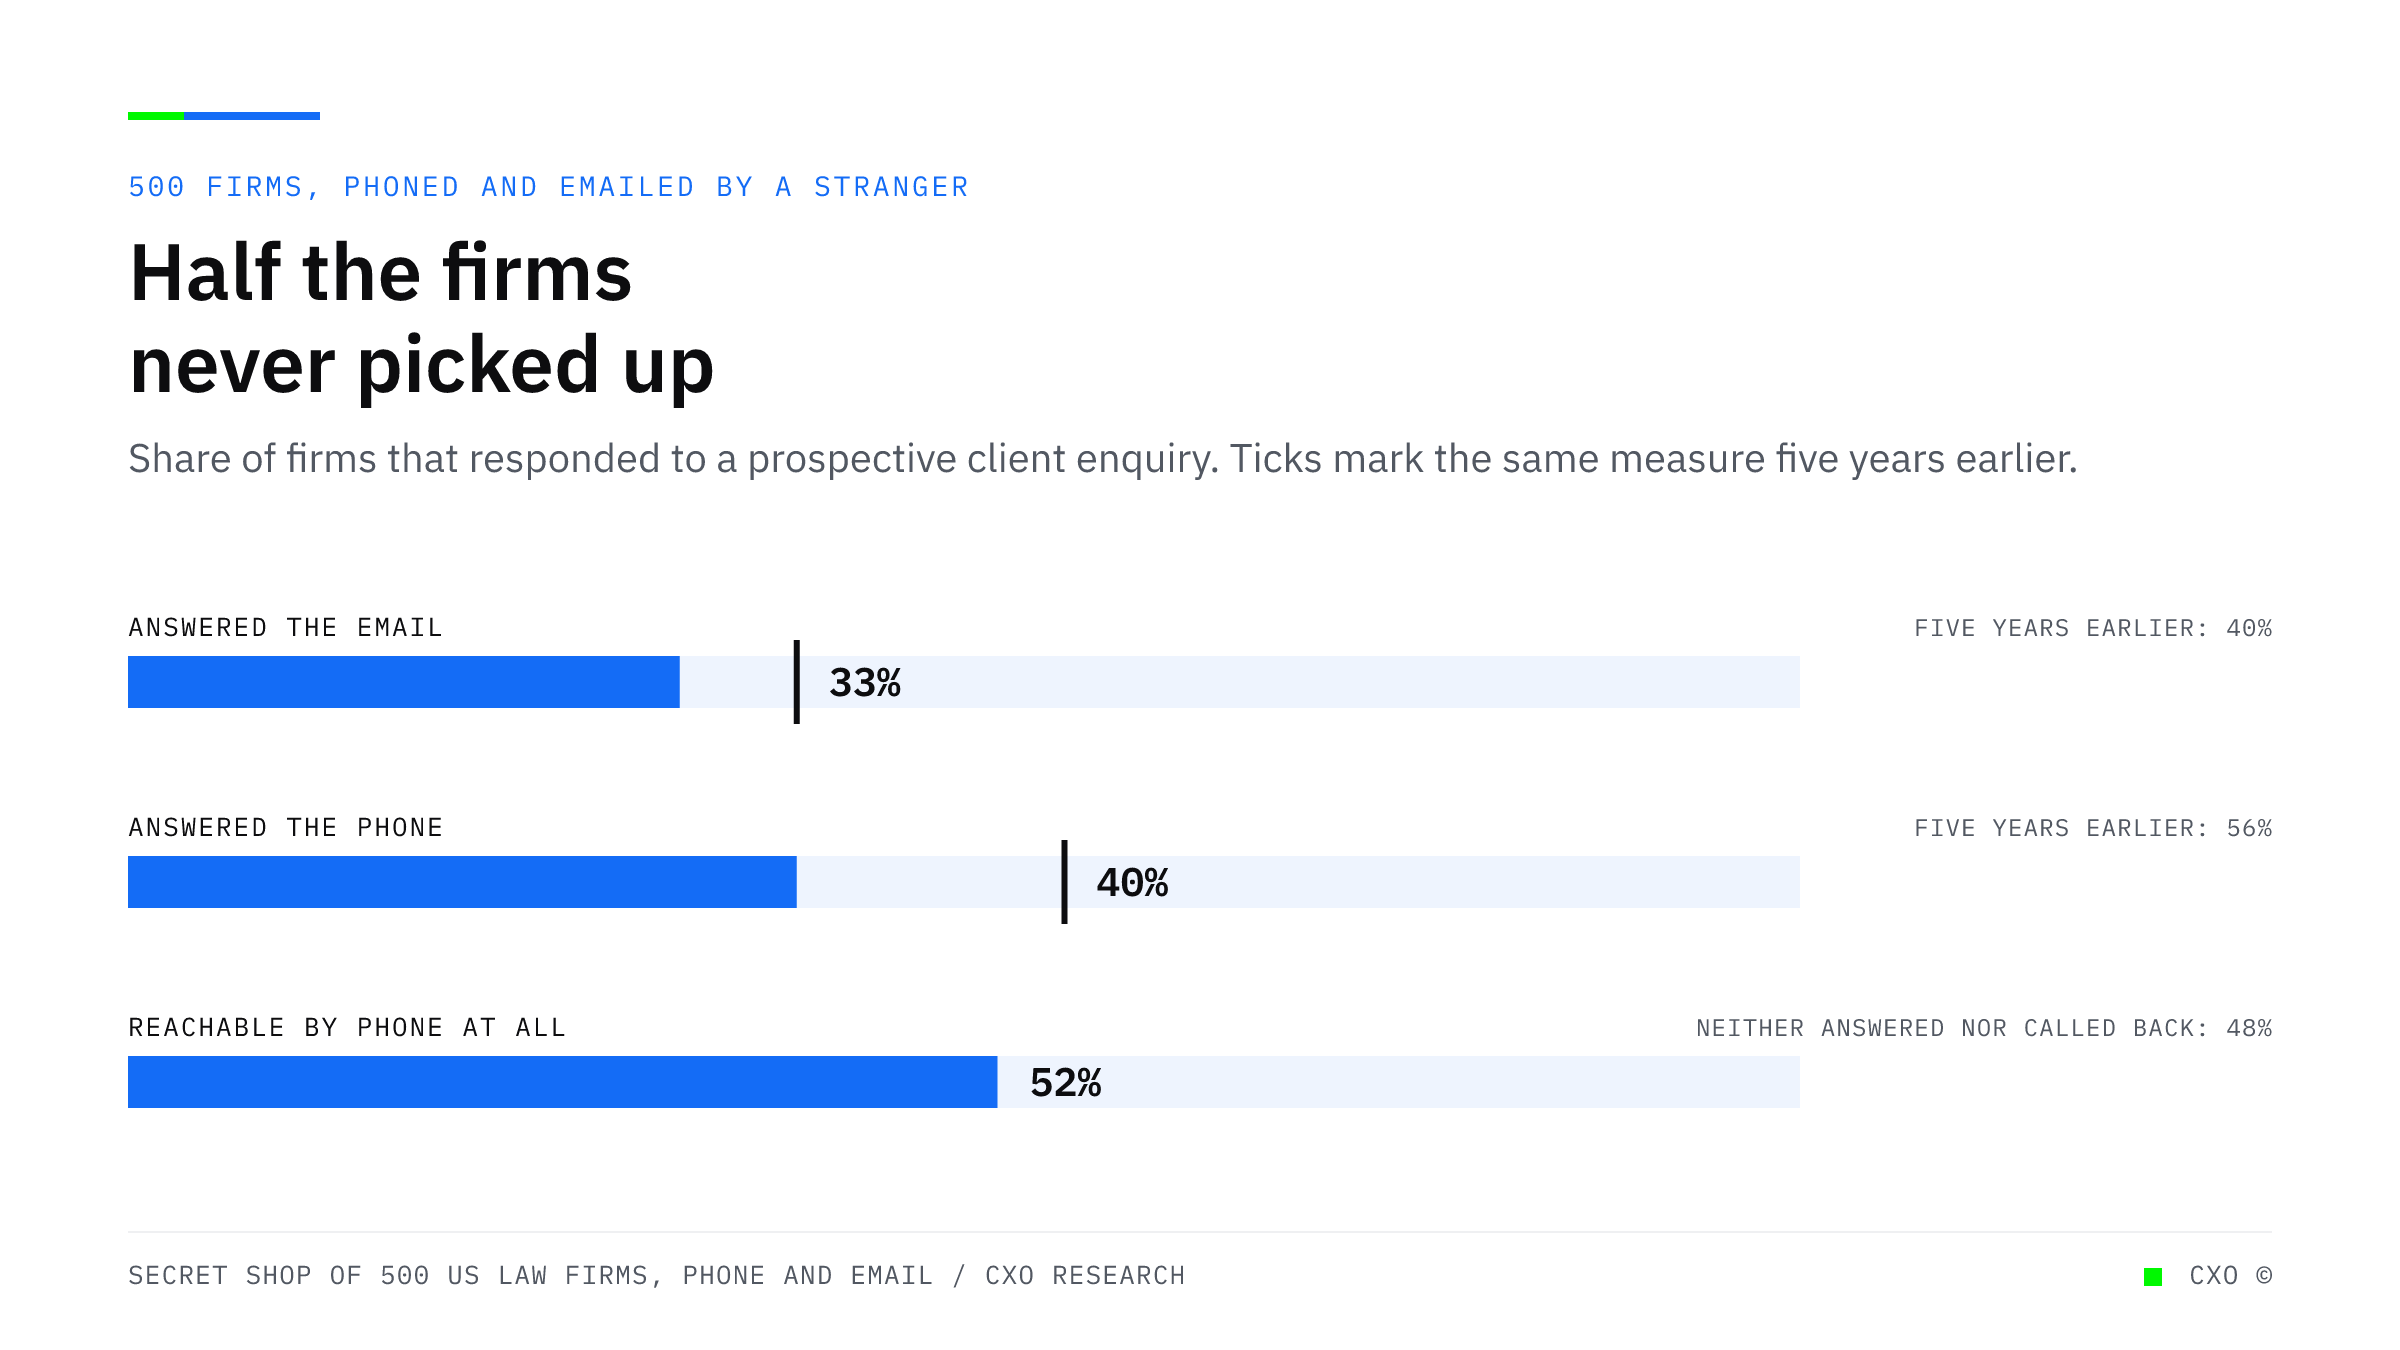
Bullet bars showing that 33 percent of 500 firms answered an emailed inquiry against 40 percent five years earlier, 40 percent answered the phone against 56 percent, and 52 percent were reachable by phone at all.

Someone Secret-Shopped 500 Firms. Half of Them Were Unreachable by Phone.

A third-party researcher phoned and emailed 500 firms posing as a prospective client. The findings are not about capacity or about rudeness. They describe the one part of a firm that nobody owns.
View Insight
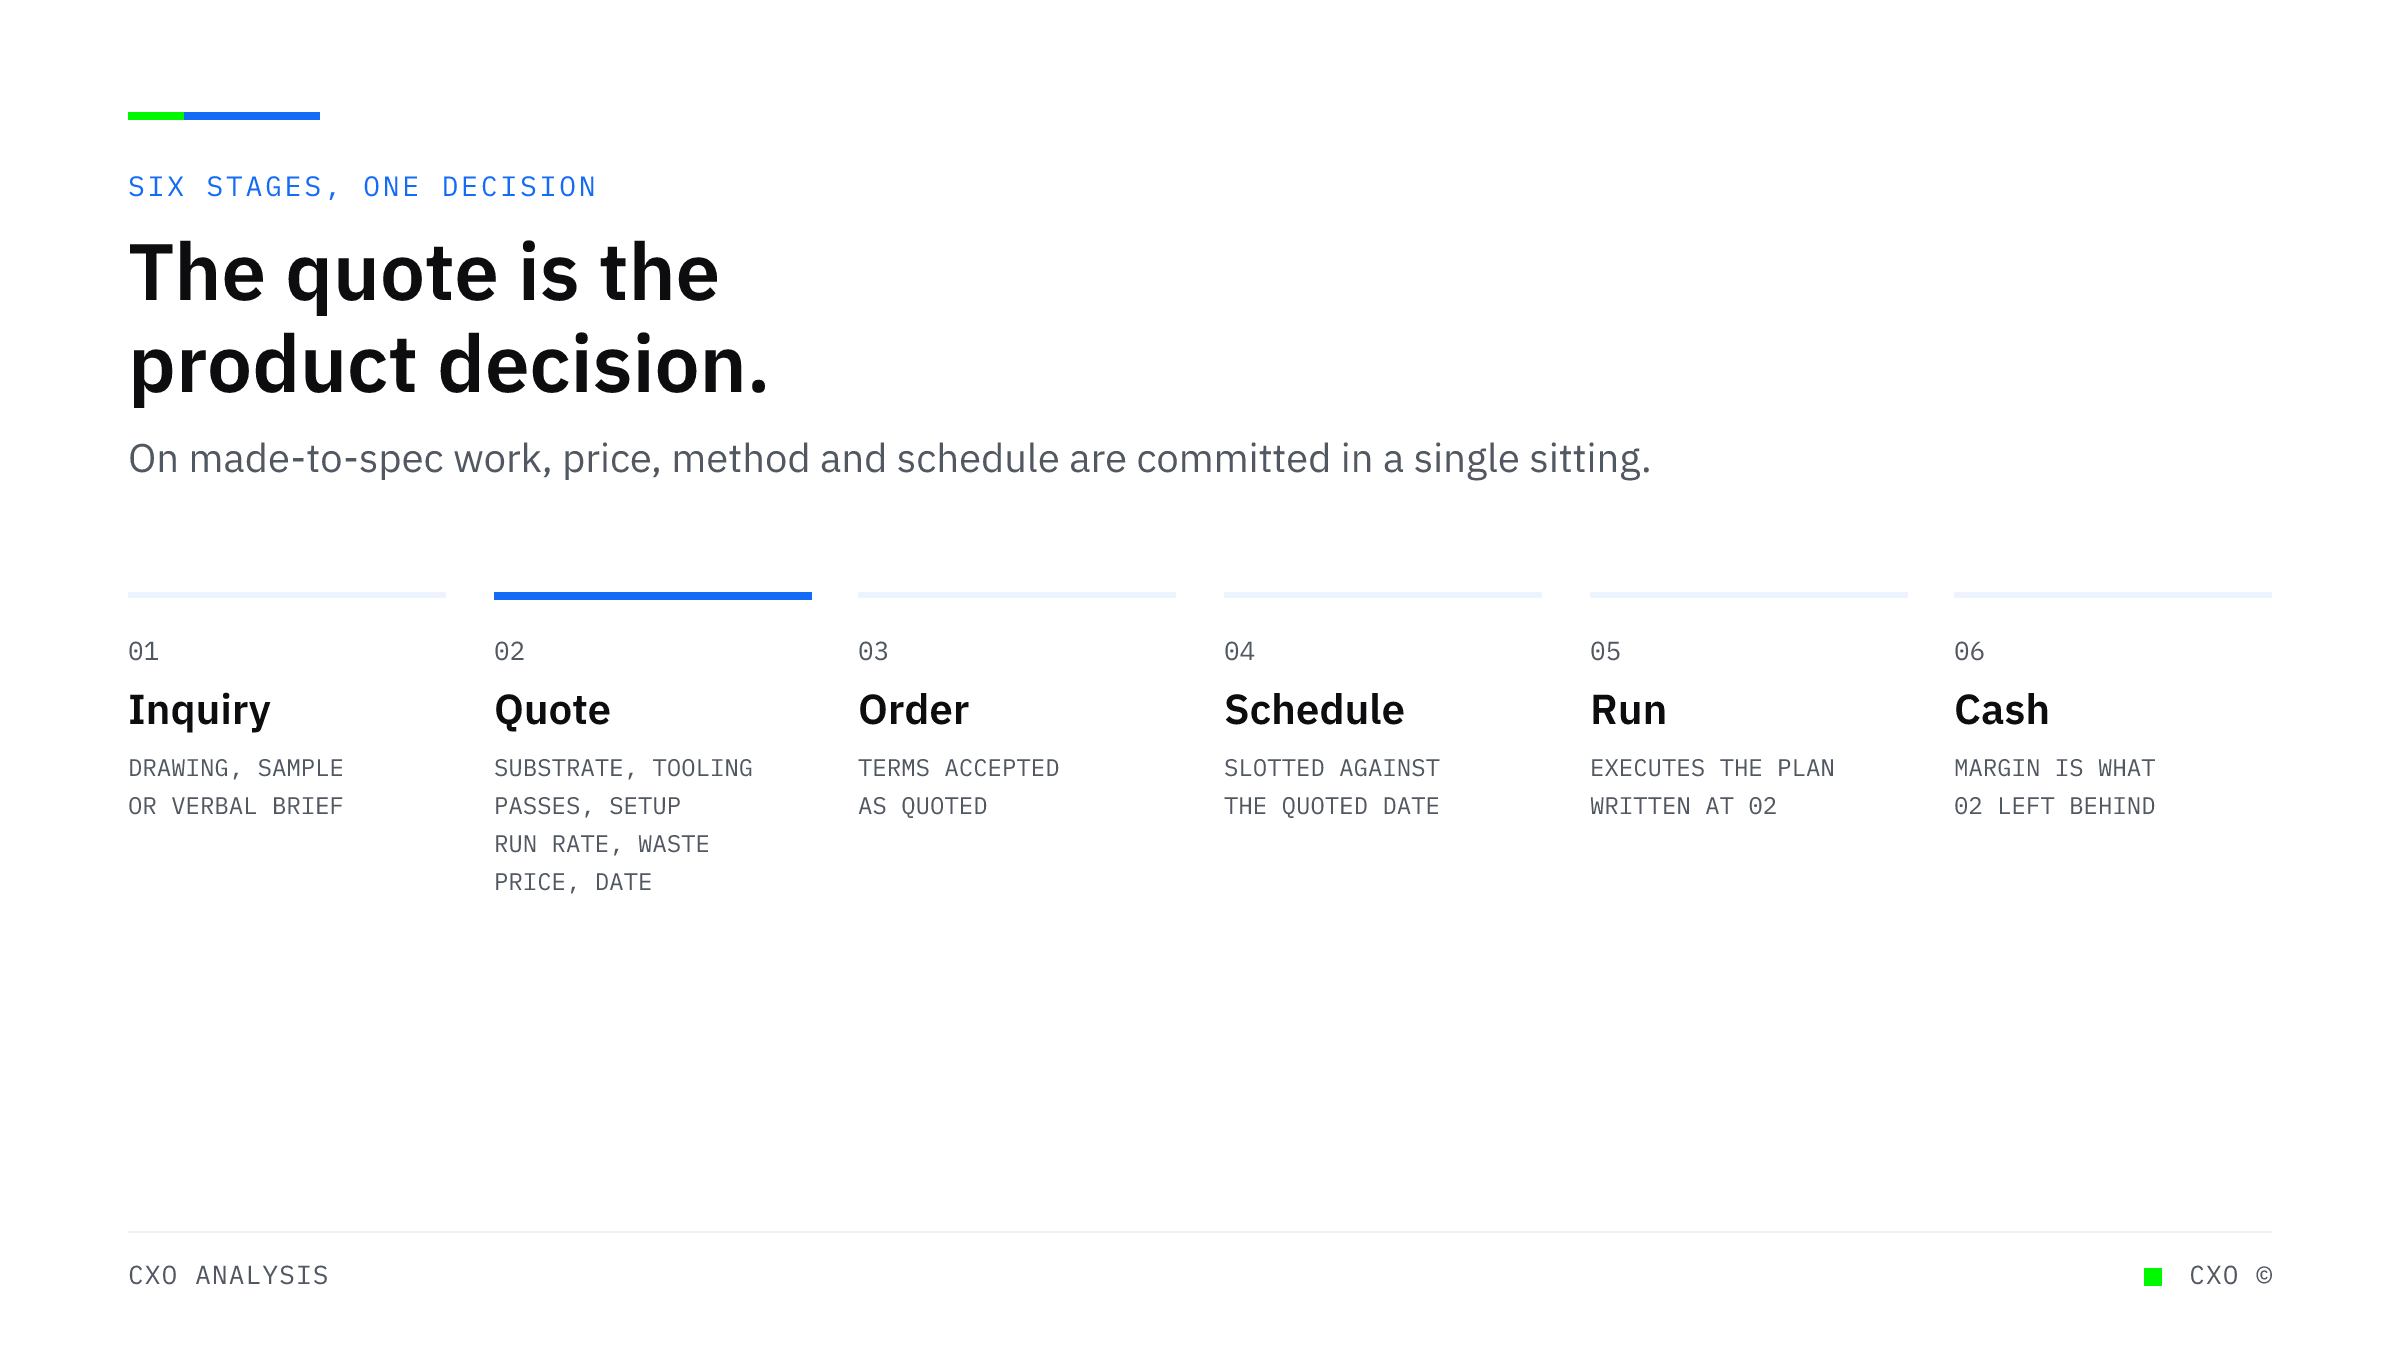
A labeled diagram of six stages from inquiry through cash for made-to-spec production, marking the quote stage as the point where substrate, tooling, run rate, waste allowance, price, and delivery date are all committed at once.

In Made-to-Spec Production, the Quote Is the Only Place the Margin Is Decided

Paper converters hold 51.7 percent of inventory as raw material against 41.5 percent for food manufacturers. That inversion traces back to the front of the process, where the specification, the price, and the schedule are all set at once.
View Insight

Start with the process that costs you most.

A conversation first. A structured assessment when it earns one. Or see what a discovery finds before you book anything.

Book a discovery call See what a discovery finds