Category

Professional Services Ops

24 insights · page 1 of 3

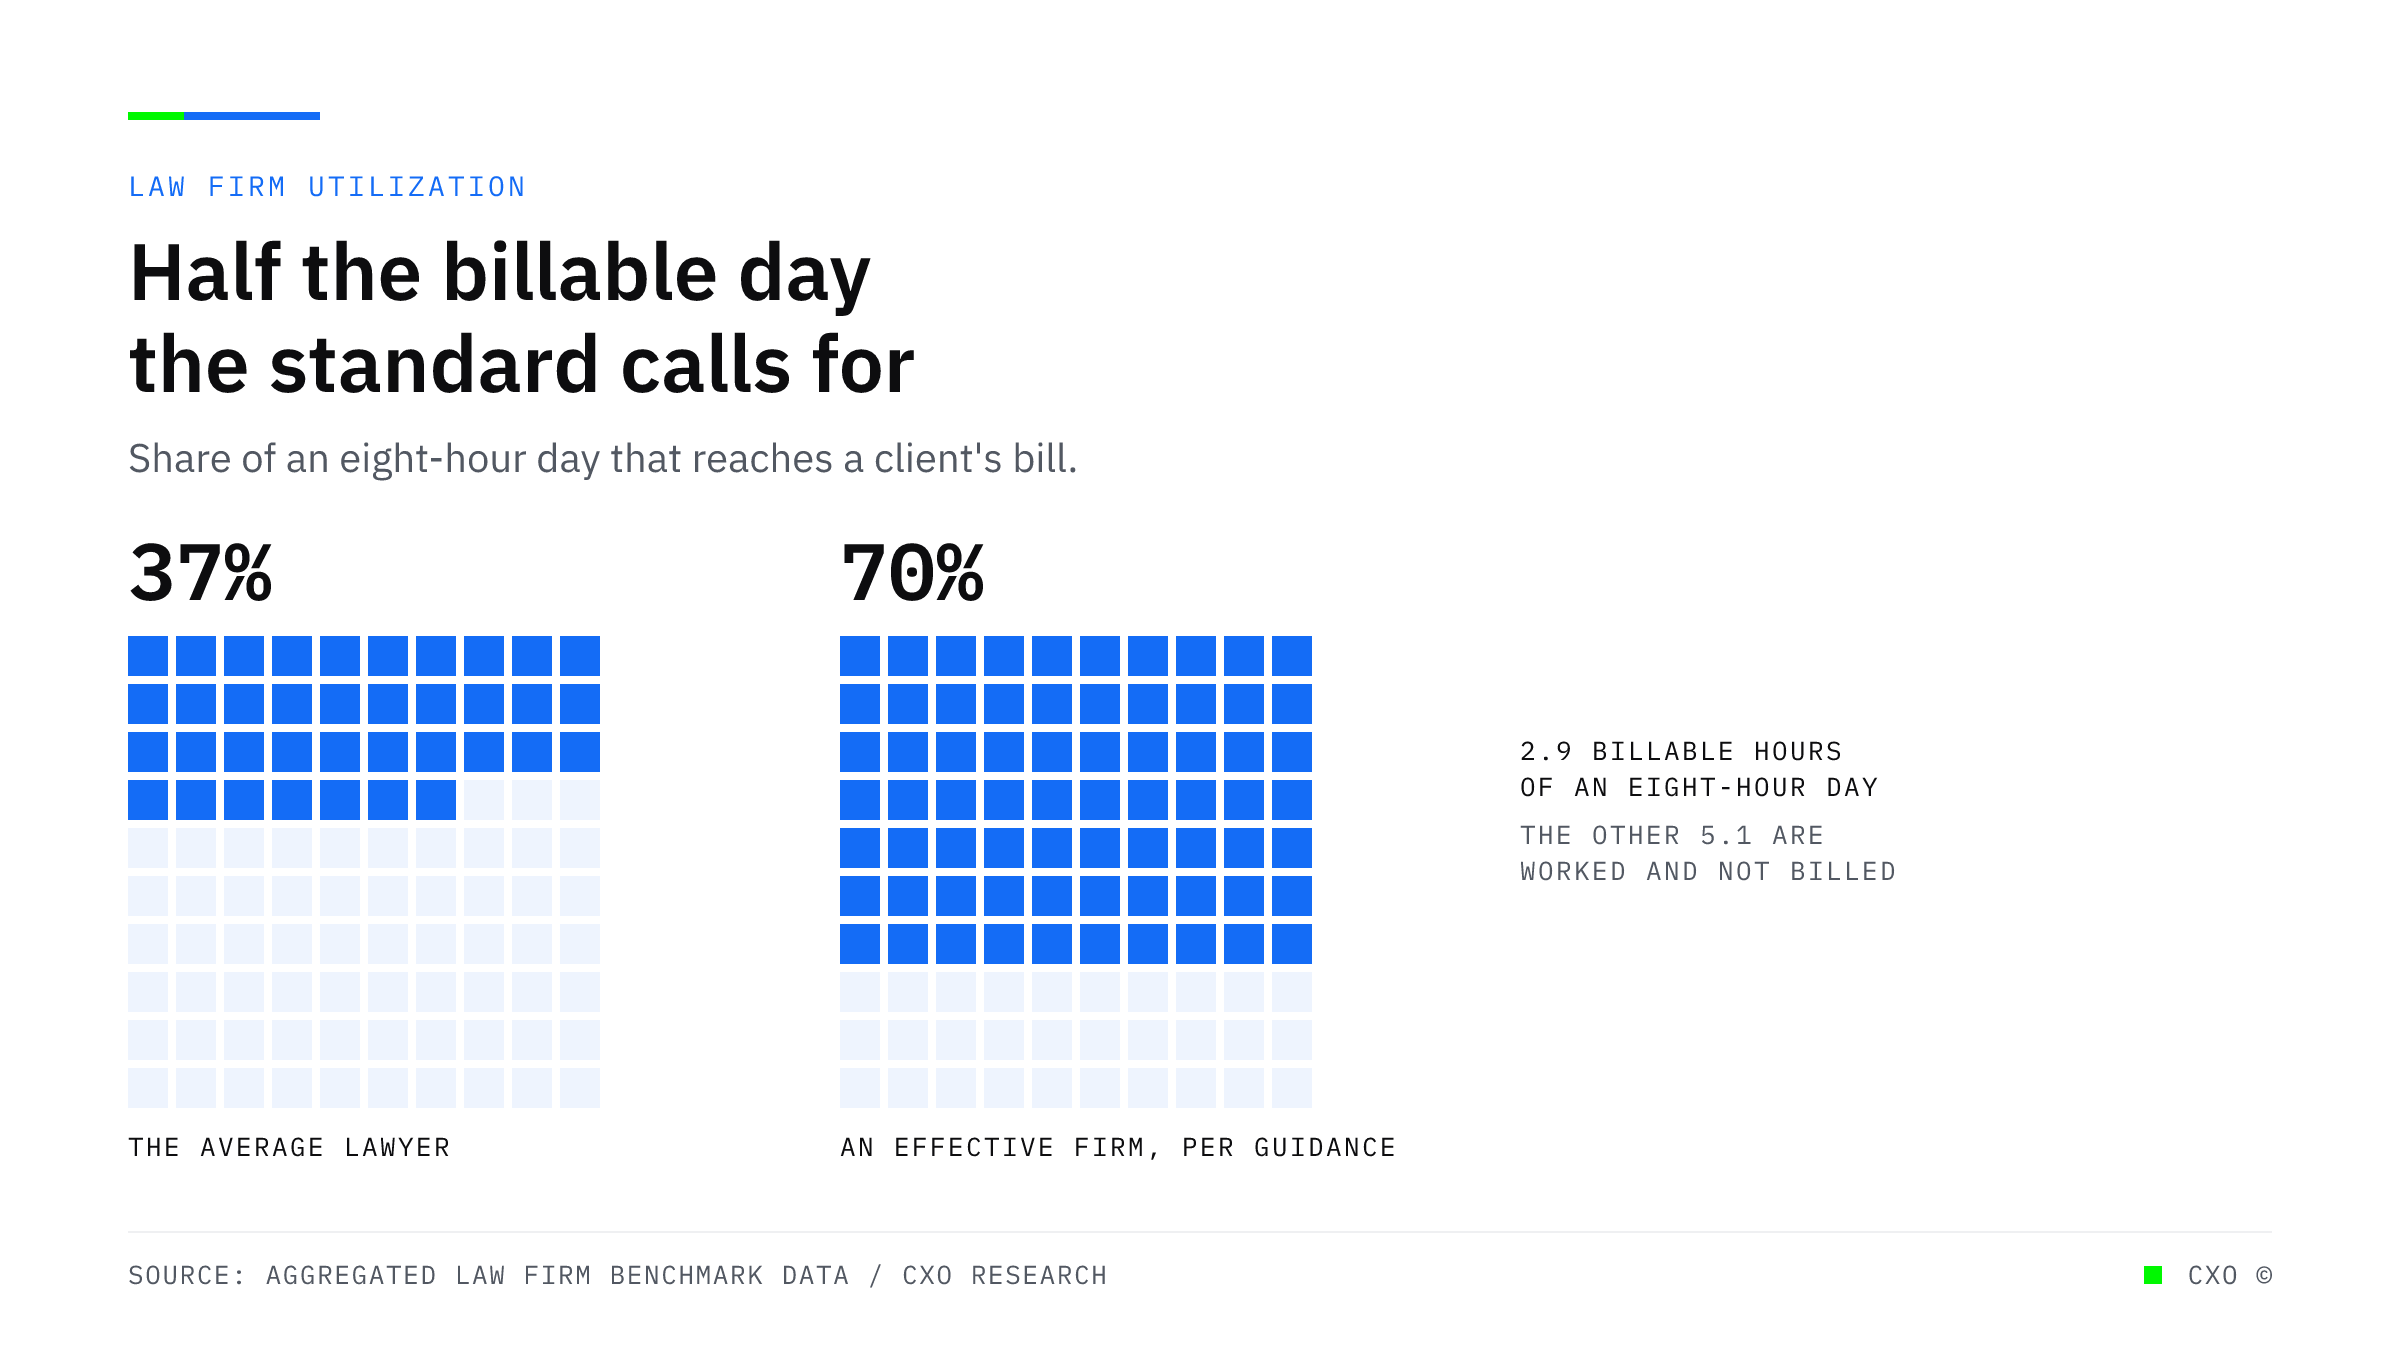
Two grids of 100 squares comparing the average lawyer's utilization rate of 37 percent against the 70 percent minimum the profession's own guidance sets for an effective firm.

The Average Lawyer Bills 2.9 Hours of an Eight-Hour Day

Utilization across law firms averages 37 percent against a 70 percent benchmark for an effective firm. It climbs with headcount, which tells you exactly what the constraint is.
View Insight
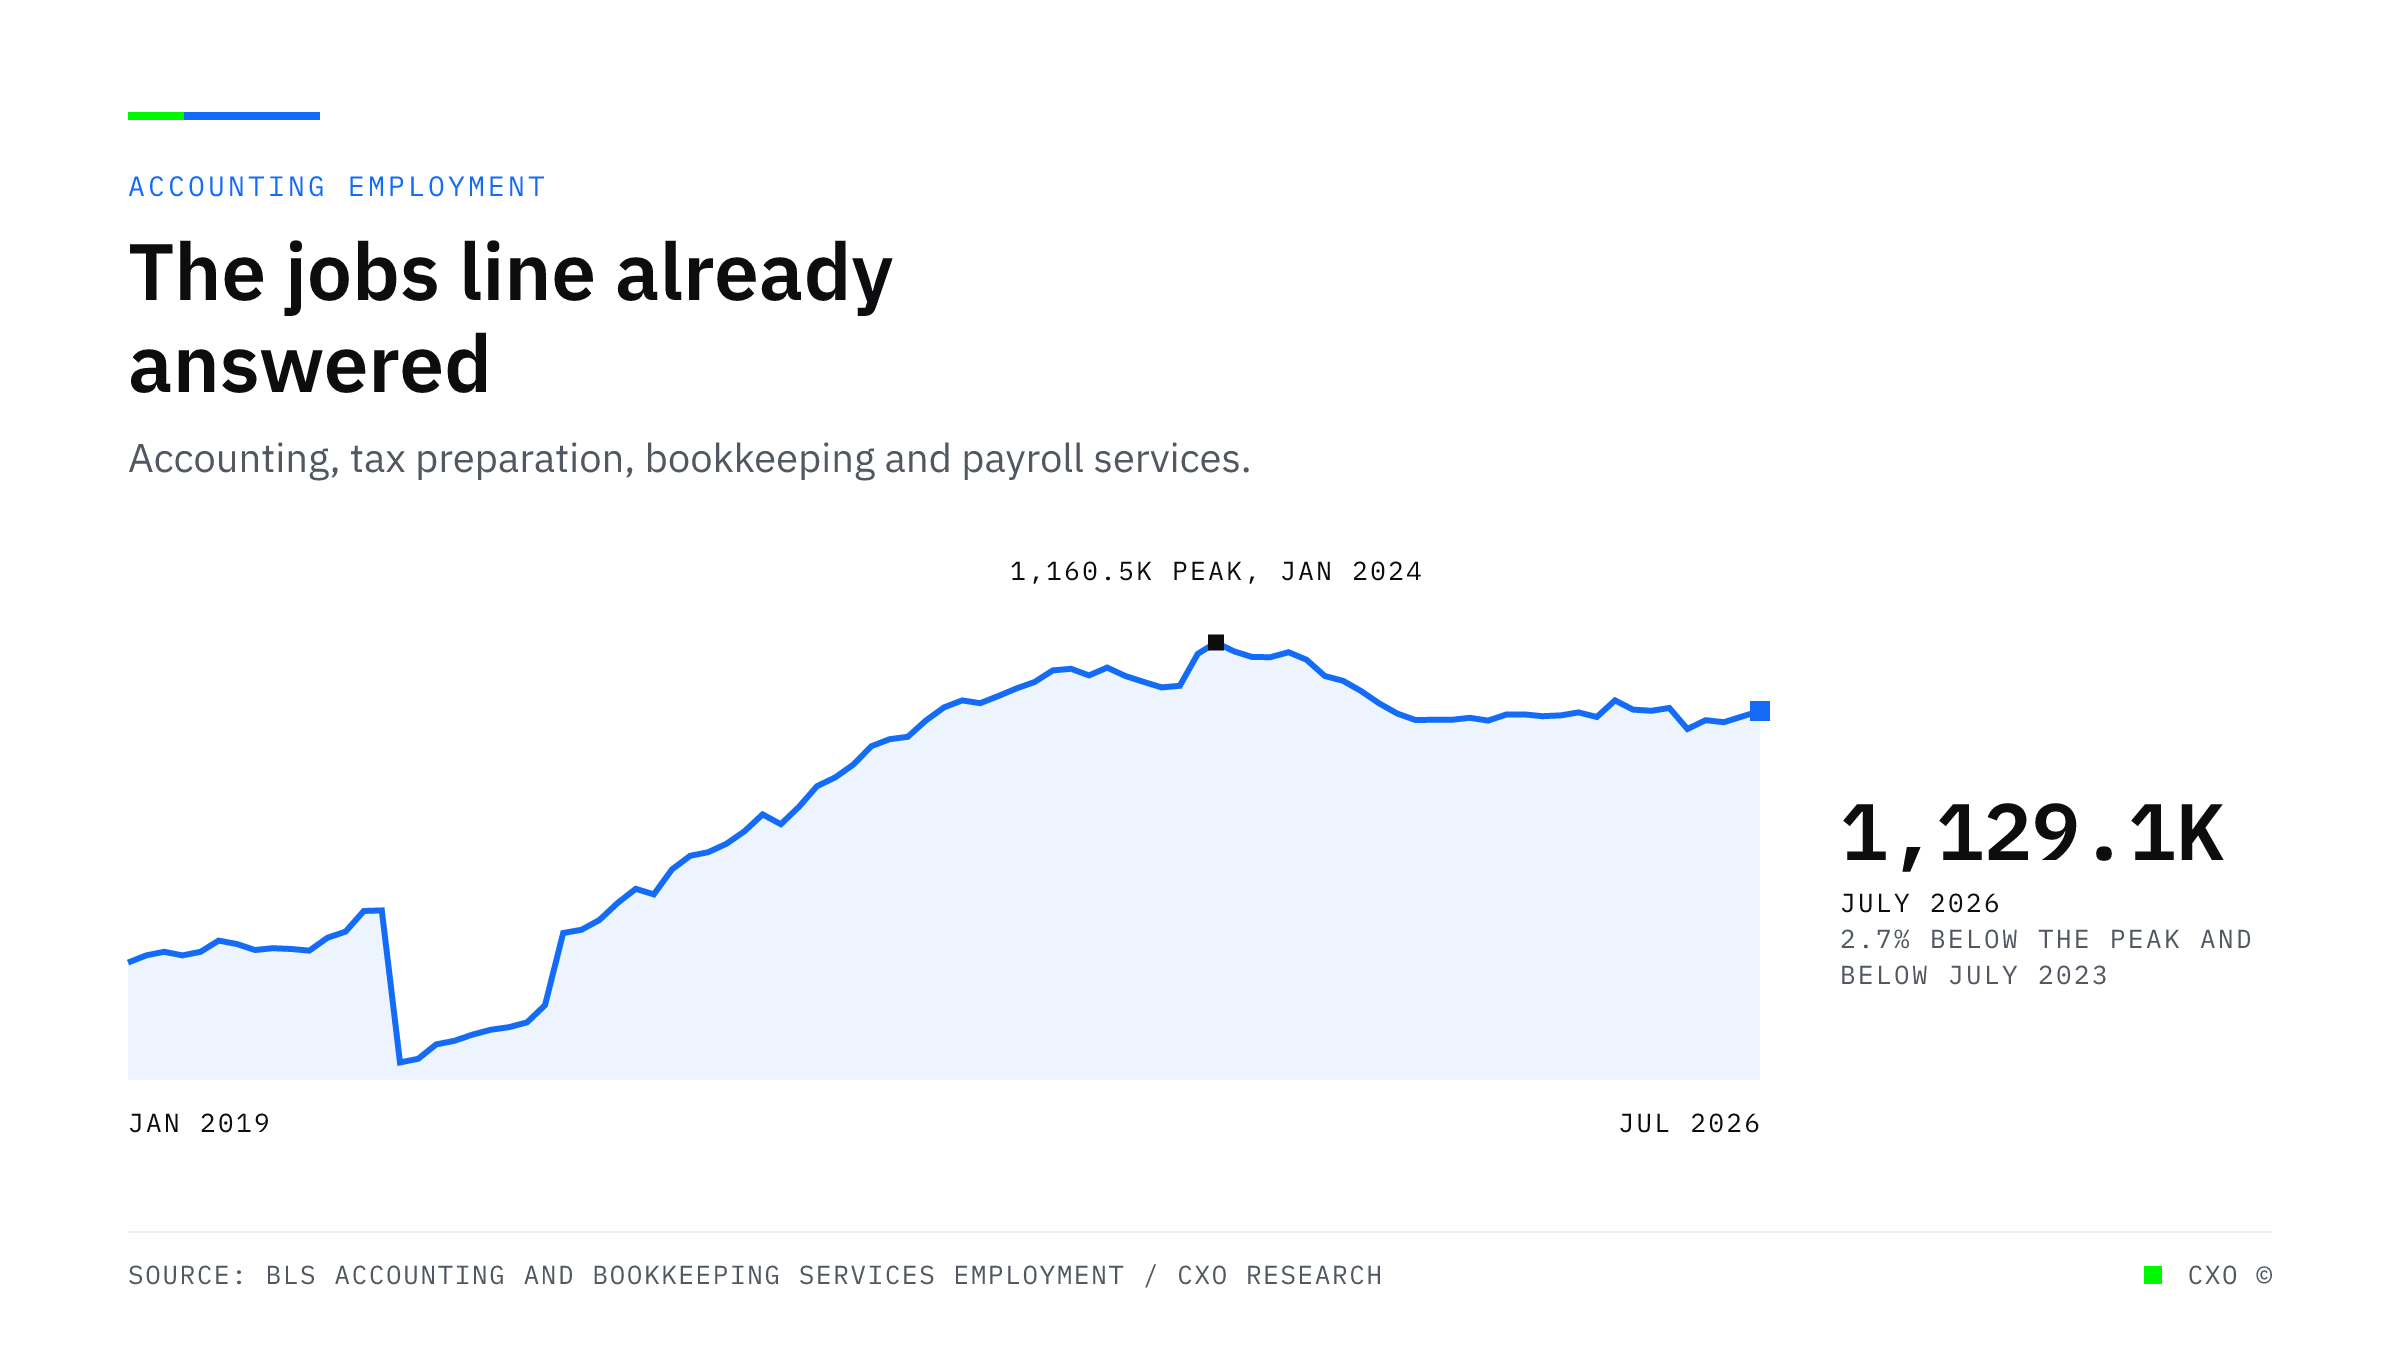
A line chart of monthly employment in accounting, tax preparation, bookkeeping and payroll services, peaking at 1,160,500 in January 2024 and standing at 1,129,100 in July 2026.

The Pipeline Is Refilling at the Front. Your Capacity Problem Is at the Back.

Accounting enrollment rose 8.9 percent to 205,180, a third straight increase. Graduates fell 6.6 percent and new CPA exam candidates dropped from 42,626 to 28,082 over the same stretch.
View Insight
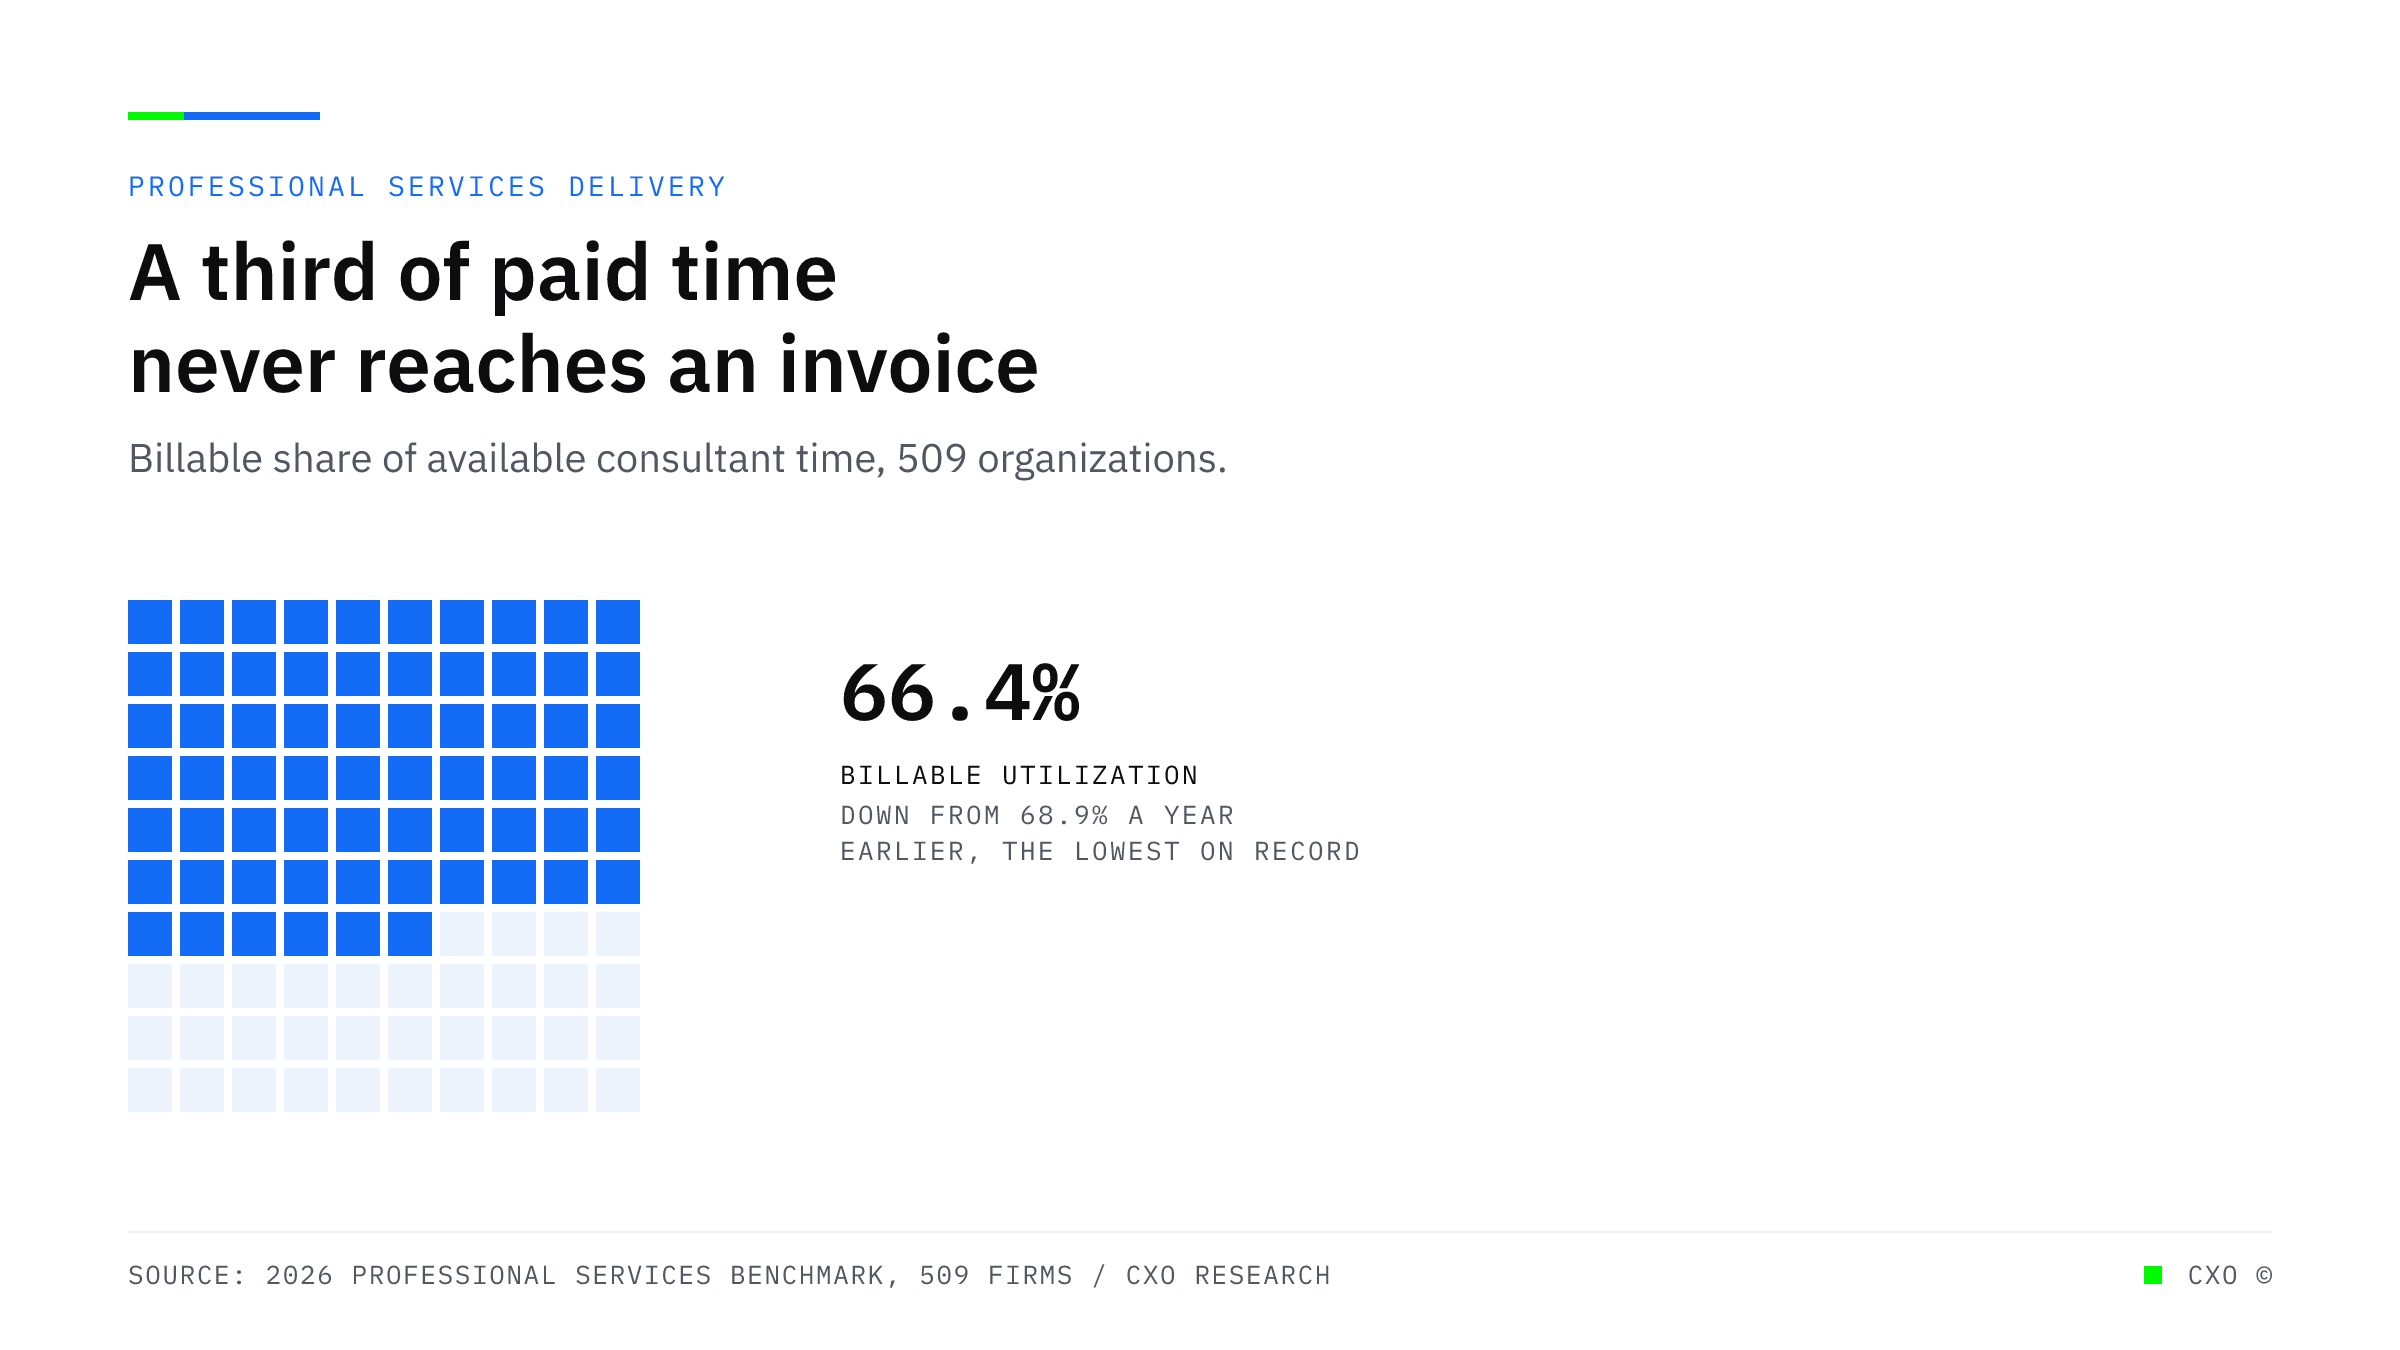
A grid of 100 squares with 66 filled in blue, showing that 66.4 percent of available consultant time is billable across 509 professional services organizations, the lowest level recorded.

Billable Utilization Hit a Record Low in the Same Year AI Use Rose Forty Percent

Across 509 professional services organizations, billable utilization fell to 66.4 percent, the lowest on record, while revenue growth improved and generative AI reached 27.1 percent of projects.
View Insight
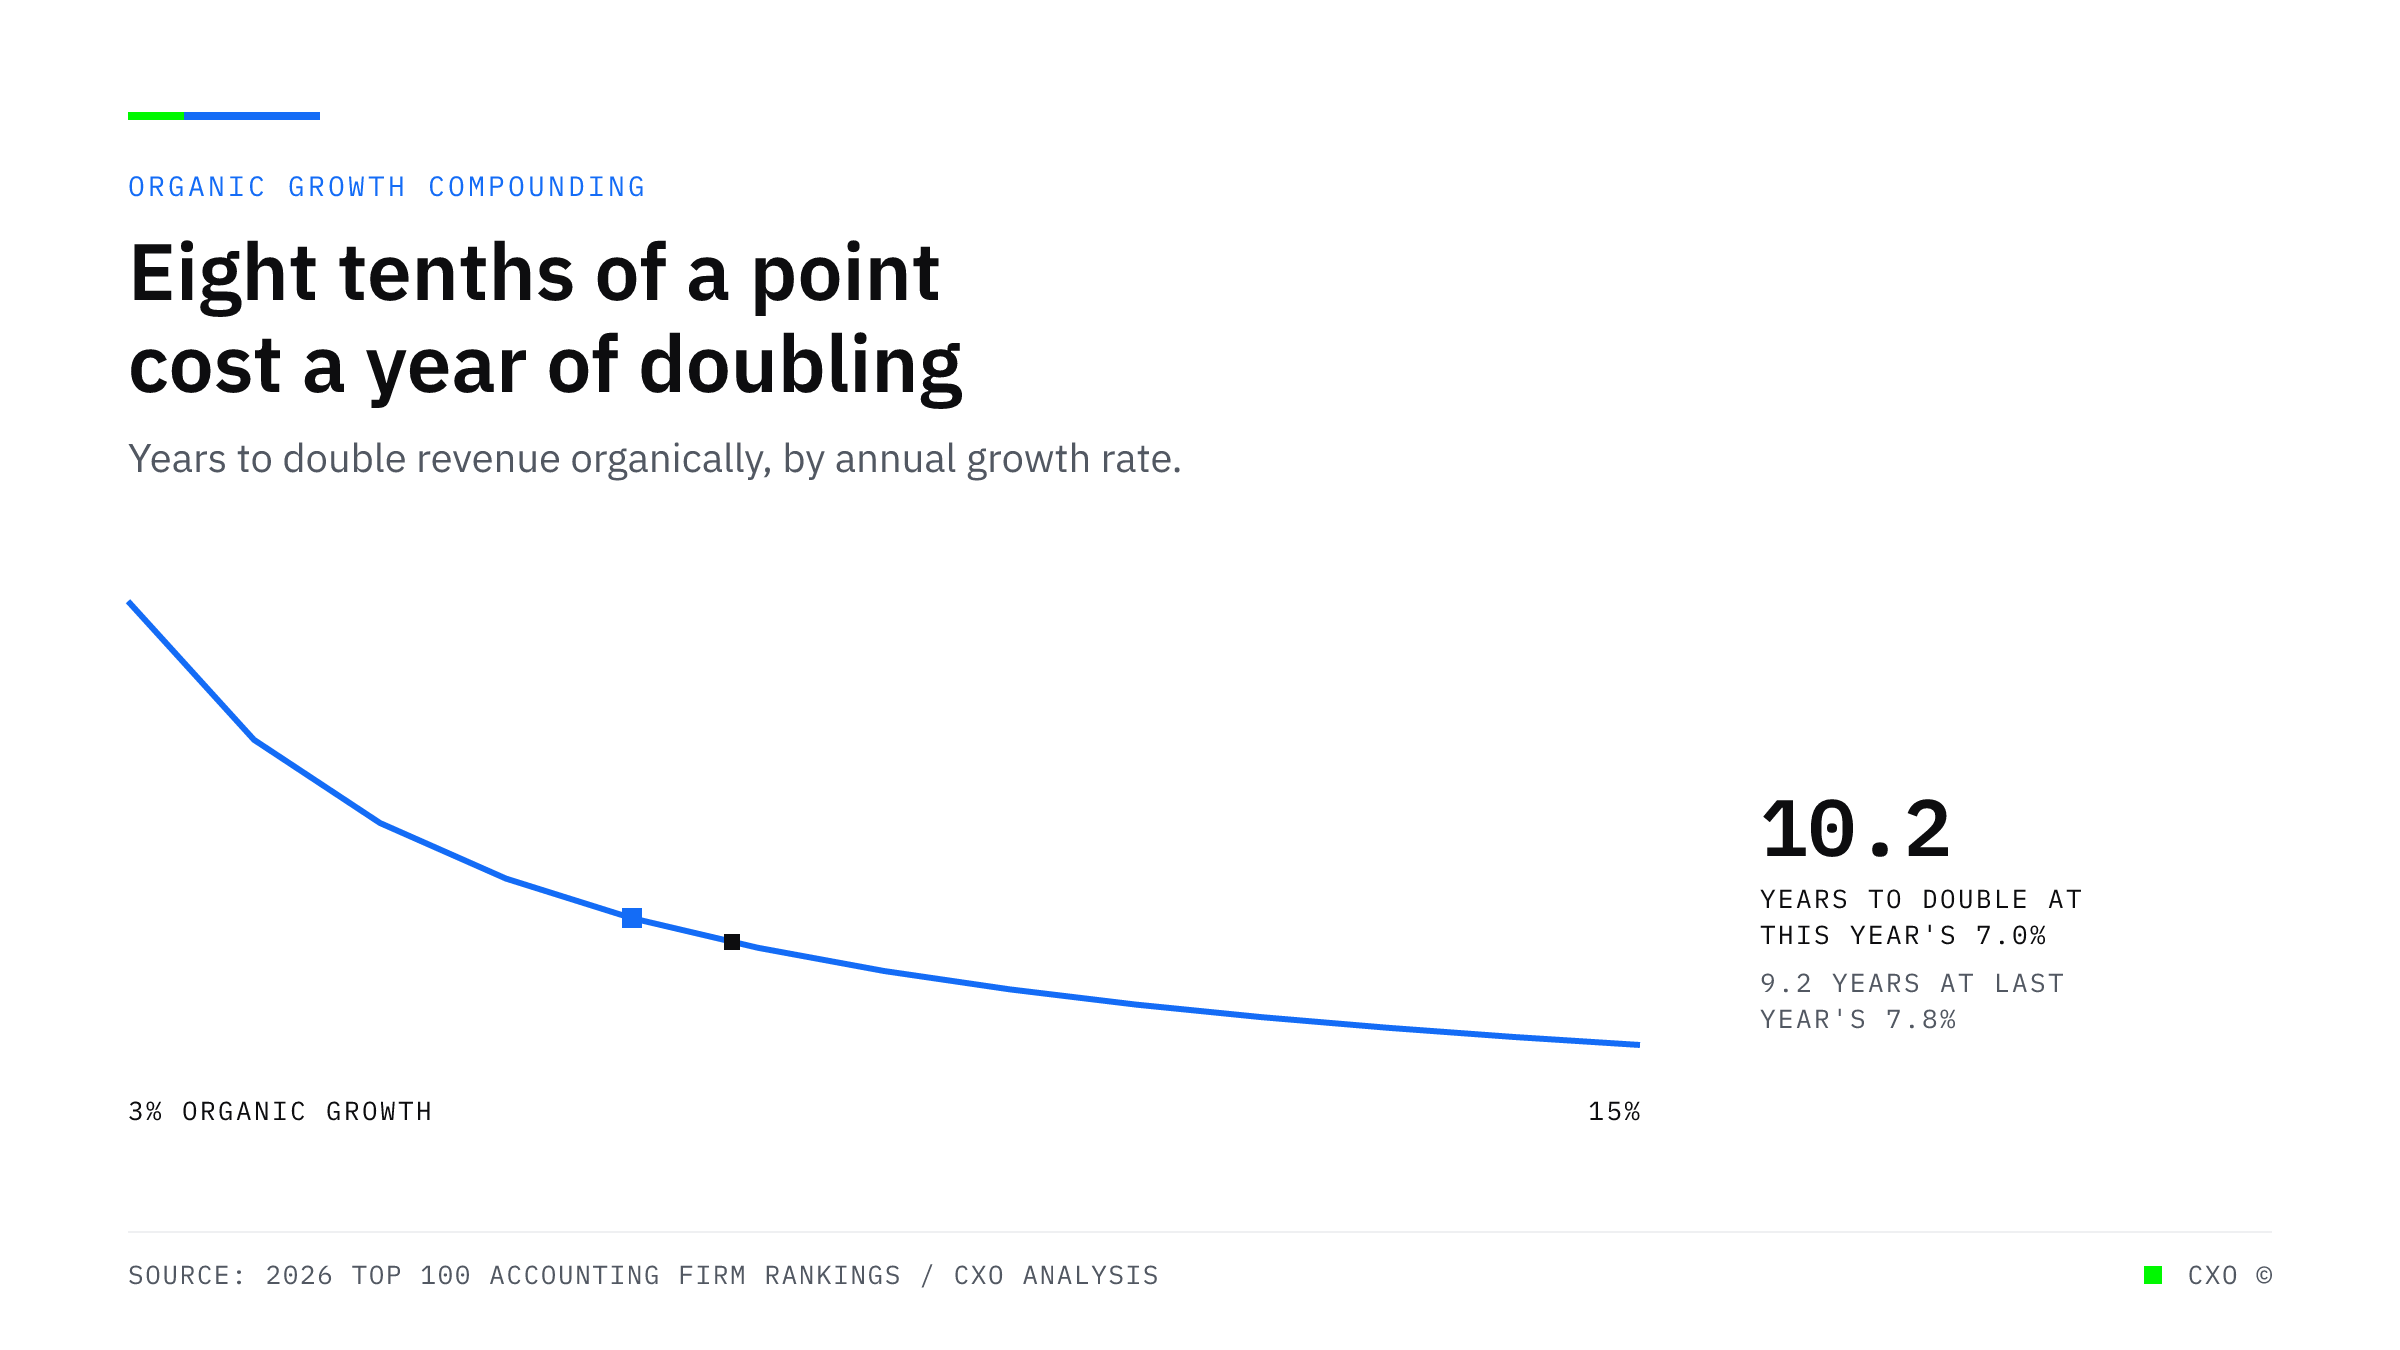
A rising curve showing how long it takes to double revenue at a given organic growth rate, marked at 7.0 percent where doubling takes 10.2 years, against 9.2 years at last year's 7.8 percent.

Top-100 Growth Rose to 12.8 Percent While Organic Growth Fell to 7

Total revenue growth at the top 100 accounting firms rose from 10.4 to 12.8 percent. Organic growth fell from 7.8 to 7.0. The entire acceleration was bought, and the benchmark moved with it.
View Insight
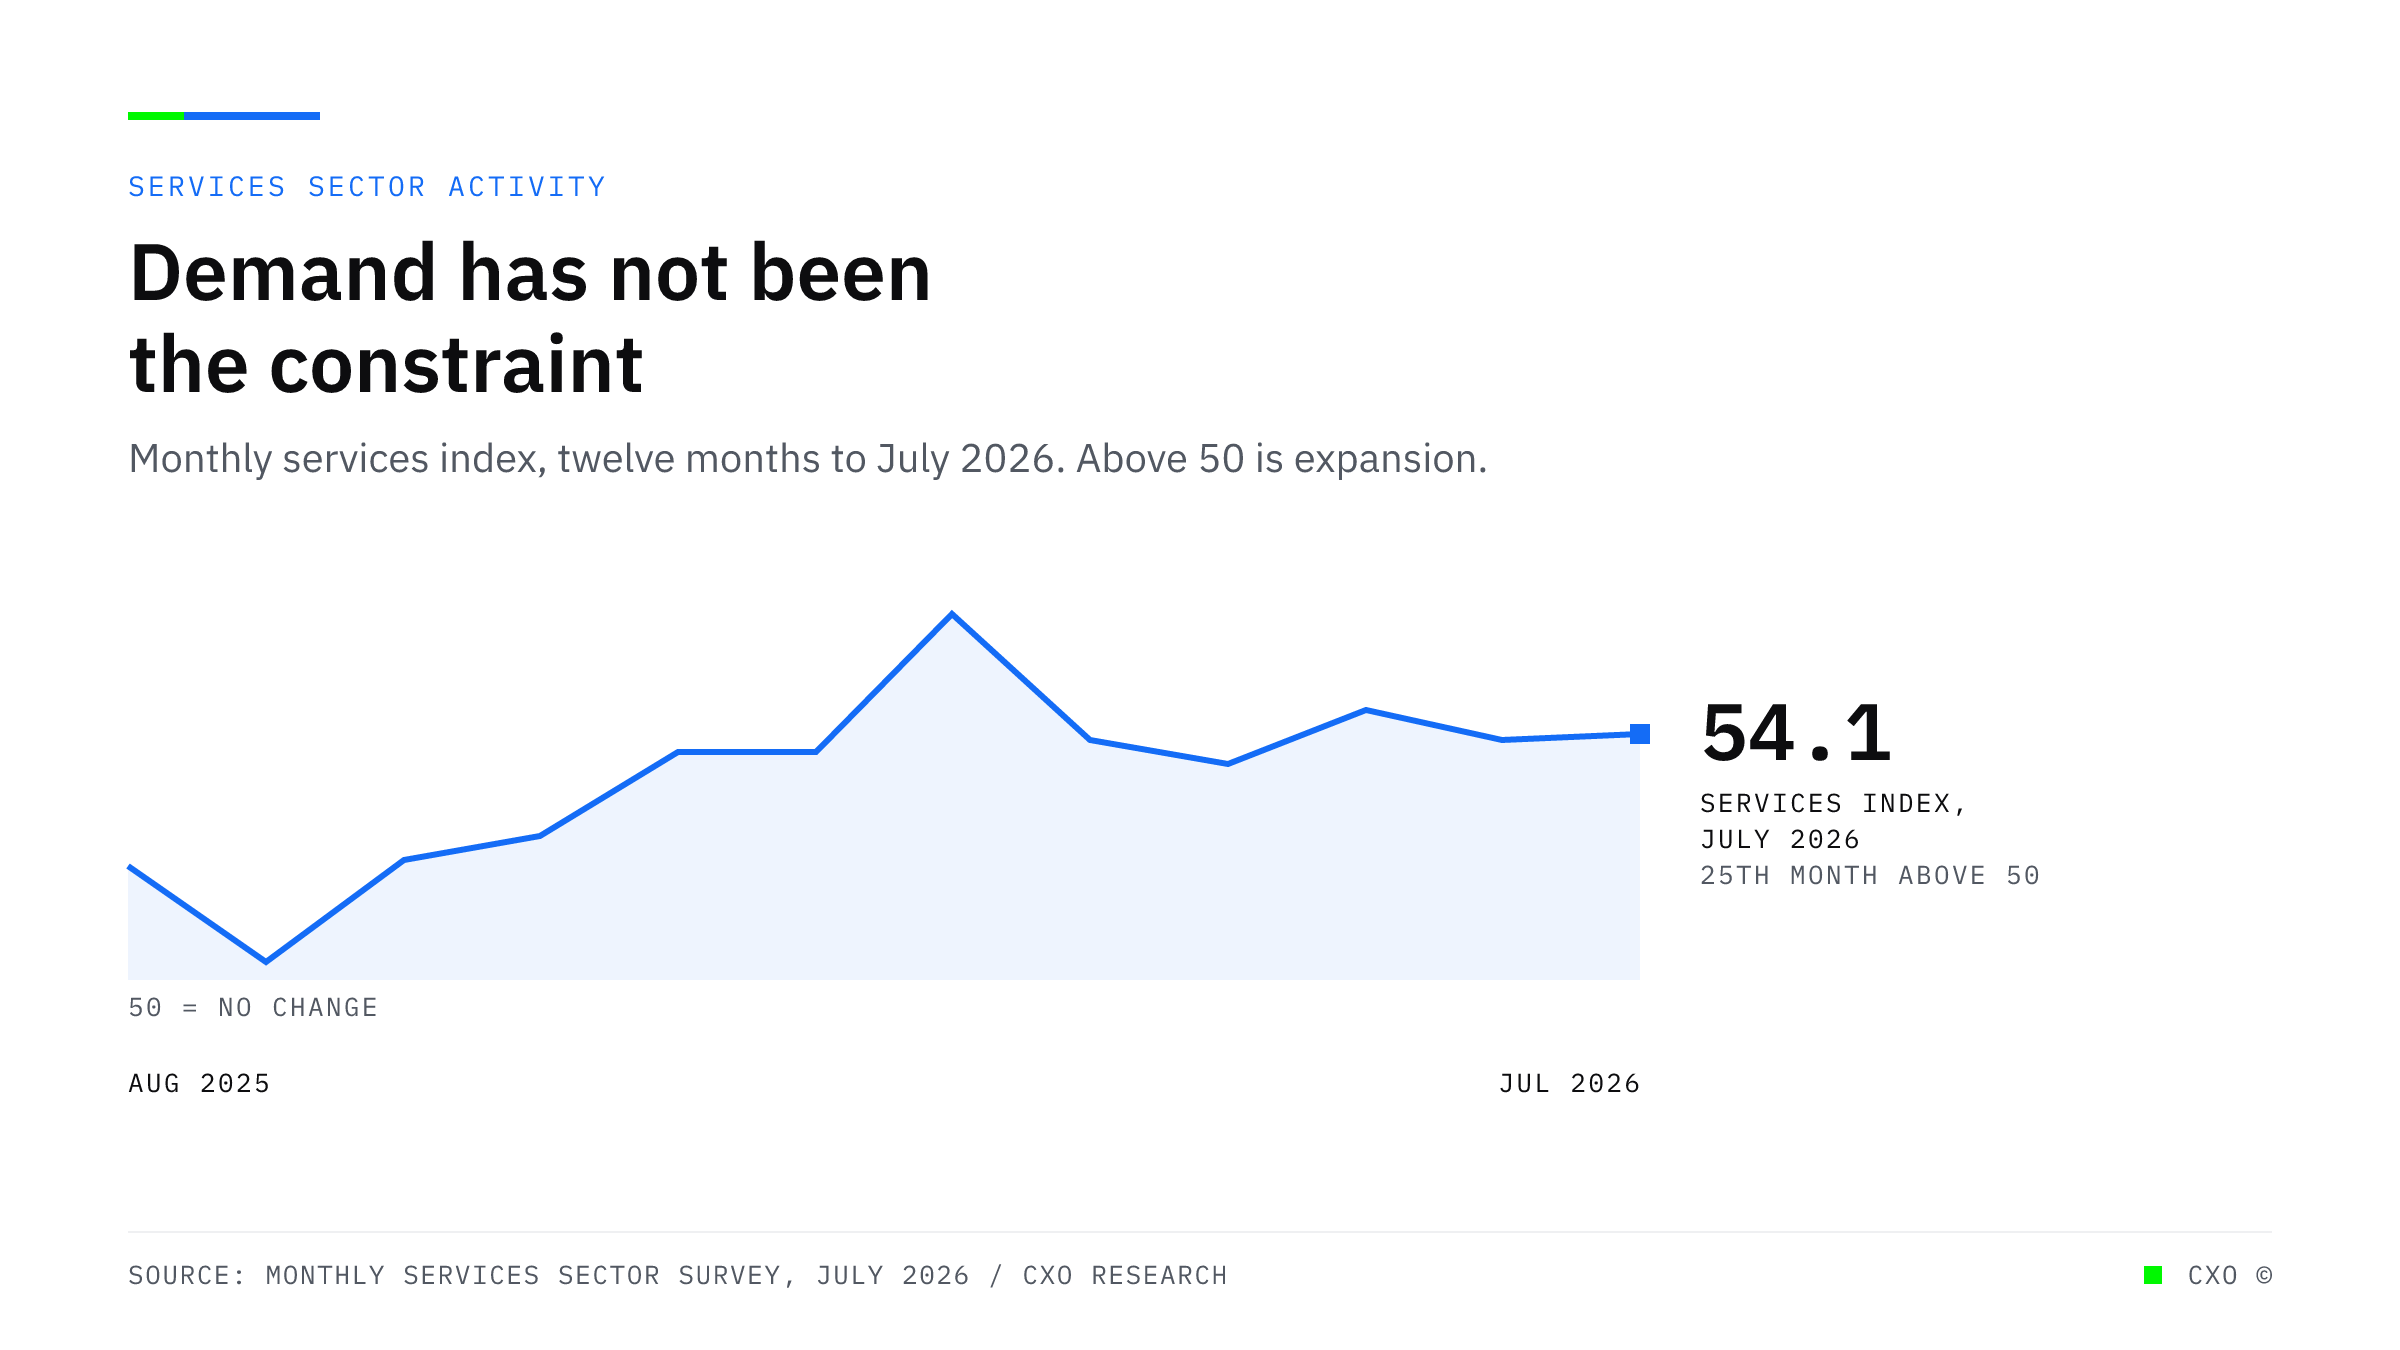
A line chart of the monthly services index across the twelve months to July 2026, holding above the 50 no-change line throughout and reading 54.1 in July, the twenty-fifth consecutive month of expansion.

Demand Has Not Been the Constraint for Twenty-Five Months. Delivery Capacity Has.

Services business activity jumped to 59.1 in July while the services employment index fell to 47.4. Demand keeps expanding and the payroll that delivers it keeps contracting.
View Insight
A rising curve showing that the number of system pairs that can disagree grows faster than the number of applications a firm runs, with the average firm's ten applications marked at 45 pairs.

The Top Barrier to Advisory Work Is Data Cleanup. That Is an Integration Problem.

Thirty percent of accounting professionals name manual data cleanup as the top barrier to advisory work, ahead of staffing. The average firm runs ten applications and loses five hours a week to re-entry.
View Insight
Stepped area chart showing professional services AI adoption at 56% of firms stepping down to 24% at firm-wide deployment, illustrating the redesign gap.

The Firms Getting the Most From AI Rebuilt the Workflow, Then Automated It

Professional services leads on AI adoption, but only about a quarter deploy firm-wide. The difference is workflow redesign, not tools. What the leading quartile did differently.
View Insight
CXO editorial cover charting alternative fee arrangements as a share of firm revenue, rising from about 20% in 2023 toward a projected 70% or more, illustrating that rate strategy has stopped being a profit lever and margin now depends on the cost of delivery.

Rate Strategy Stopped Being a Lever. Your Advantage Moved to the Cost of Delivery.

2026 rate data shows firms collect the same effective rate whether they discount hard or hold firm. Pricing power is neutral. The margin lever that still moves is the cost of delivery.
View Insight

Ready to put agentic AI to work?

See where automation can take the manual, repetitive work off your team. Book a discovery call and we'll map the highest-impact processes in your operation.

Book a discovery call