Tag

specialized packaging

3 insights

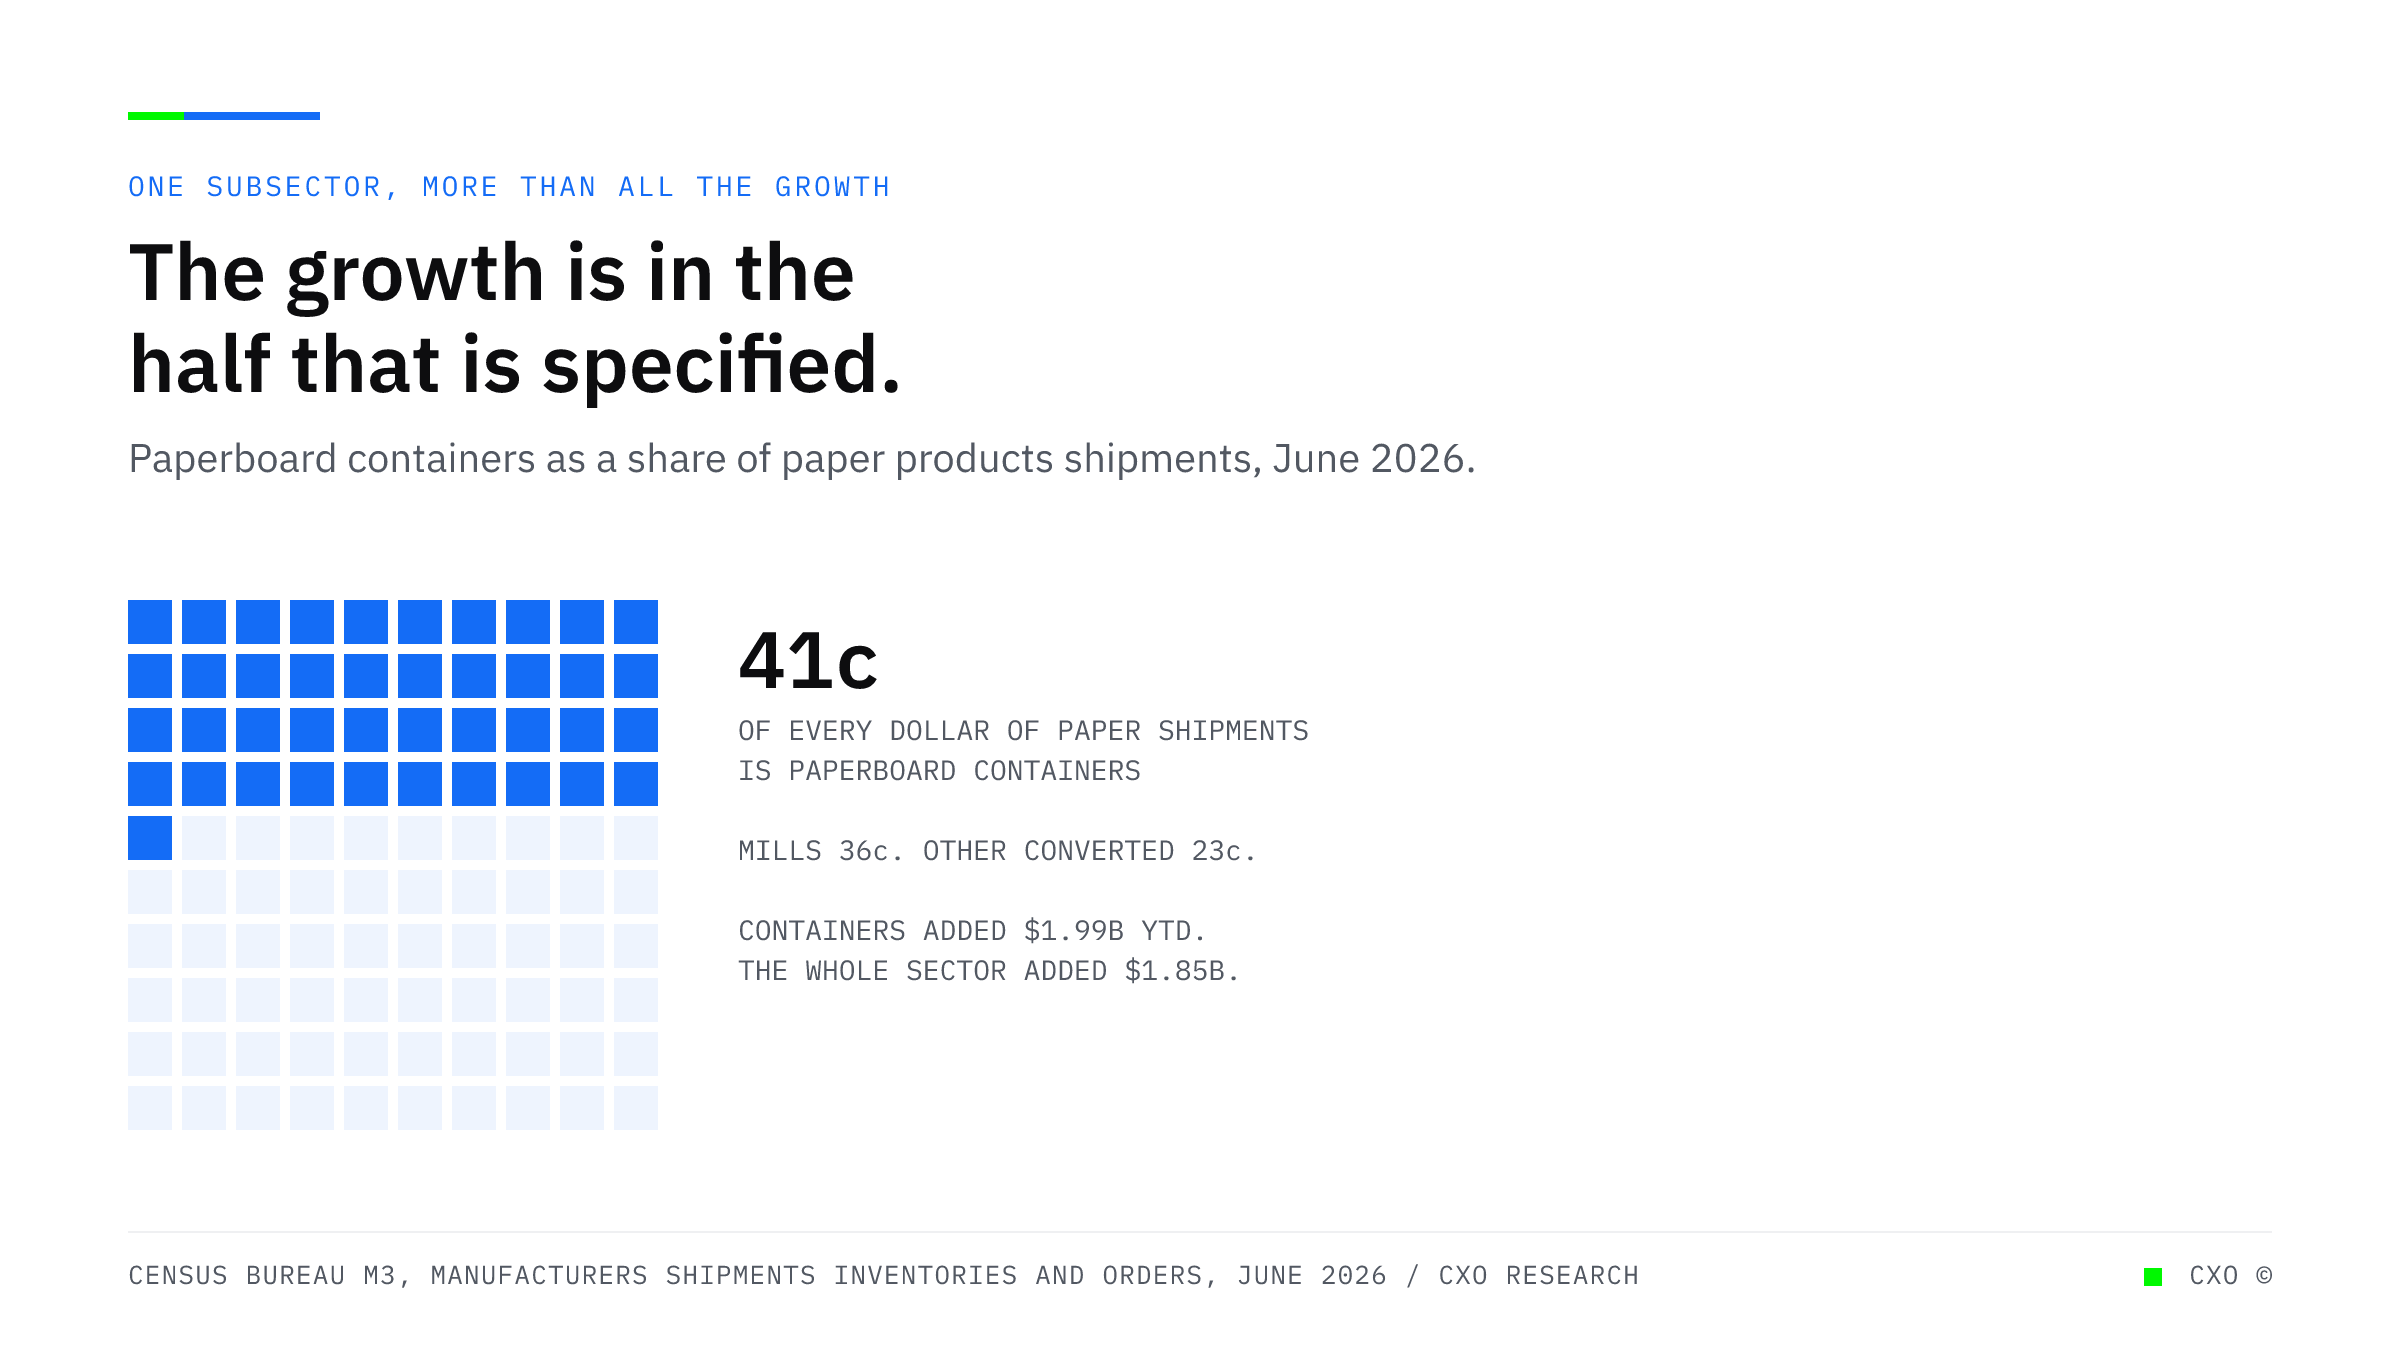
A waffle grid of 100 squares with 41 marked, showing that paperboard containers account for 41 cents of every dollar of paper products shipments, while pulp and paper mills account for 36 cents and other converted products the remainder.

All of the Growth in Paper Is in the Half That Has to Be Specified First

Paperboard containers added $1.99 billion of year-to-date shipments while the whole paper products sector added $1.85 billion. One subsector accounts for more than all the growth, and it is the one where every dollar arrives with a specification.
View Insight
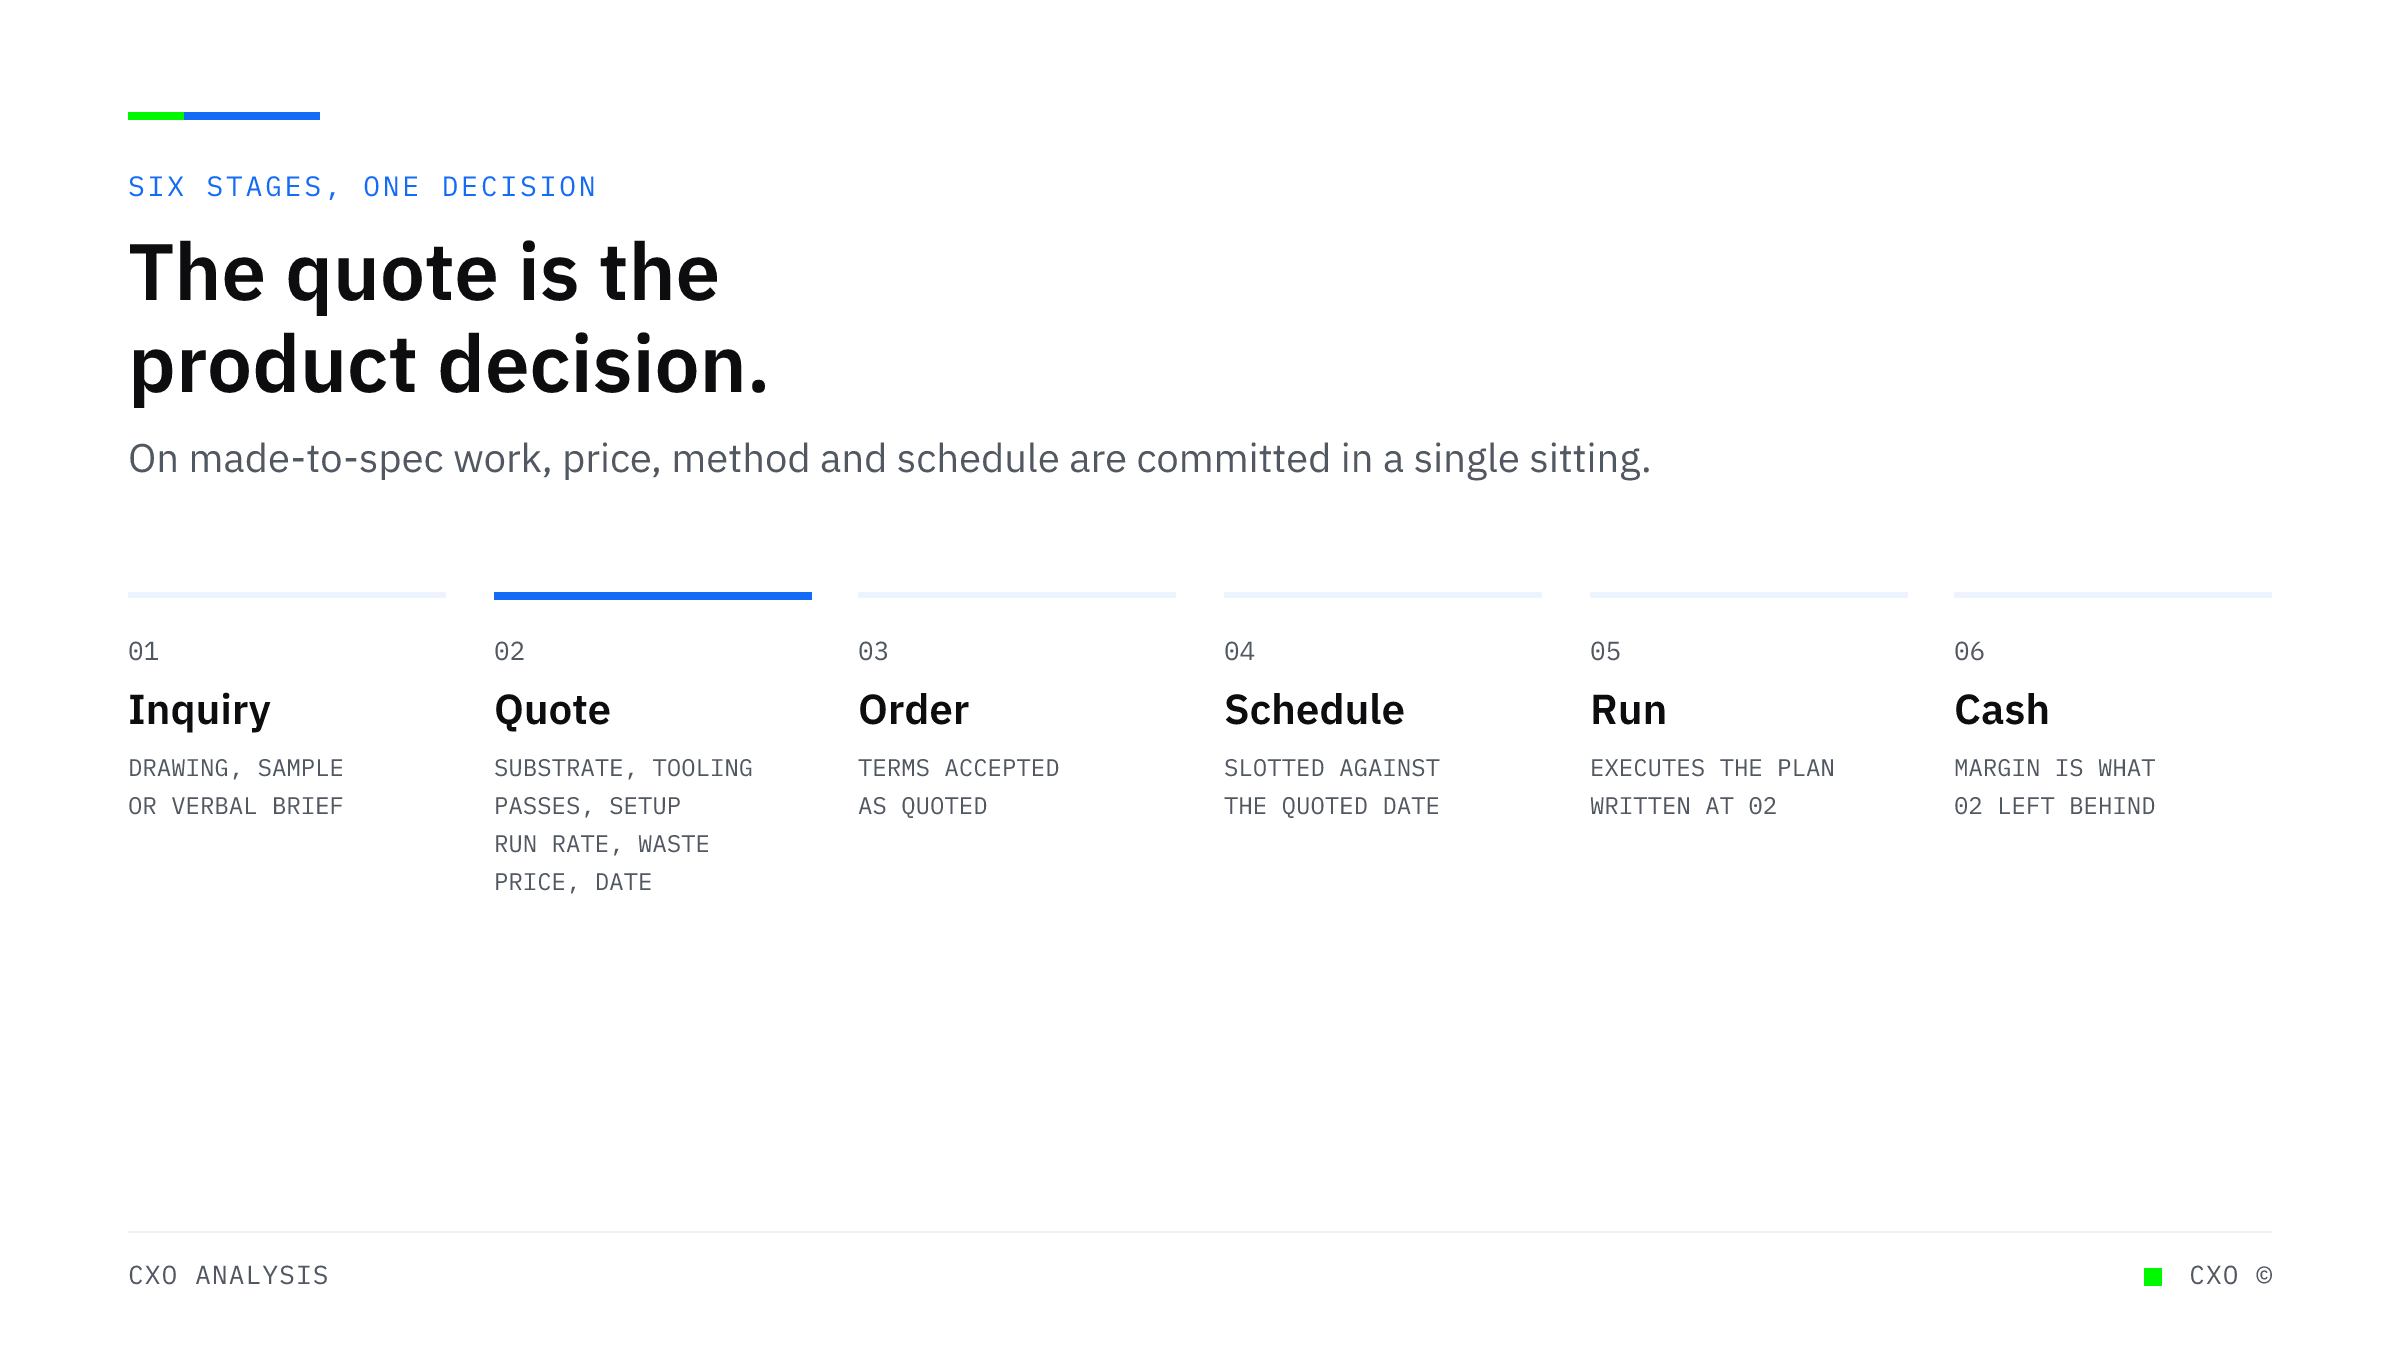
A labeled diagram of six stages from inquiry through cash for made-to-spec production, marking the quote stage as the point where substrate, tooling, run rate, waste allowance, price, and delivery date are all committed at once.

In Made-to-Spec Production, the Quote Is the Only Place the Margin Is Decided

Paper converters hold 51.7 percent of inventory as raw material against 41.5 percent for food manufacturers. That inversion traces back to the front of the process, where the specification, the price, and the schedule are all set at once.
View Insight
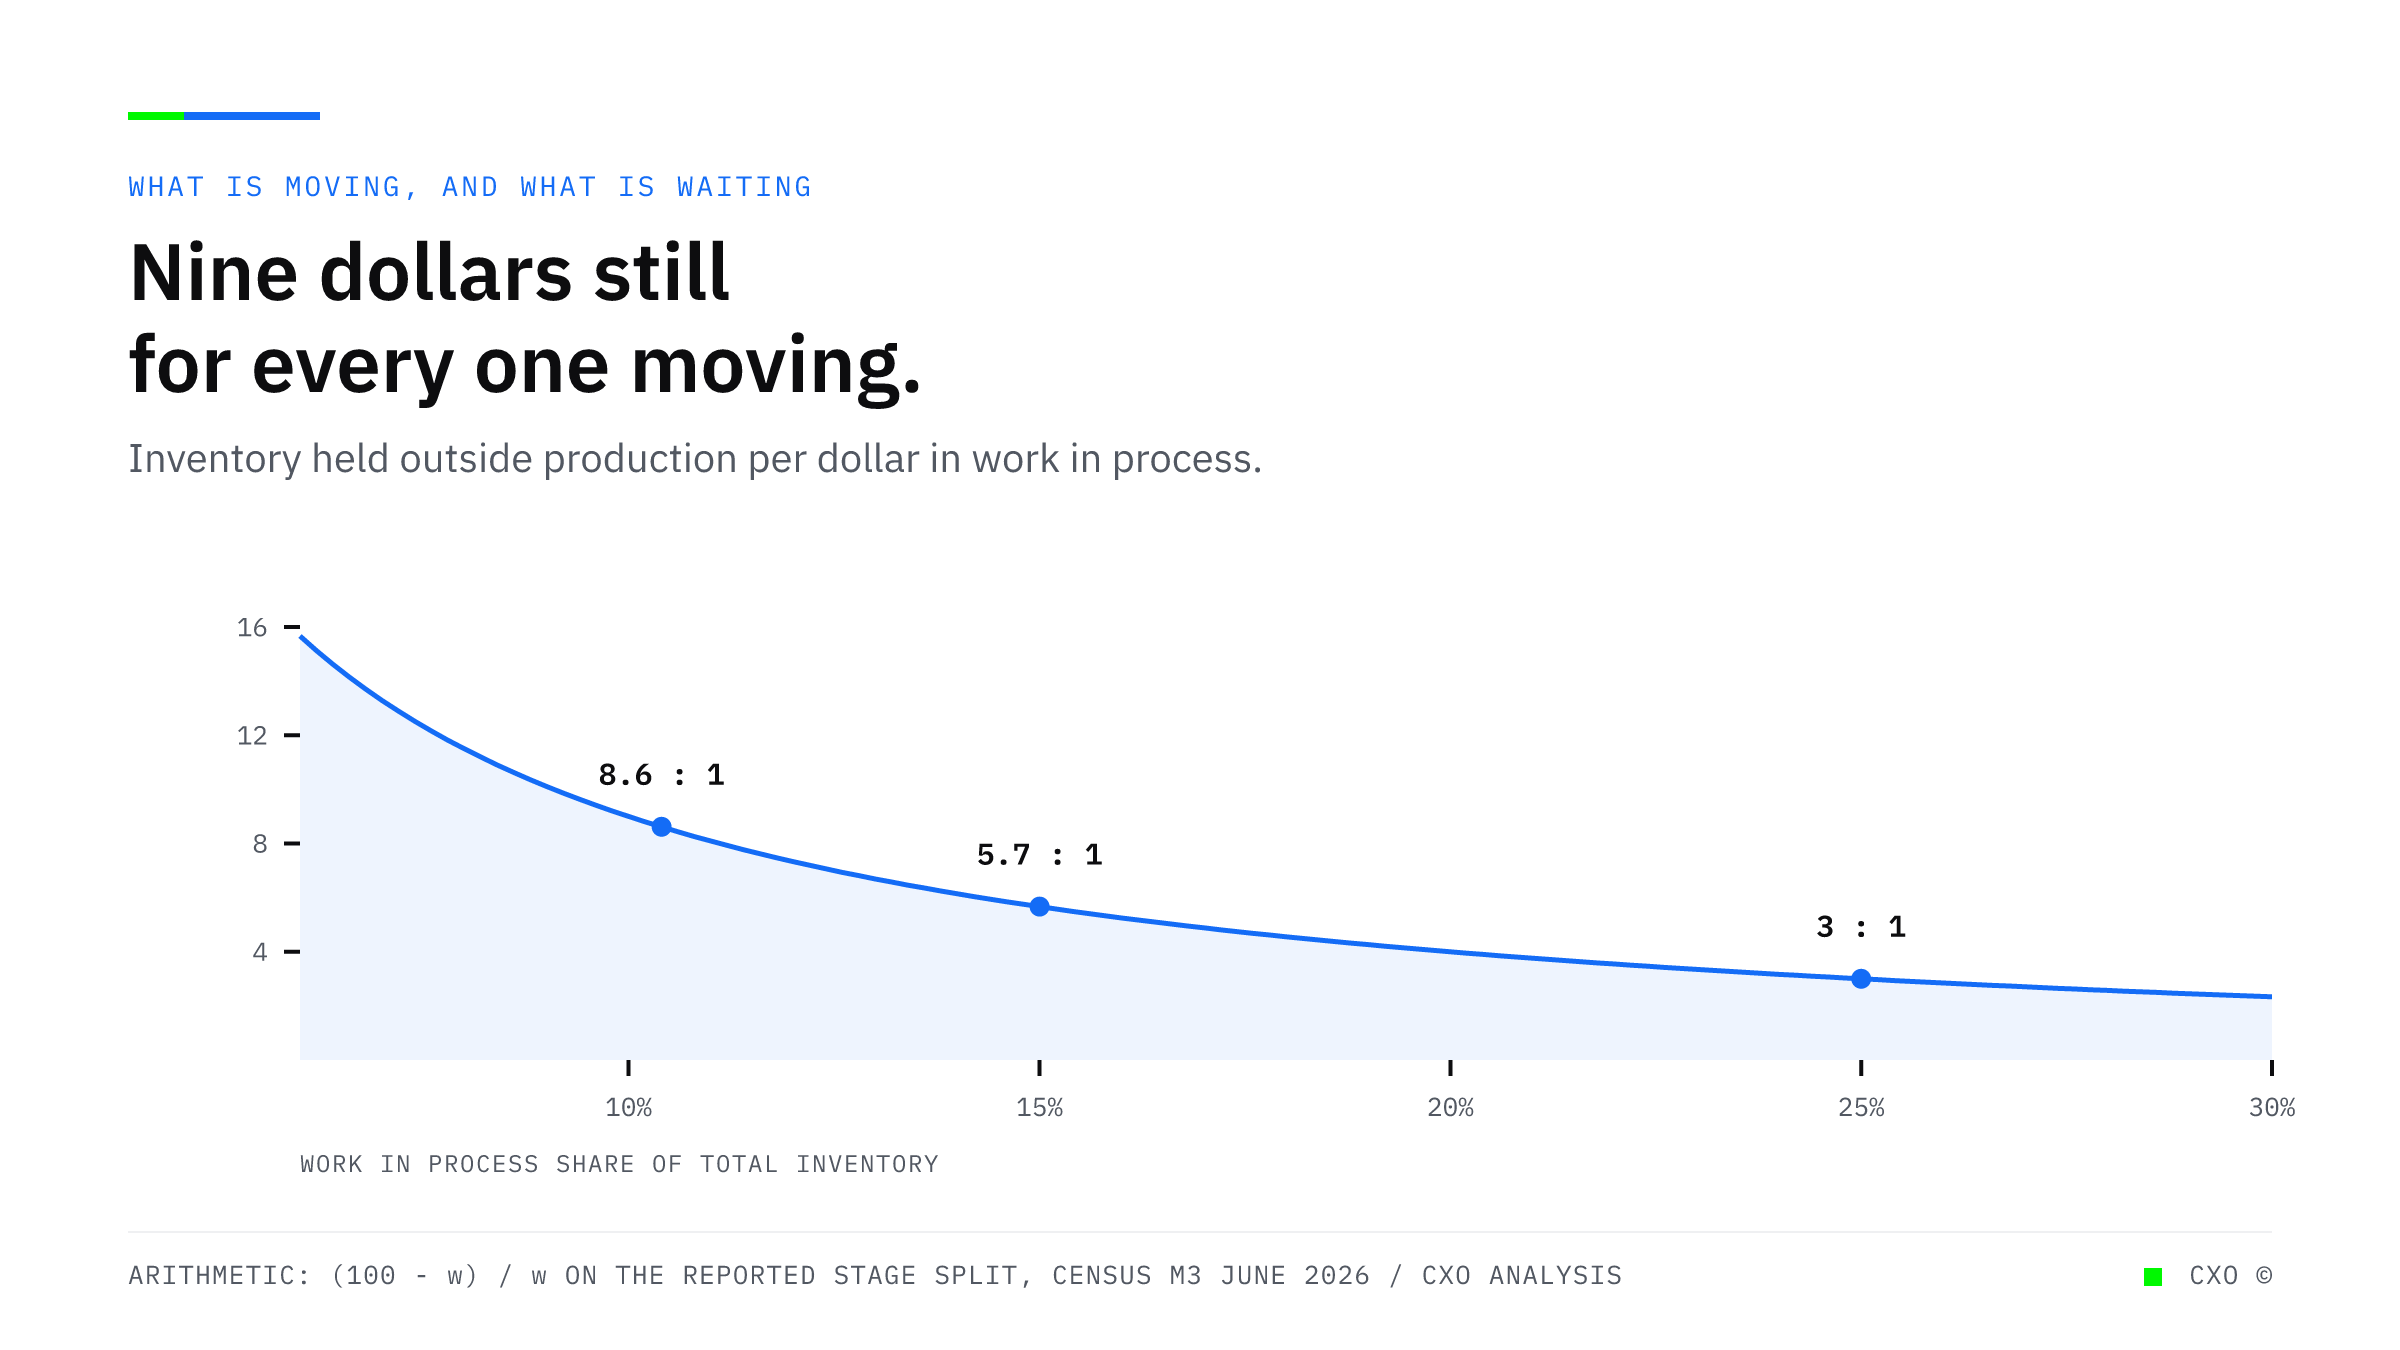
A curve showing dollars held outside production for every dollar in work in process, rising sharply as the work in process share falls, marked at the paper products figure of 10.4 percent where the ratio is 8.6 to one.

Paper Converters Hold Half Their Inventory in Raw Material and a Tenth in Production

Census data puts 51.7 percent of paper products inventory in materials and supplies against 10.4 percent in work in process. For made-to-spec production, that ratio is a statement about what happens before a job reaches the floor.
View Insight

Start with the process that costs you most.

A conversation first. A structured assessment when it earns one. Or see what a discovery finds before you book anything.

Book a discovery call See what a discovery finds