Category

Business Case & ROI

24 insights · page 3 of 3

Line chart showing equipment finance new business volume rising 22.2% versus the prior-year period while back-office capacity stays flat, opening a widening operational gap.

Equipment Finance Volume Is Up Twenty-Two Percent. The Desks Processing It Did Not Grow Twenty-Two Percent.

Equipment finance volume is up 22.2% in early 2026, but the desks processing it did not grow with it. Why hiring through a surge fails, and how lenders scale volume without scaling headcount.
View Insight
Statement graphic showing a 60 to 90 percent cycle-time reduction when a lending workflow is redesigned end to end, versus a 15 to 20 percent net gain when AI is bolted onto the existing process.

Bolt It On, or Redesign Around It: Why Your 2025 AI Purchase Underdelivered

Most lenders blame the technology when their AI underdelivers. The real issue is a point tool bolted onto an unchanged process. See why end-to-end redesign drives 60 to 90 percent cycle-time reductions.
View Insight
Before and after chart showing monthly funded deals doubling from 120 to 240 and deals per analyst rising from 20 to 40 on the same desk

The Equipment Lender That Doubled Deal Volume Without Adding a Single Headcount

How one specialty equipment lessor doubled monthly deal volume from 120 to 240 on the same six-analyst desk by orchestrating file prep, and the cost math that makes hiring the wrong growth lever.
View Insight
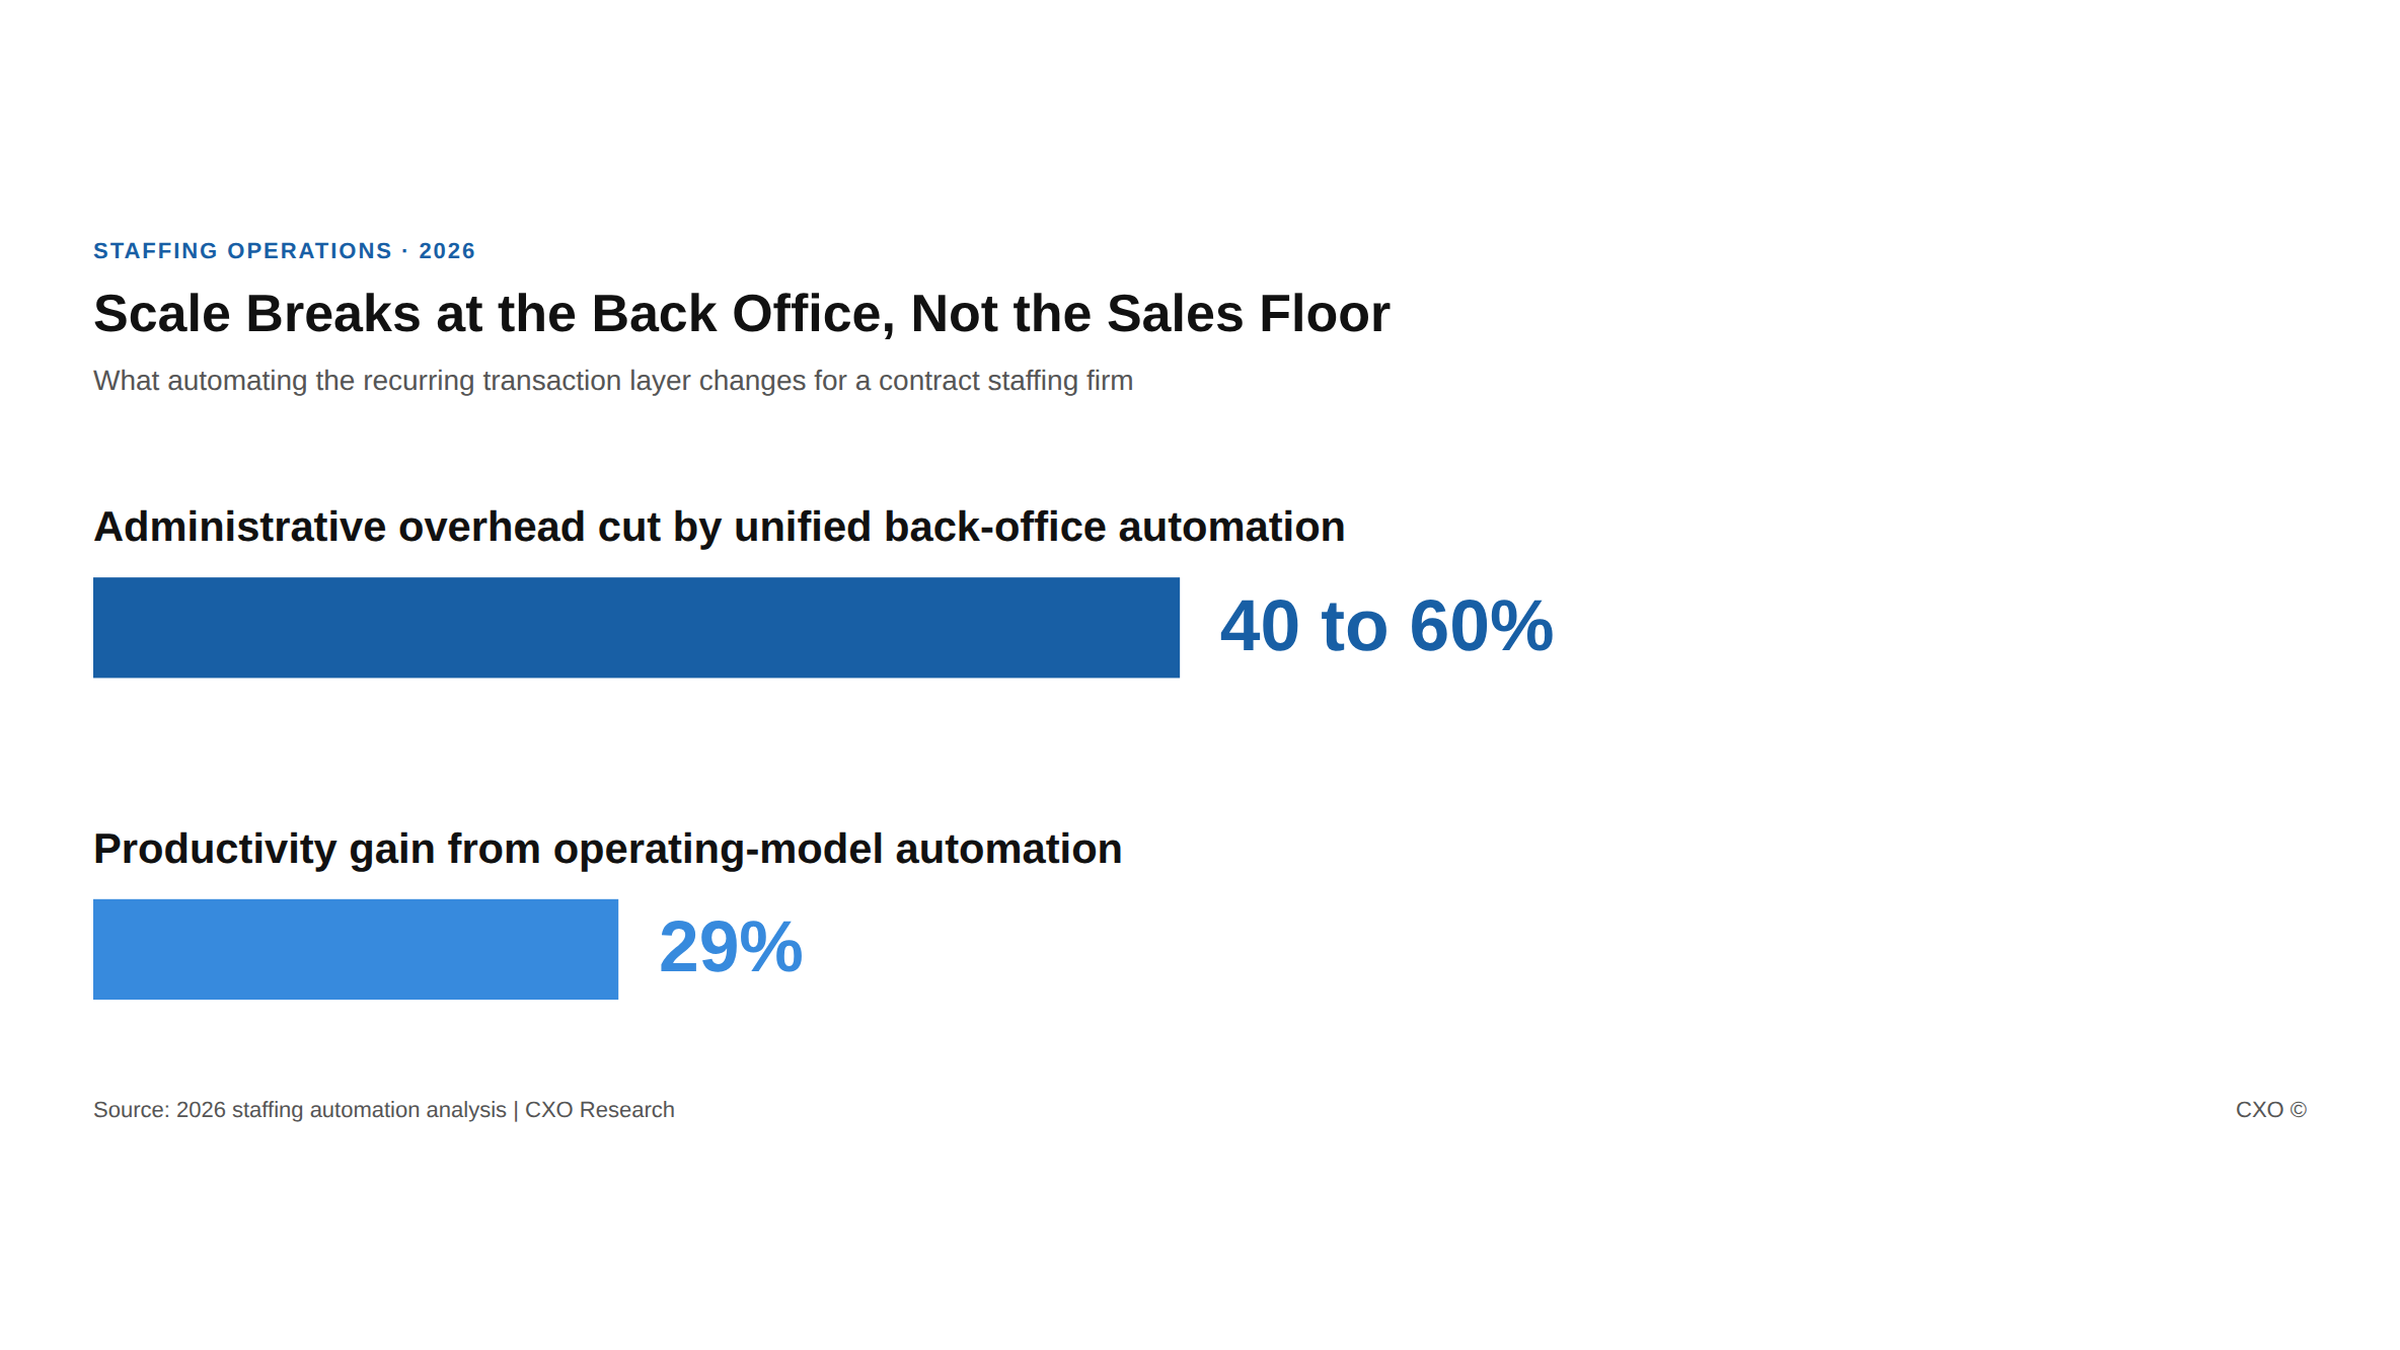
Bar chart showing back-office automation cuts staffing administrative overhead 40 to 60 percent and lifts productivity 29 percent

Contract Staffing Firms Hit a Capacity Wall at Scale. The Ones That Broke Through Automated the Back Office, Not the Sales Floor.

Contract staffing growth multiplies back-office transactions until admin drag caps the firm. See how automating the recurring transaction layer breaks the capacity wall.
View Insight
Bar chart comparing linear back-office cost scaling versus agentic cost-to-process for a specialty lender doubling loan volume.

Specialty Finance Is About to Outgrow Its Own Back Office

83% of private-credit firms expect AUM growth in 12 to 18 months. Here is why staffing back office linearly turns that growth into a $216,000 labor line, and how to break the link. Word count: ~915. Now the company post.
View Insight
Bar chart showing agentic workflows cut per-loan processing cost 35 to 50 percent versus human-assisted AI

The Exception Queue Is the Most Expensive Line in Your Loan Operation

Agentic workflows cut per-loan processing cost 35 to 50% by eliminating the exception queue scripted automation creates. Here is the math most lenders never run.
View Insight
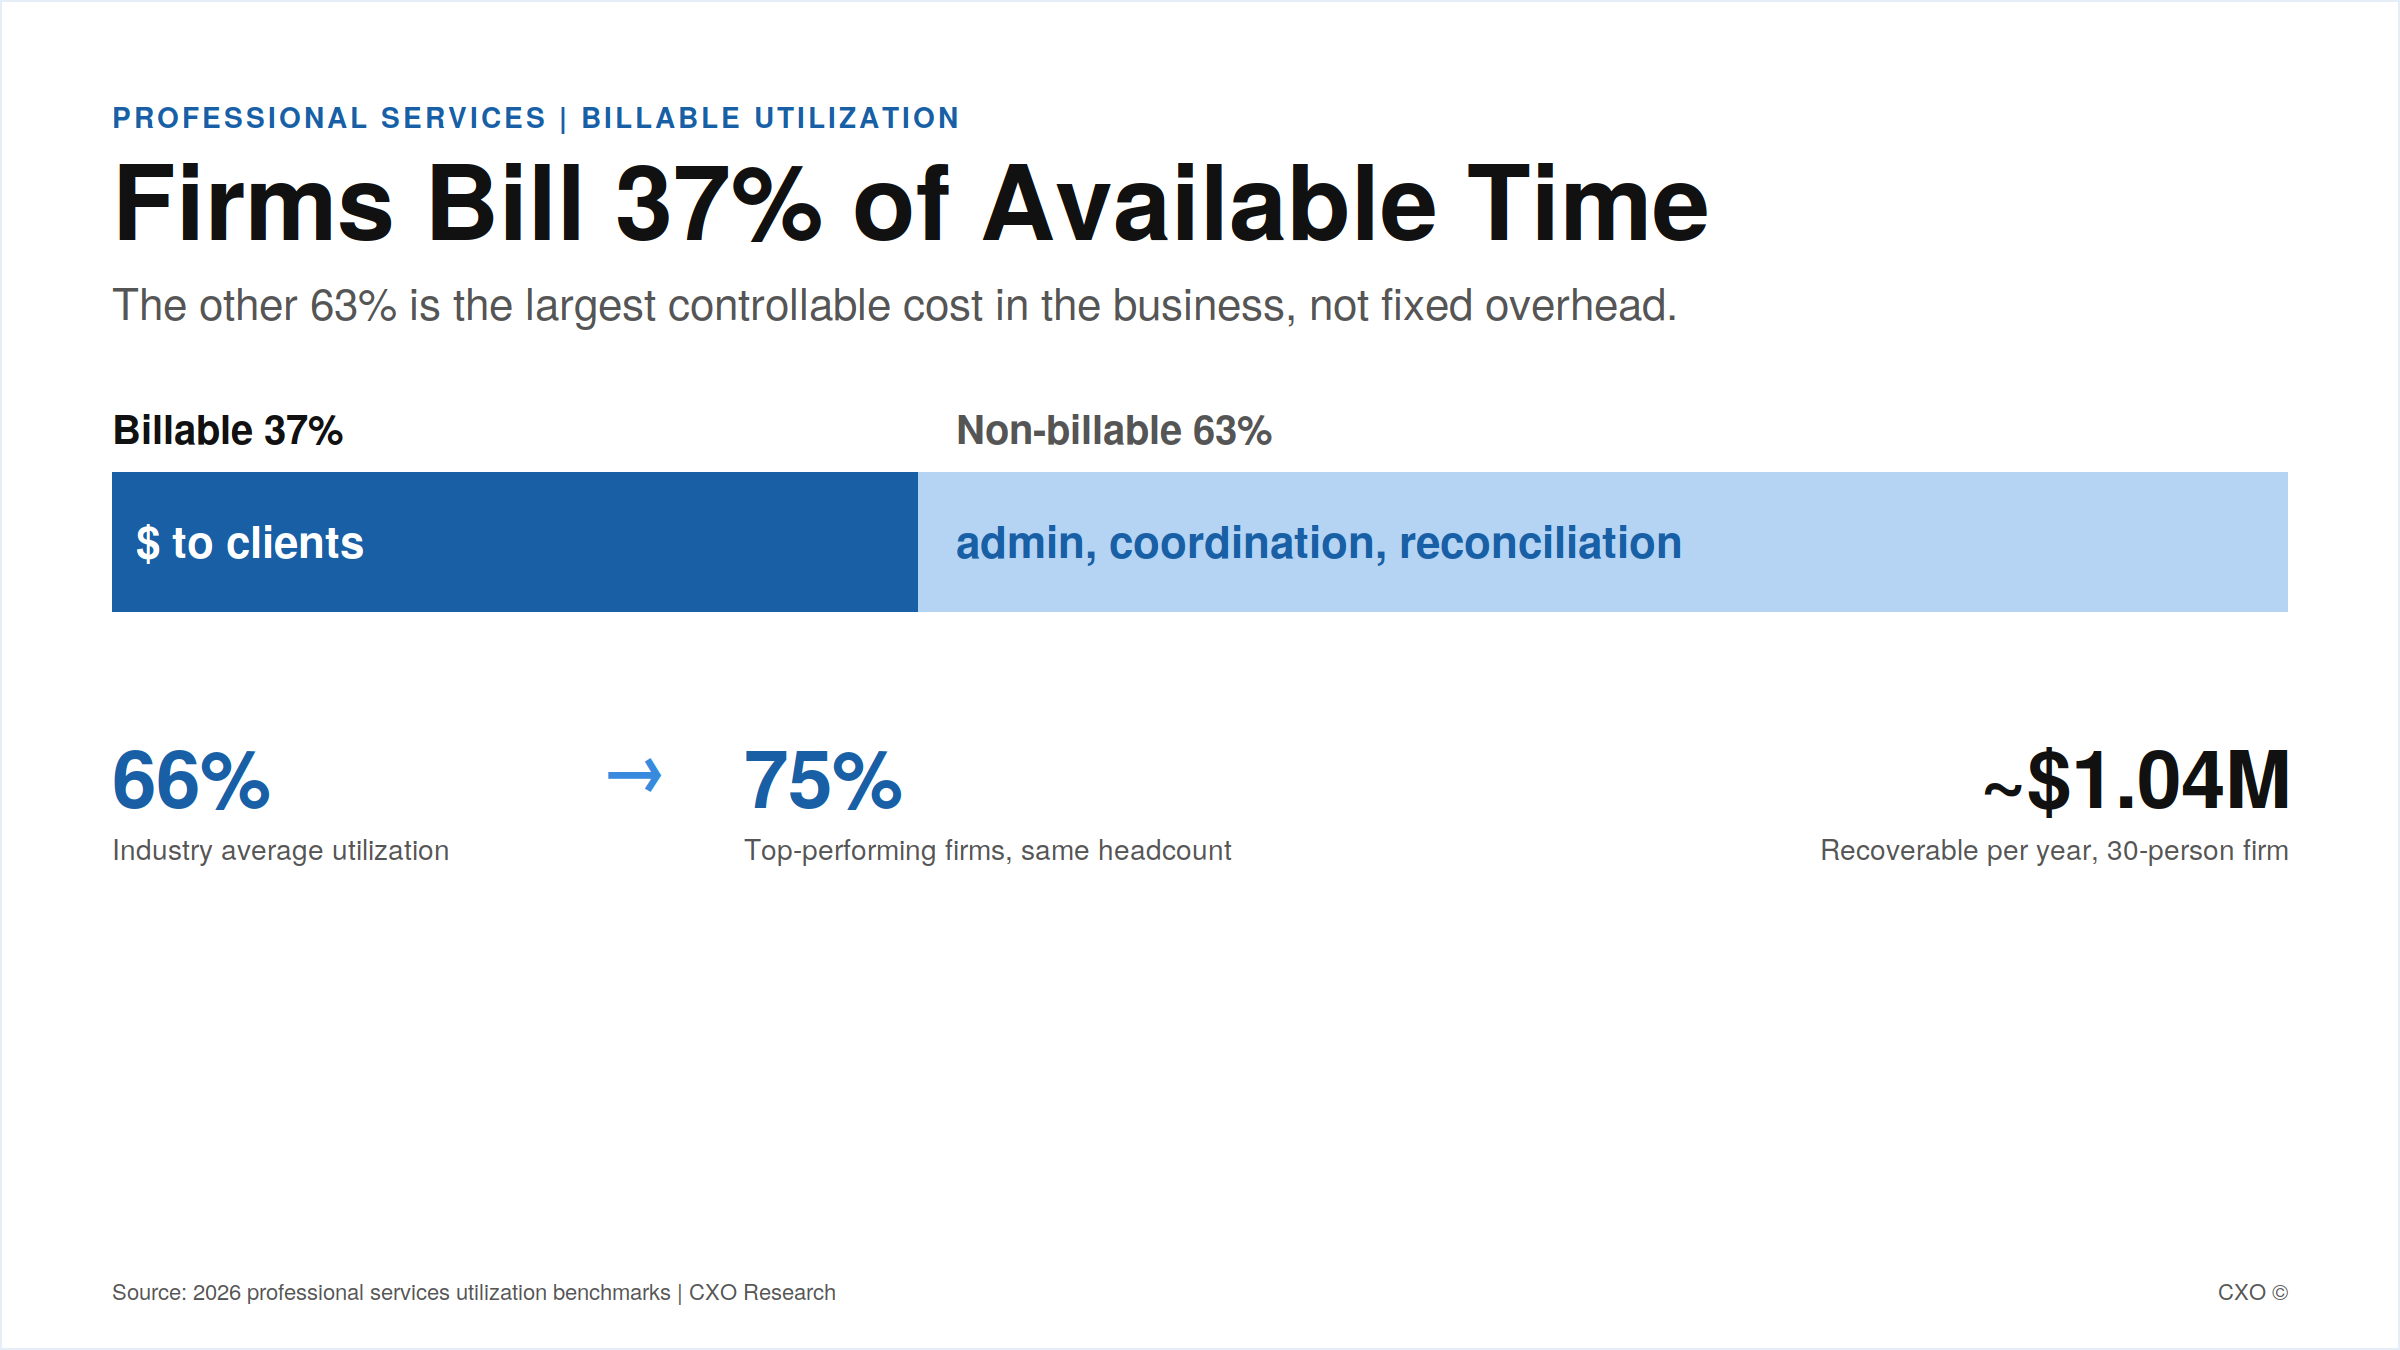
Split bar showing 37 percent of professional services time is billable and 63 percent non-billable, with utilization rising from 66 percent to 75 percent and roughly $1.04M recoverable at a 30-person firm

Your Partners Bill 37% of Their Day. The Other 63% Is Where Your Margin Is Hiding.

Professional services firms bill about 37% of available time while roughly 14 non-billable hours a week per person quietly erode margin. Here is where the money hides and how to reclaim it without hiring.
View Insight
Horizontal bar chart comparing time to funding by lender type, showing MCA same-day funding against bank and SBA timelines of weeks to months

Off-the-Shelf Underwriting Was Built for W-2 Borrowers. You Don't Lend to Them.

Off-the-shelf underwriting was built for W-2 borrowers, not the cash-flow businesses alternative lenders fund. Here is where it leaks deals and how to fix it.
View Insight

Ready to put agentic AI to work?

See where automation can take the manual, repetitive work off your team. Book a discovery call and we'll map the highest-impact processes in your operation.

Book a discovery call