Tag

alternative lending

7 insights

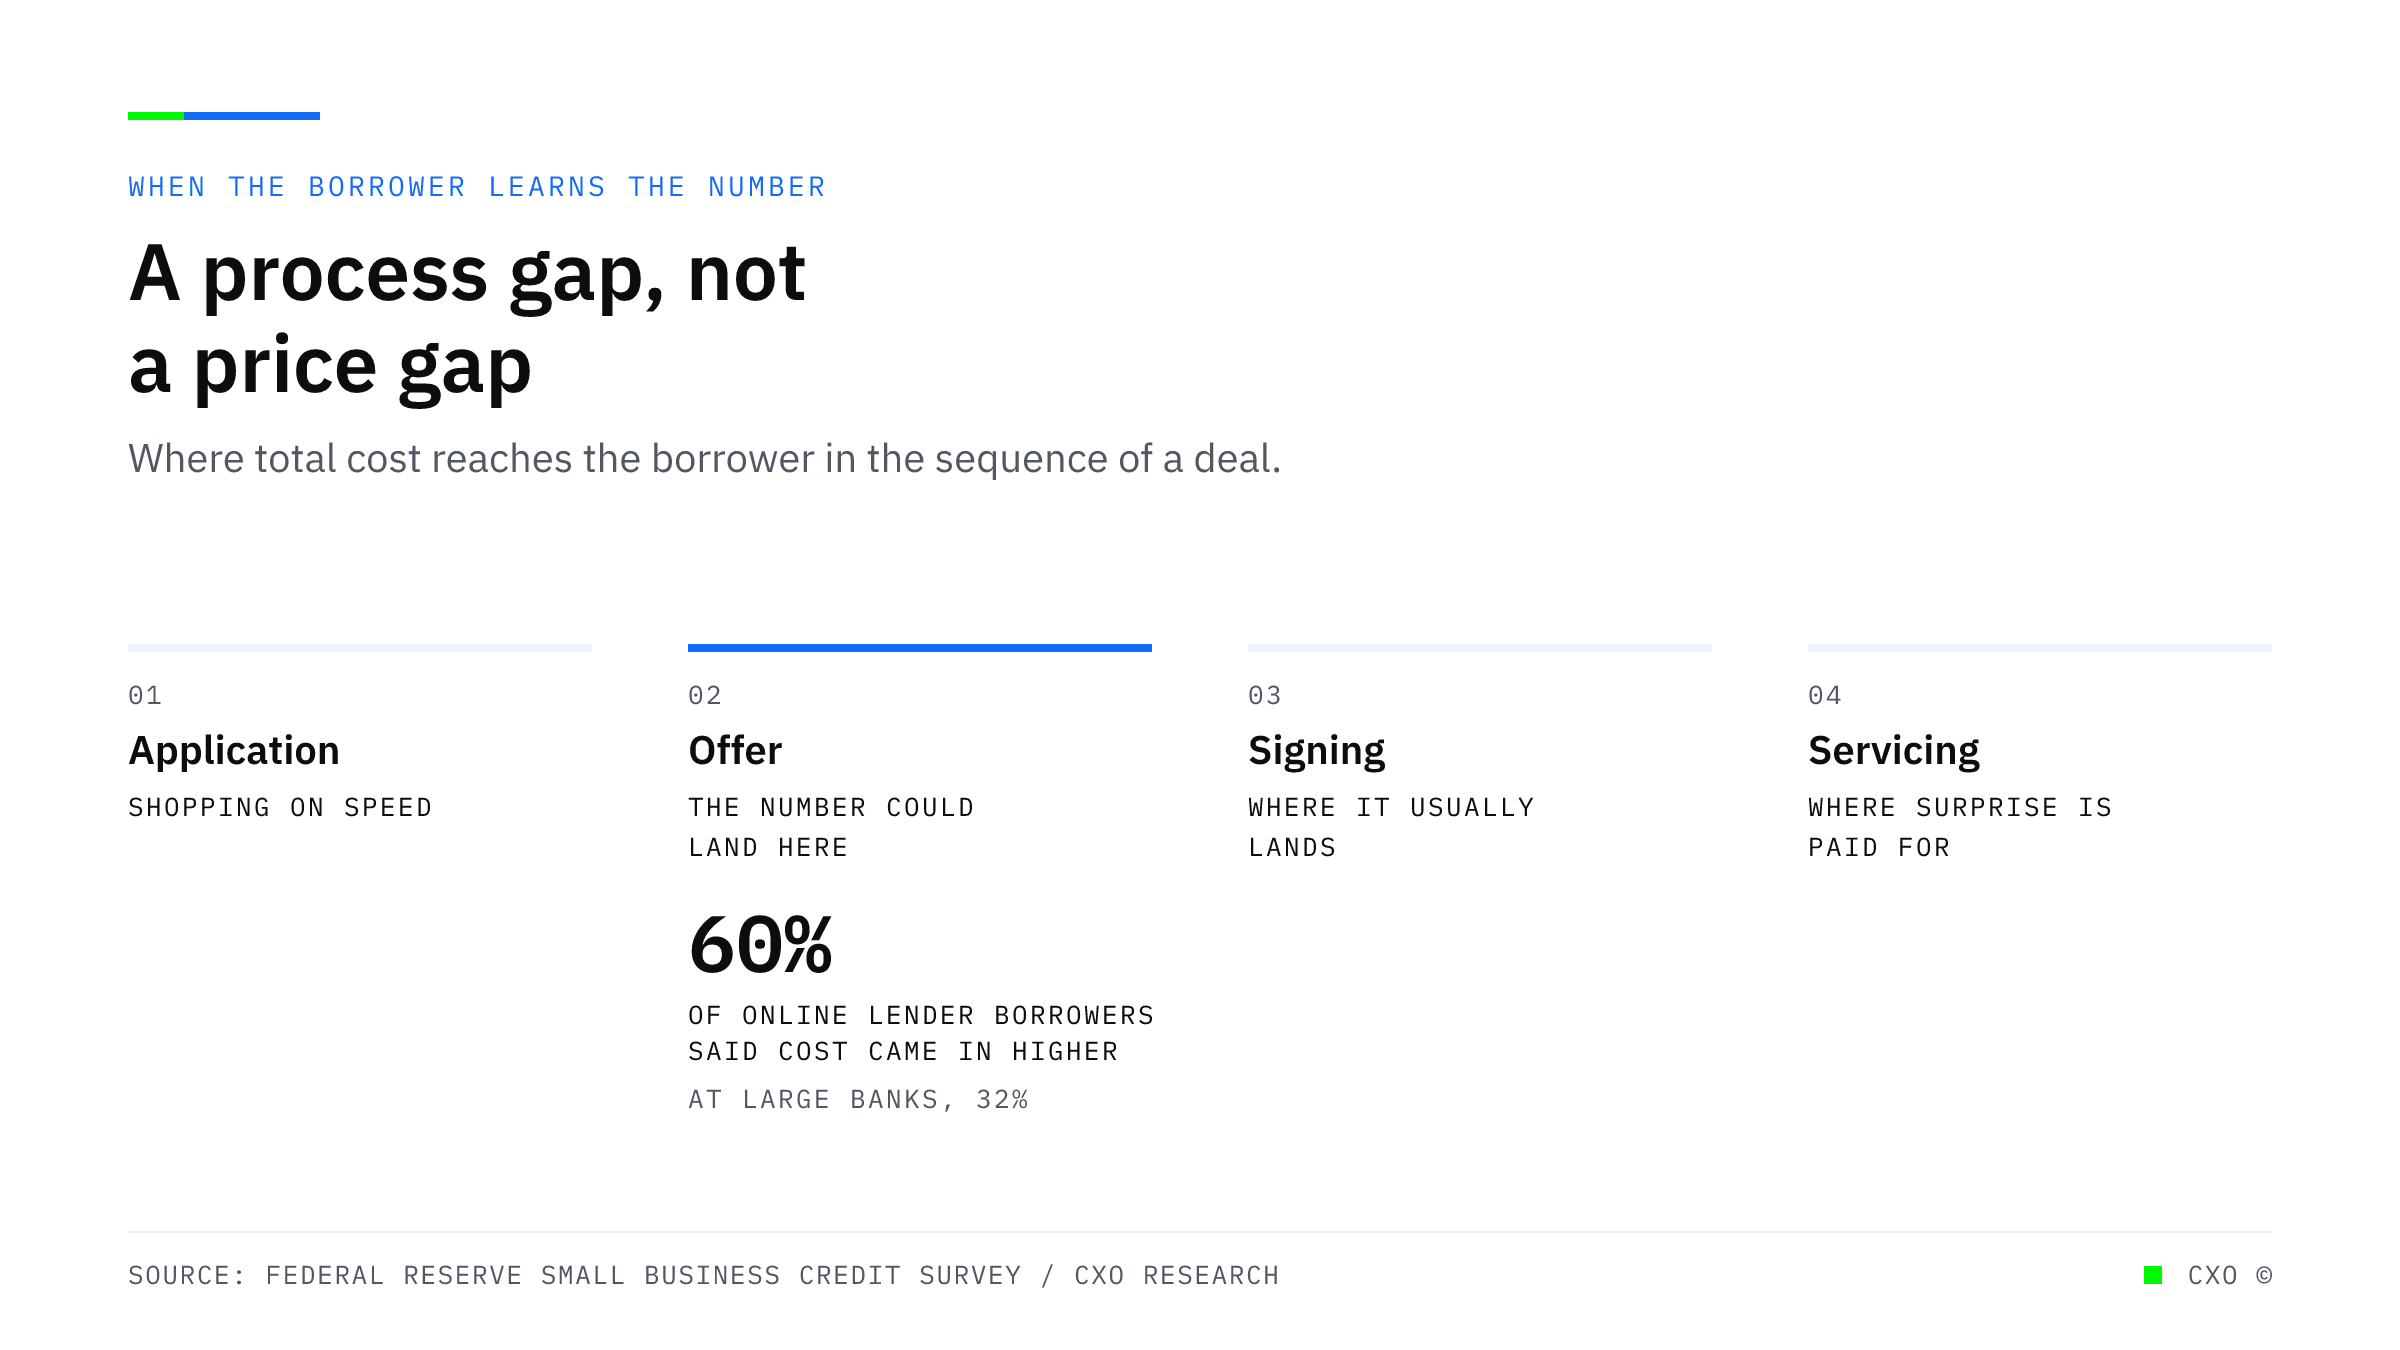
A labelled diagram of four stages in a borrower's path, marking the offer as the point where the total cost could be disclosed, against 60 percent of online lender borrowers reporting costs higher than expected and 32 percent at large banks.

Sixty Percent of Your Borrowers Were Surprised by the Cost. At Banks It Is Thirty-Two.

The same borrowers, the same market, a 28 point gap in whether the cost landed as expected. That difference is produced by process, which means it can be closed without touching price.
View Insight
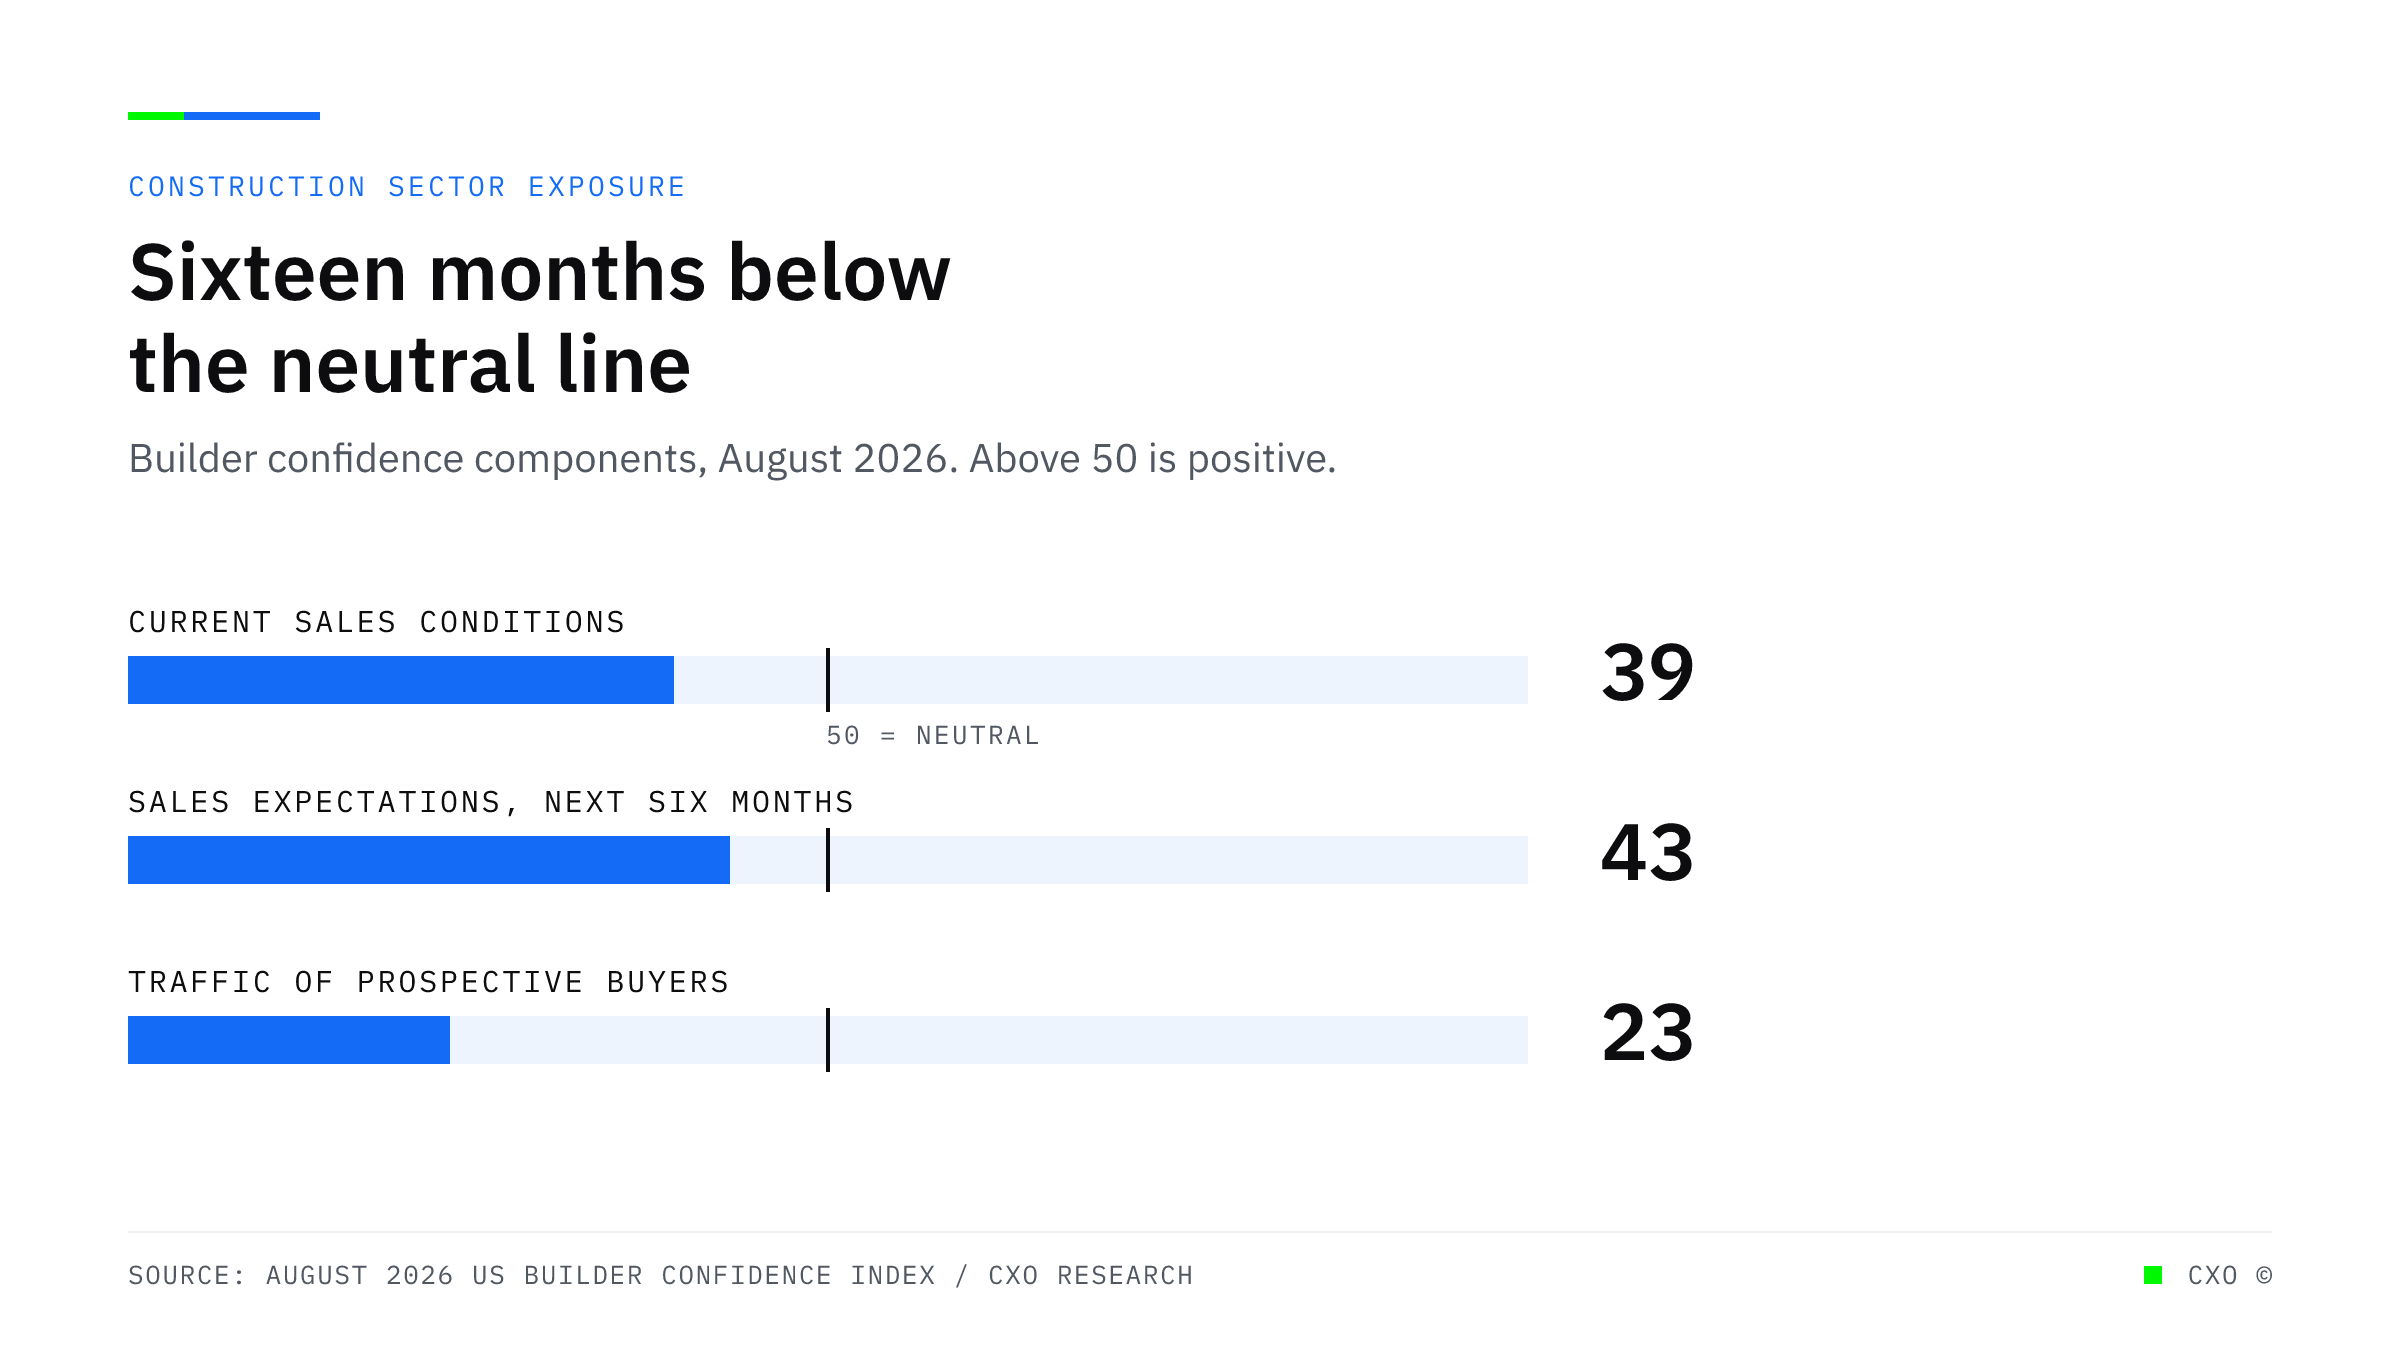
Three bullet bars showing builder confidence components against the neutral reading of 50: current sales conditions at 39, sales expectations at 43, and prospective buyer traffic at 23.

Housing Starts Fell 12.4 Percent. That Reaches a Lending Book Through Files That Look Unrelated.

July housing starts fell 12.4 percent on the month and 13.5 percent on the year, with builder confidence at 35 for a sixteenth straight month. Sector exposure arrives as many separate problems.
View Insight
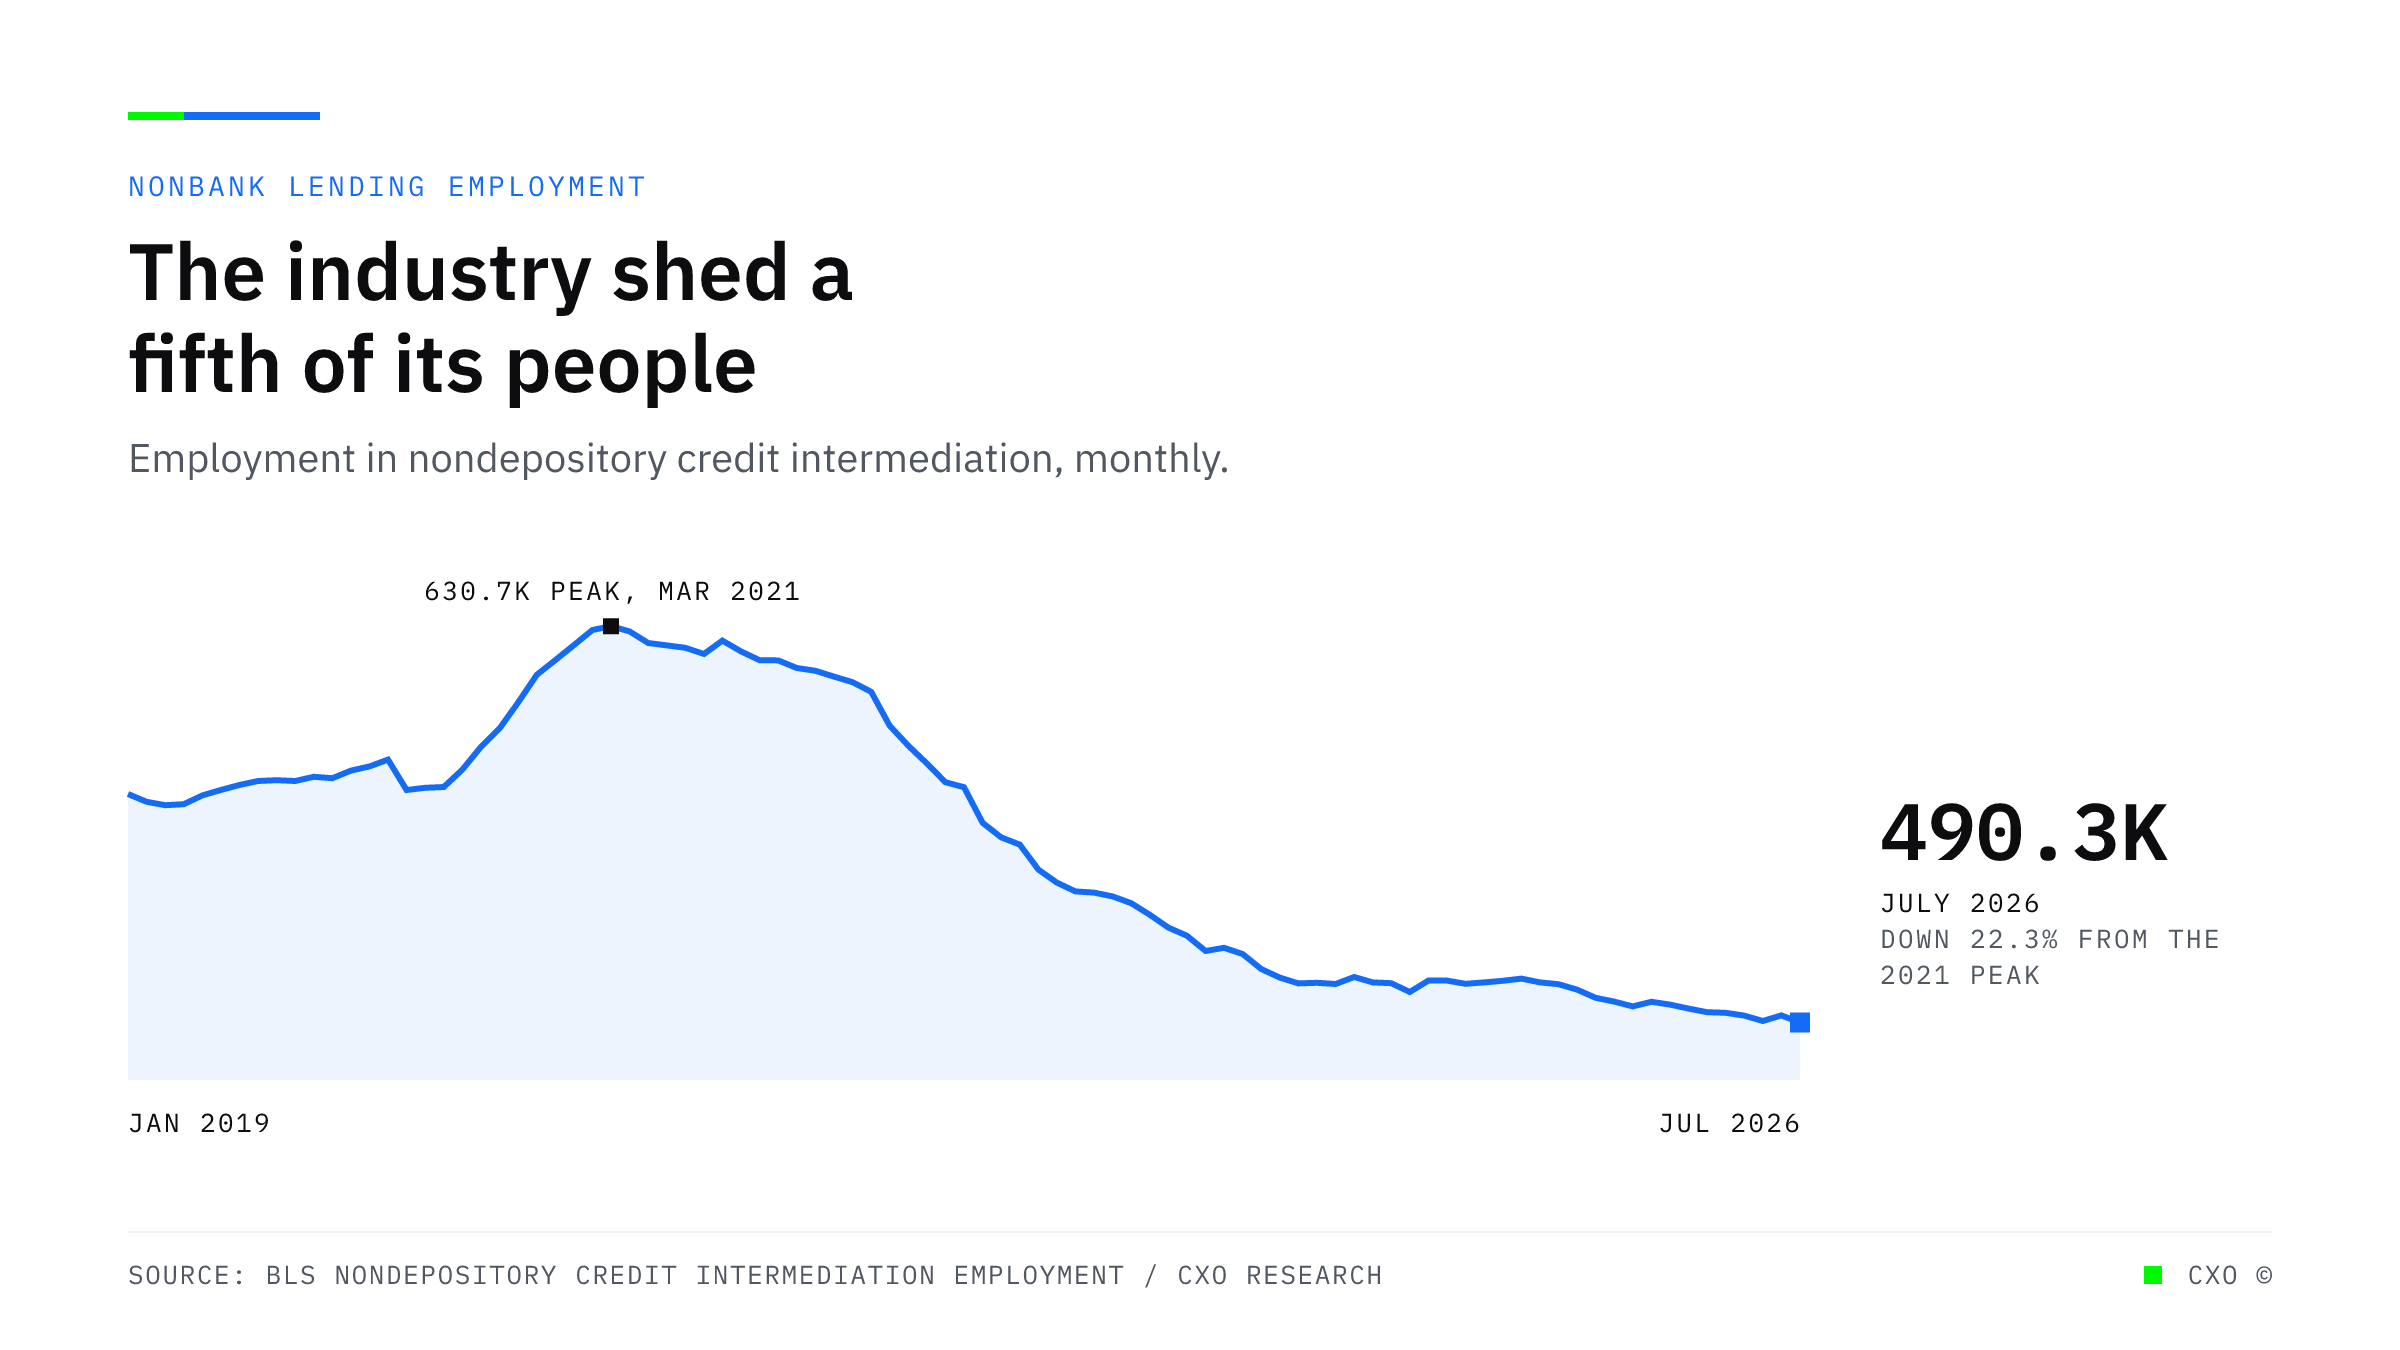
A curve of monthly employment in nondepository credit intermediation, peaking at 630,700 in March 2021 and falling steadily to 490,300 in July 2026, a decline of 22.3 percent.

The Industry Has 140,000 Fewer People Than in 2021 and a Larger Share of the Applications

Employment in nondepository credit intermediation has fallen 22.3 percent from its 2021 peak and is still declining, while the share of small business applicants going to online lenders rose to 29 percent.
View Insight
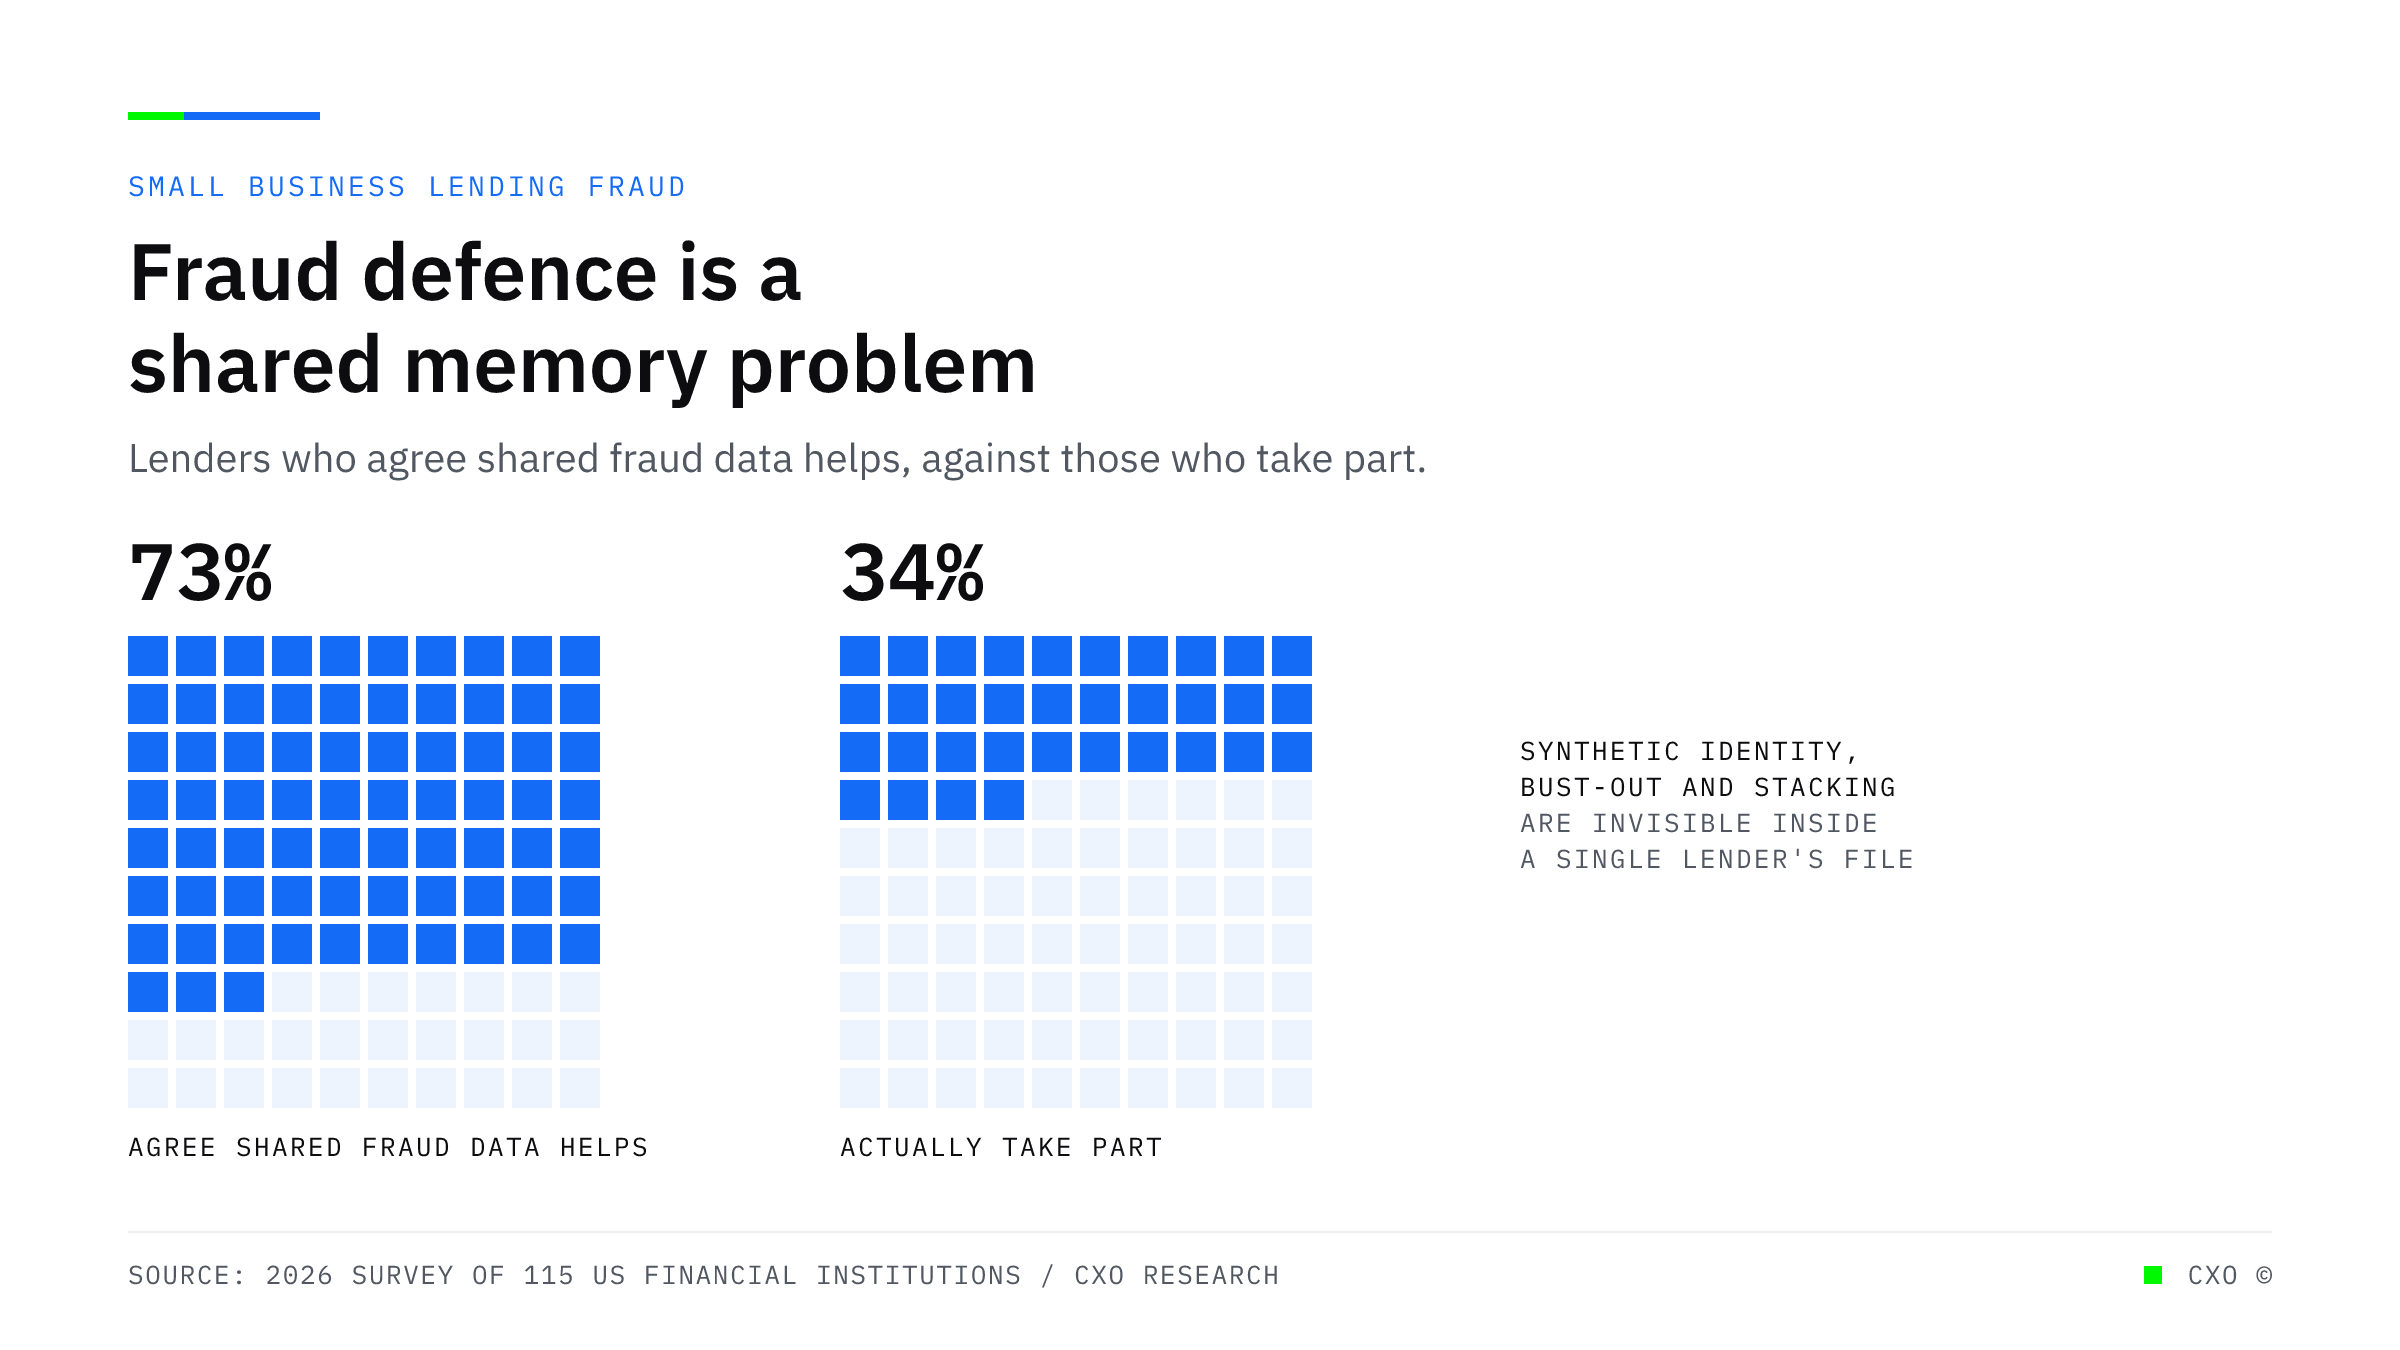
Two grids of 100 squares comparing lenders who agree that shared industry fraud data helps, at 73 percent, against the 34 percent who actually take part in it.

The Fraud Growing Fastest Is the Kind You Cannot See in Your Own File

Synthetic identity, bust-out and application stacking are the three fastest growing fraud types, and none of them are visible in one lender's own file. The defence is recall, not detection.
View Insight
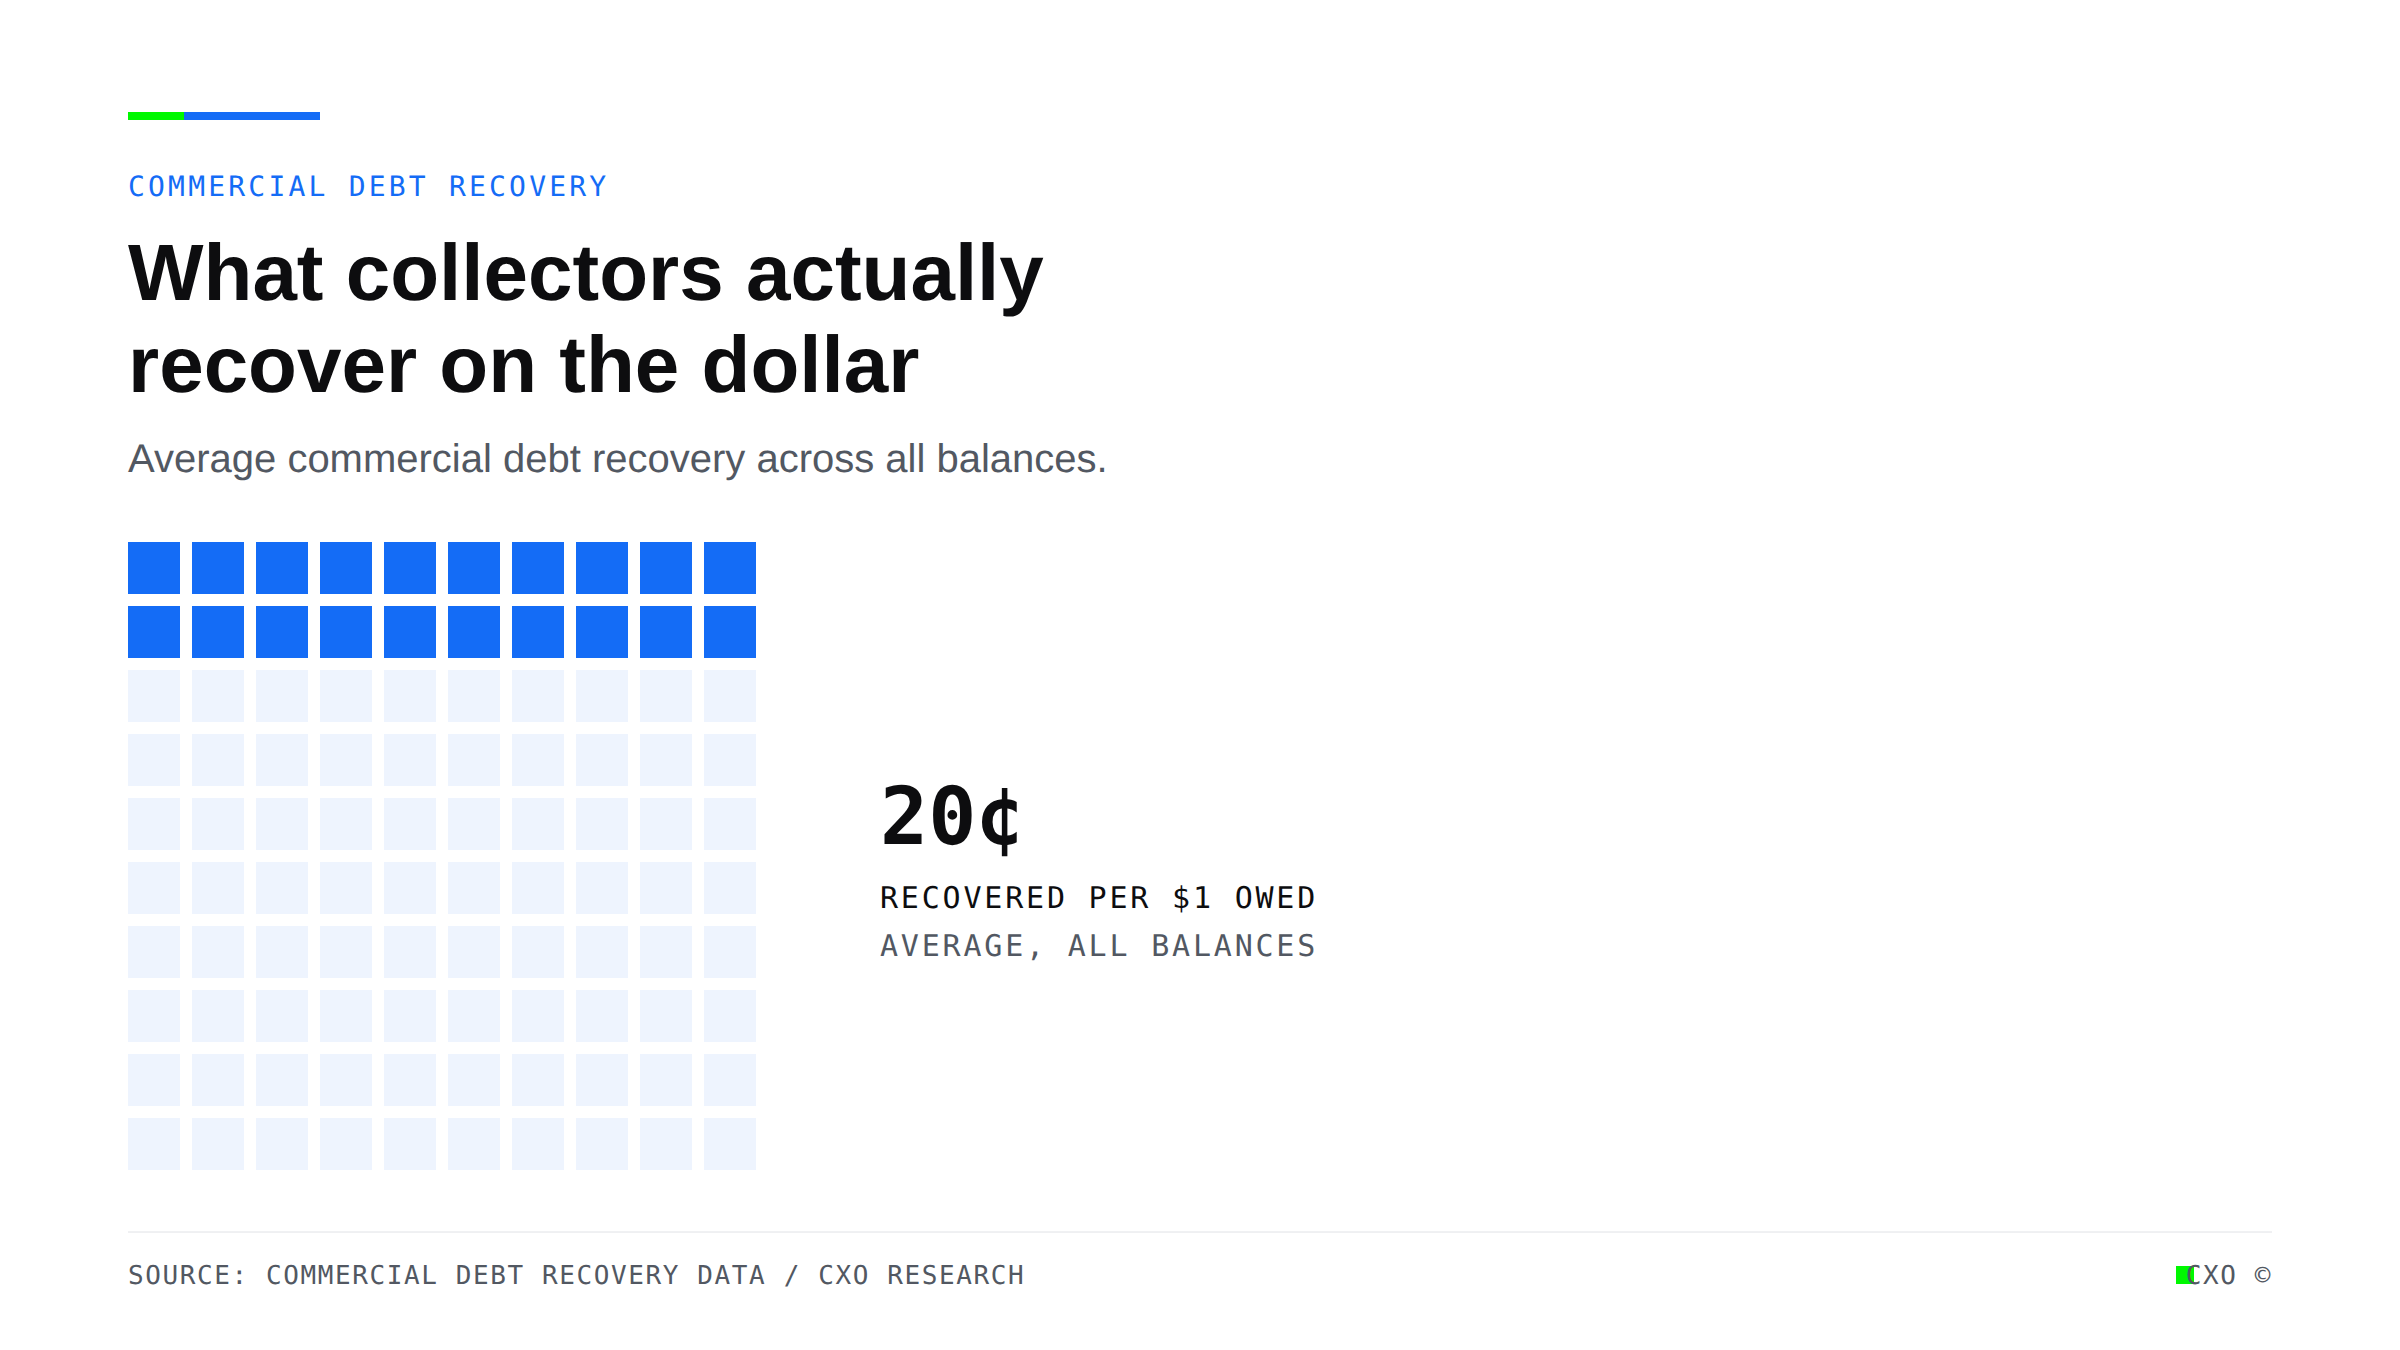
A grid of 100 squares with 20 filled in blue, showing that commercial debt collectors recover about twenty cents on the dollar owed.

Every MCA Collections Contact Is Now a Compliance Record

Federal small-business lending data rules and roughly ten state disclosure laws have turned documented, consistent MCA collections into a compliance requirement, not just a recovery tactic.
View Insight
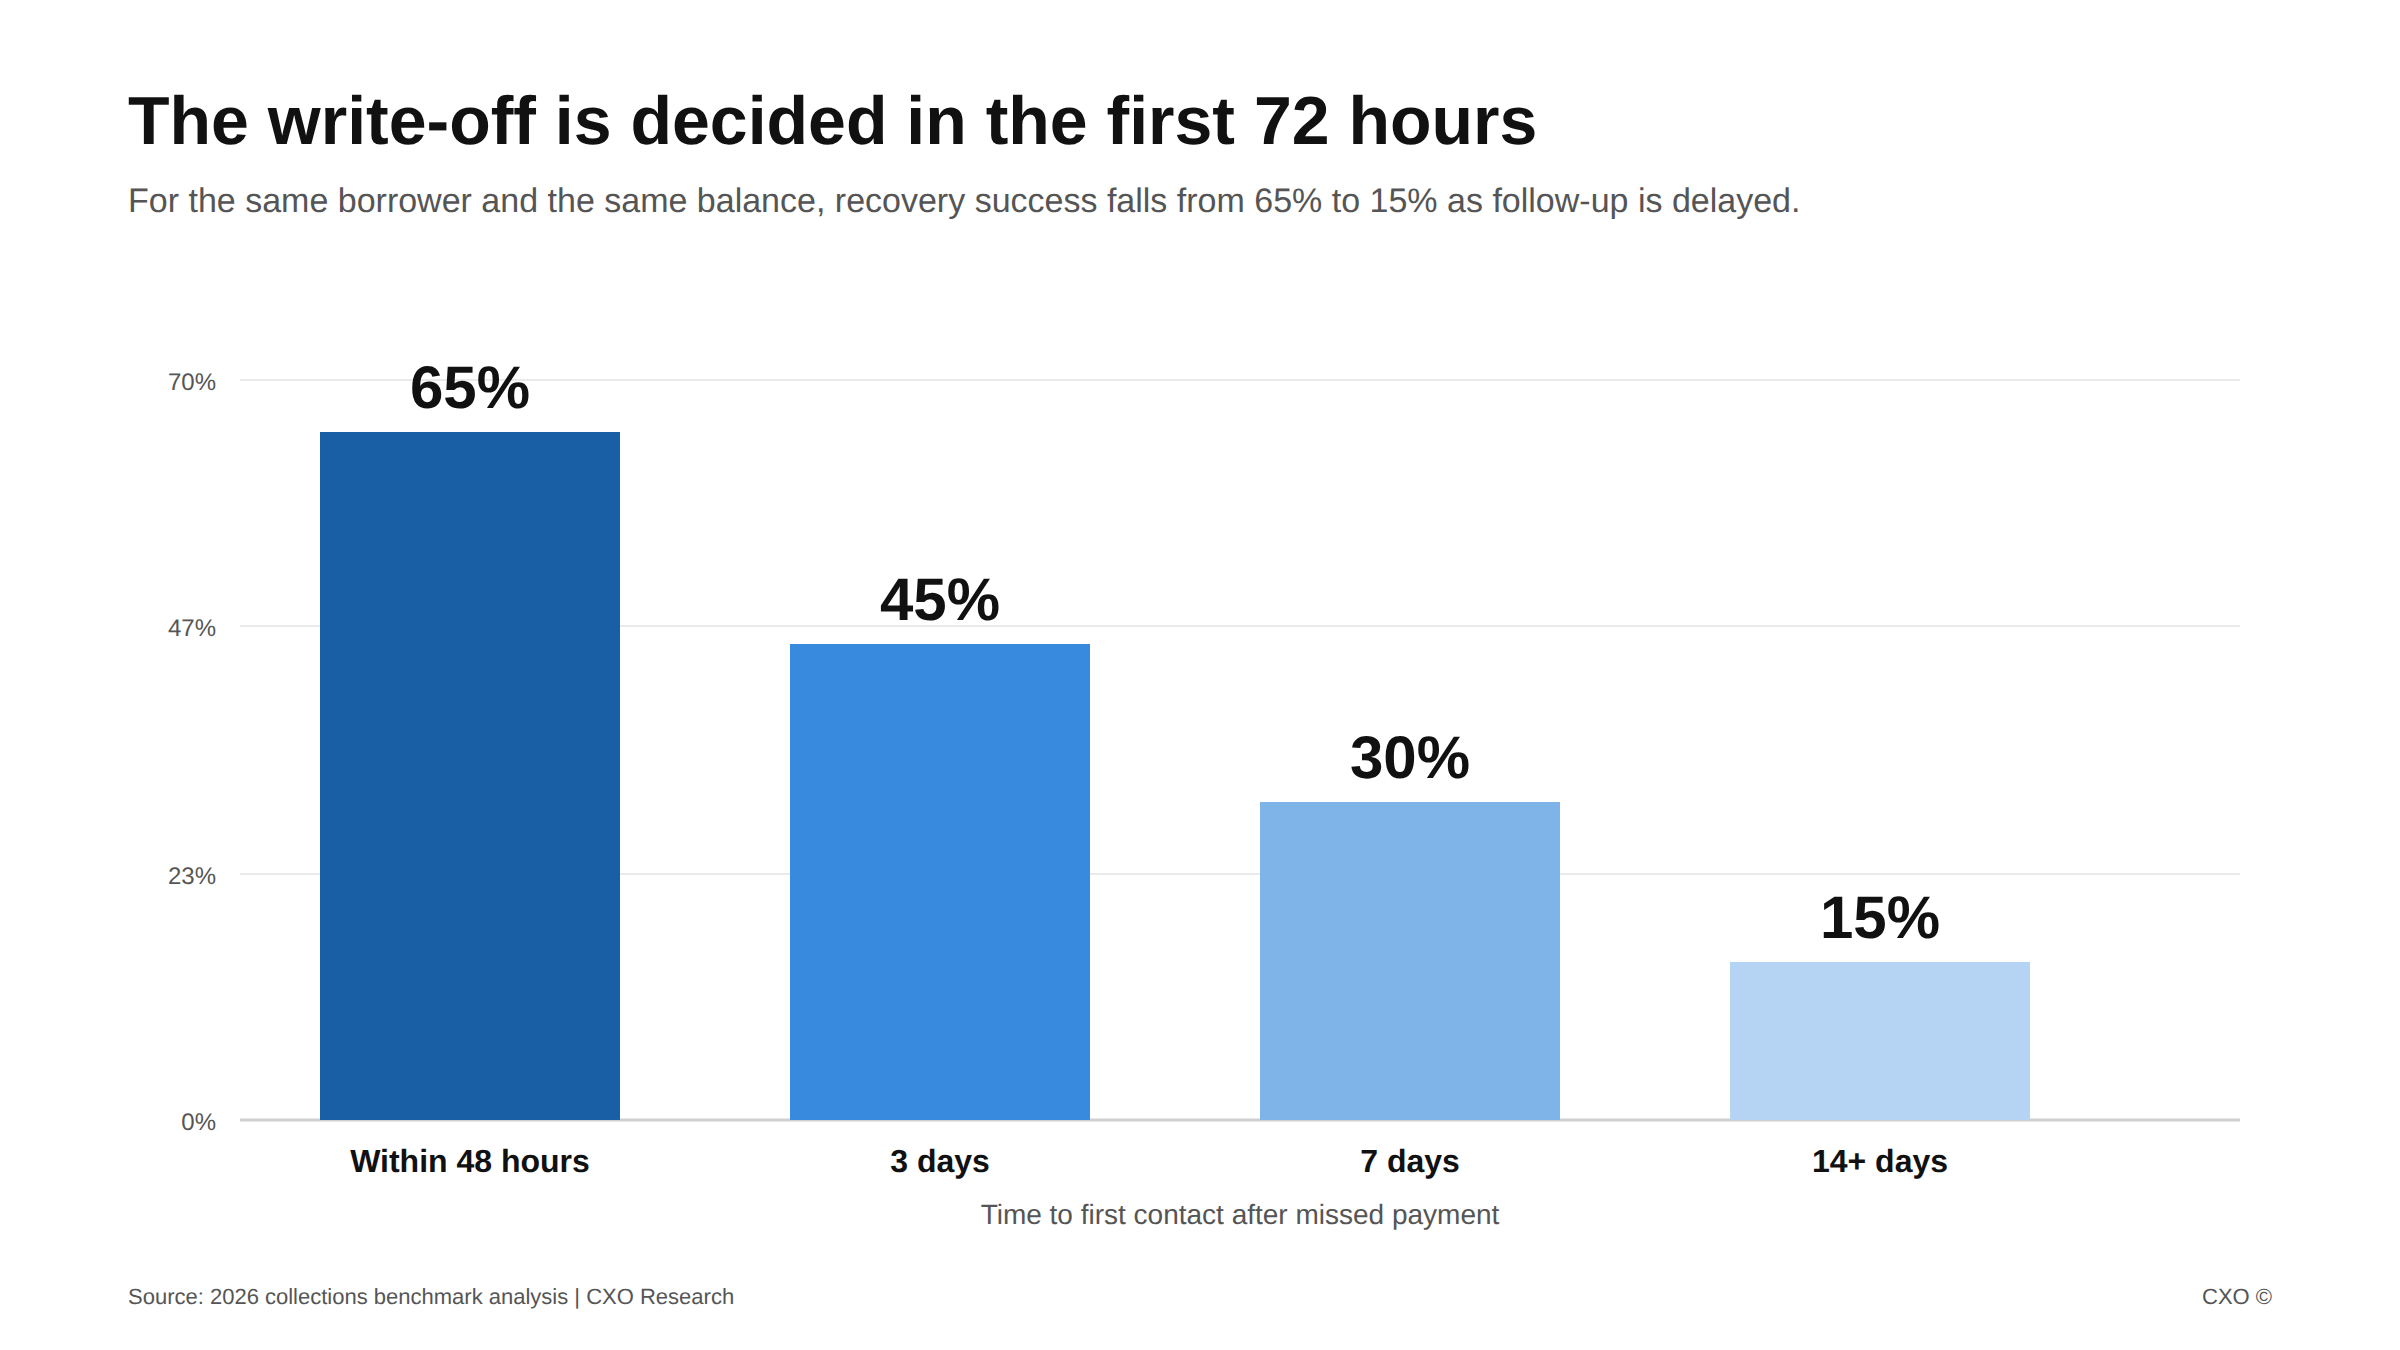
Bar chart: debt recovery success falls from 65% within 48 hours to 15% after 14 days for alternative lenders.

The Recoverable AR You're Writing Off Is a Timing Failure, Not a Credit Failure

For alternative lenders, 15 to 20% of recoverable AR is lost to slow follow-up, not bad credit. See how contact timing drives recovery and how automated cadence closes the gap.
View Insight
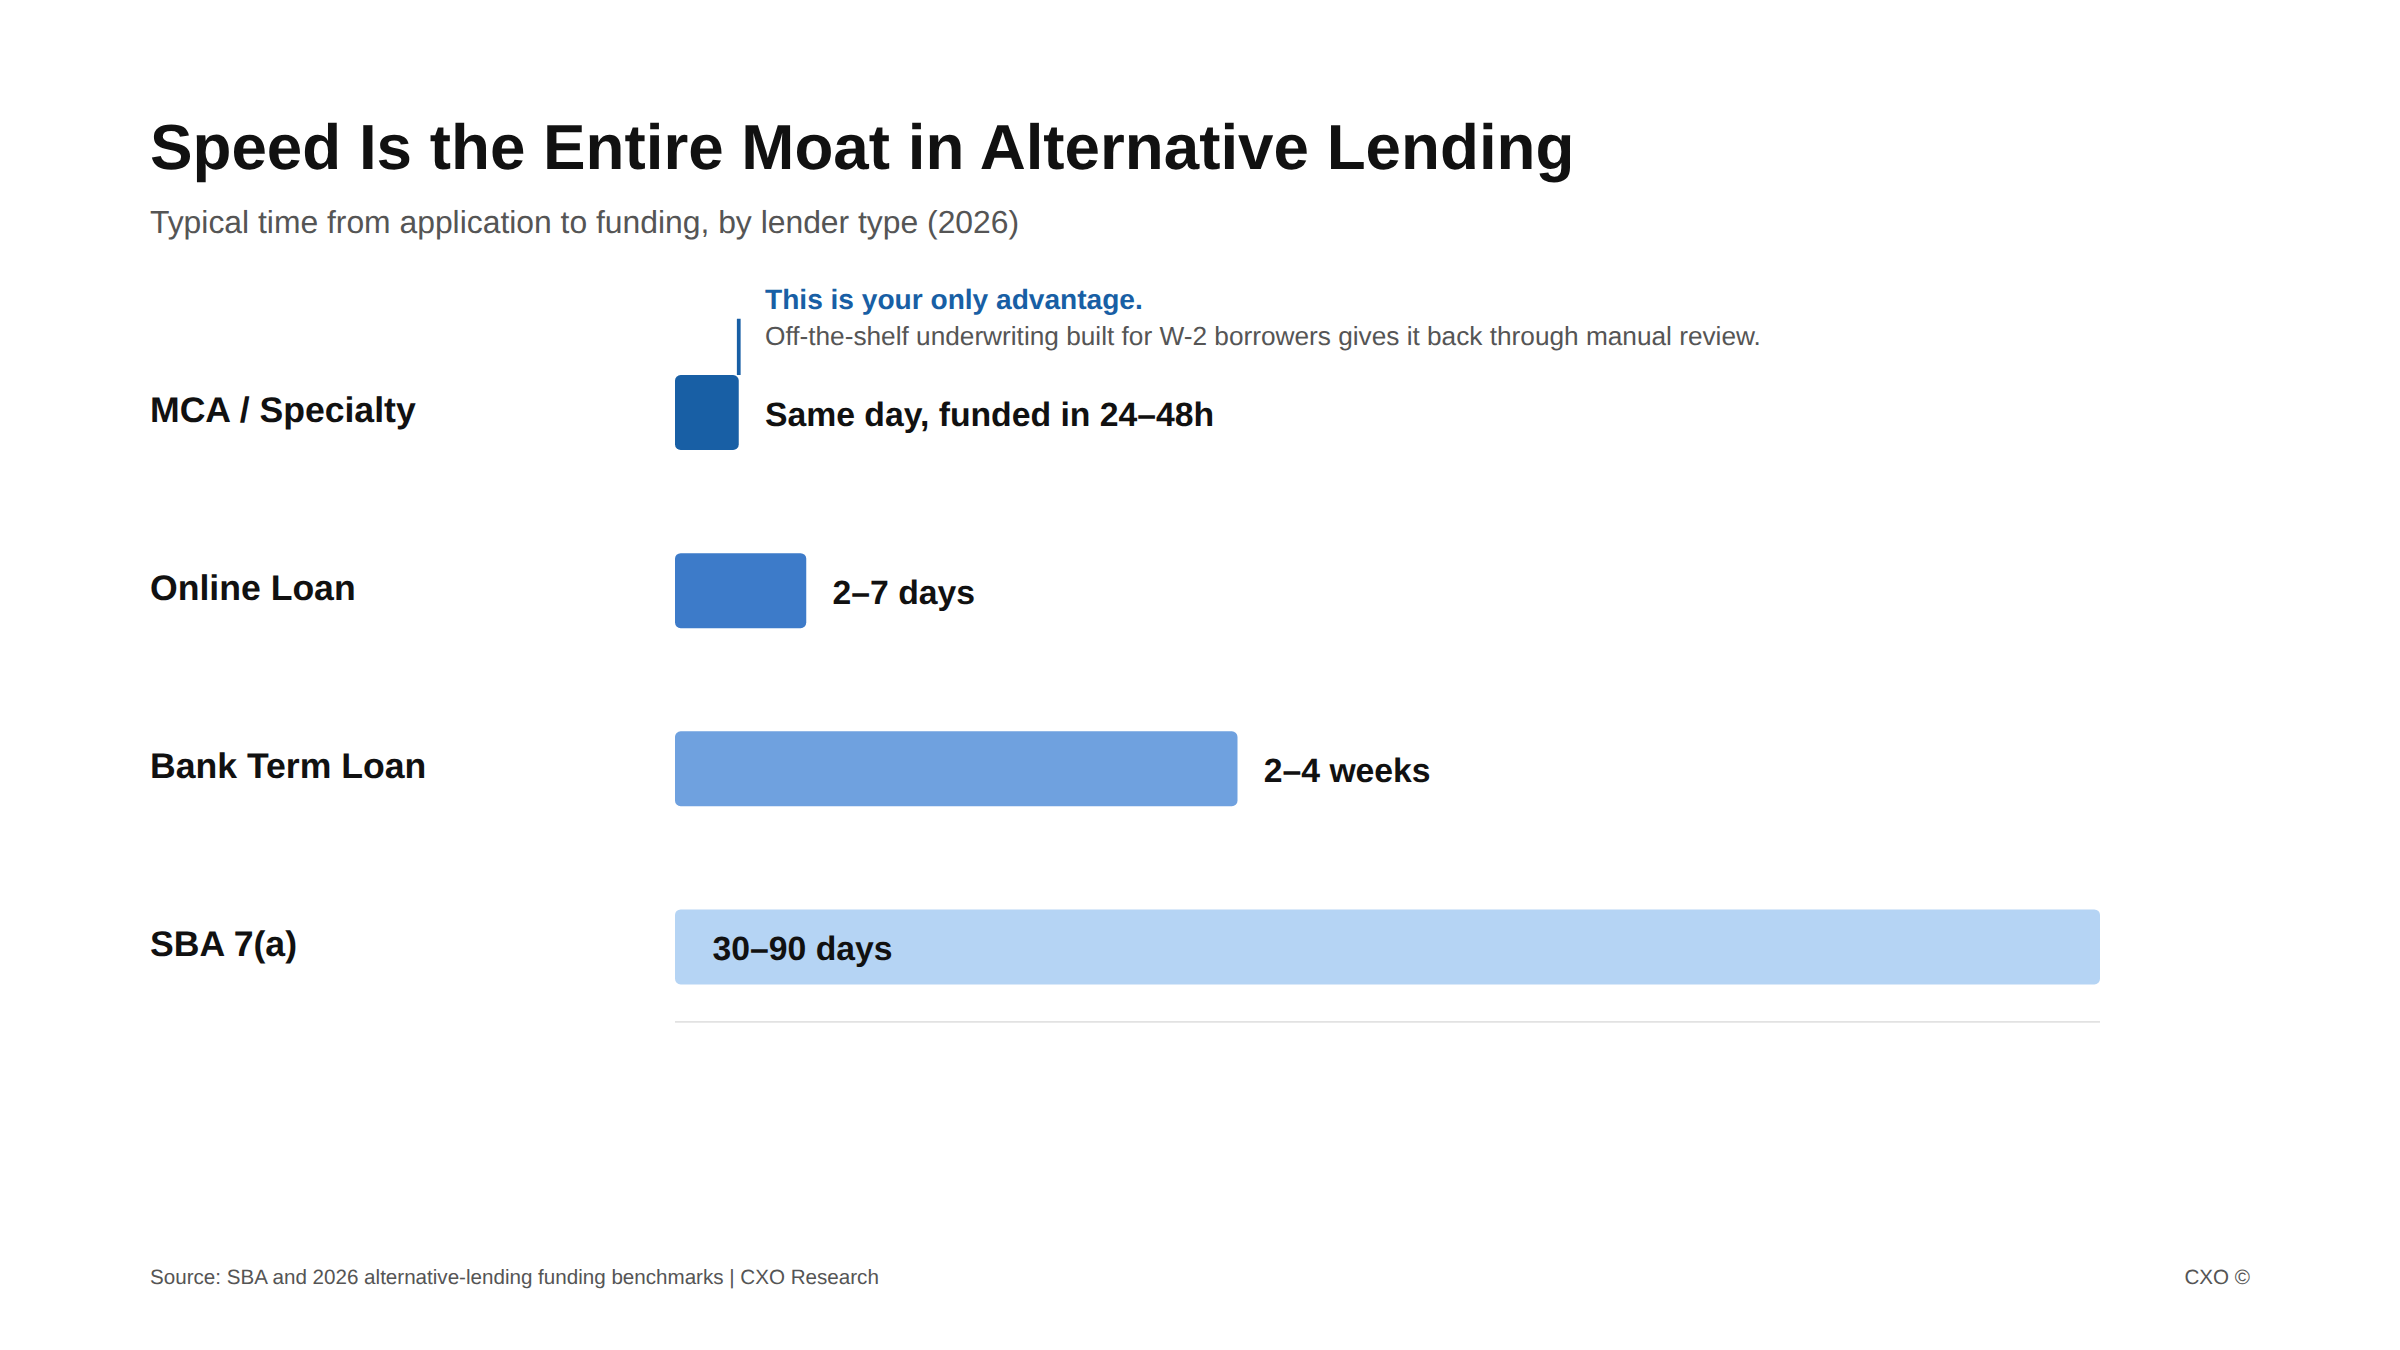
Horizontal bar chart comparing time to funding by lender type, showing MCA same-day funding against bank and SBA timelines of weeks to months

Off-the-Shelf Underwriting Was Built for W-2 Borrowers. You Don't Lend to Them.

Off-the-shelf underwriting was built for W-2 borrowers, not the cash-flow businesses alternative lenders fund. Here is where it leaks deals and how to fix it.
View Insight

Ready to put agentic AI to work?

See where automation can take the manual, repetitive work off your team. Book a discovery call and we'll map the highest-impact processes in your operation.

Book a discovery call