Category

Collections & AR

14 insights · page 1 of 2

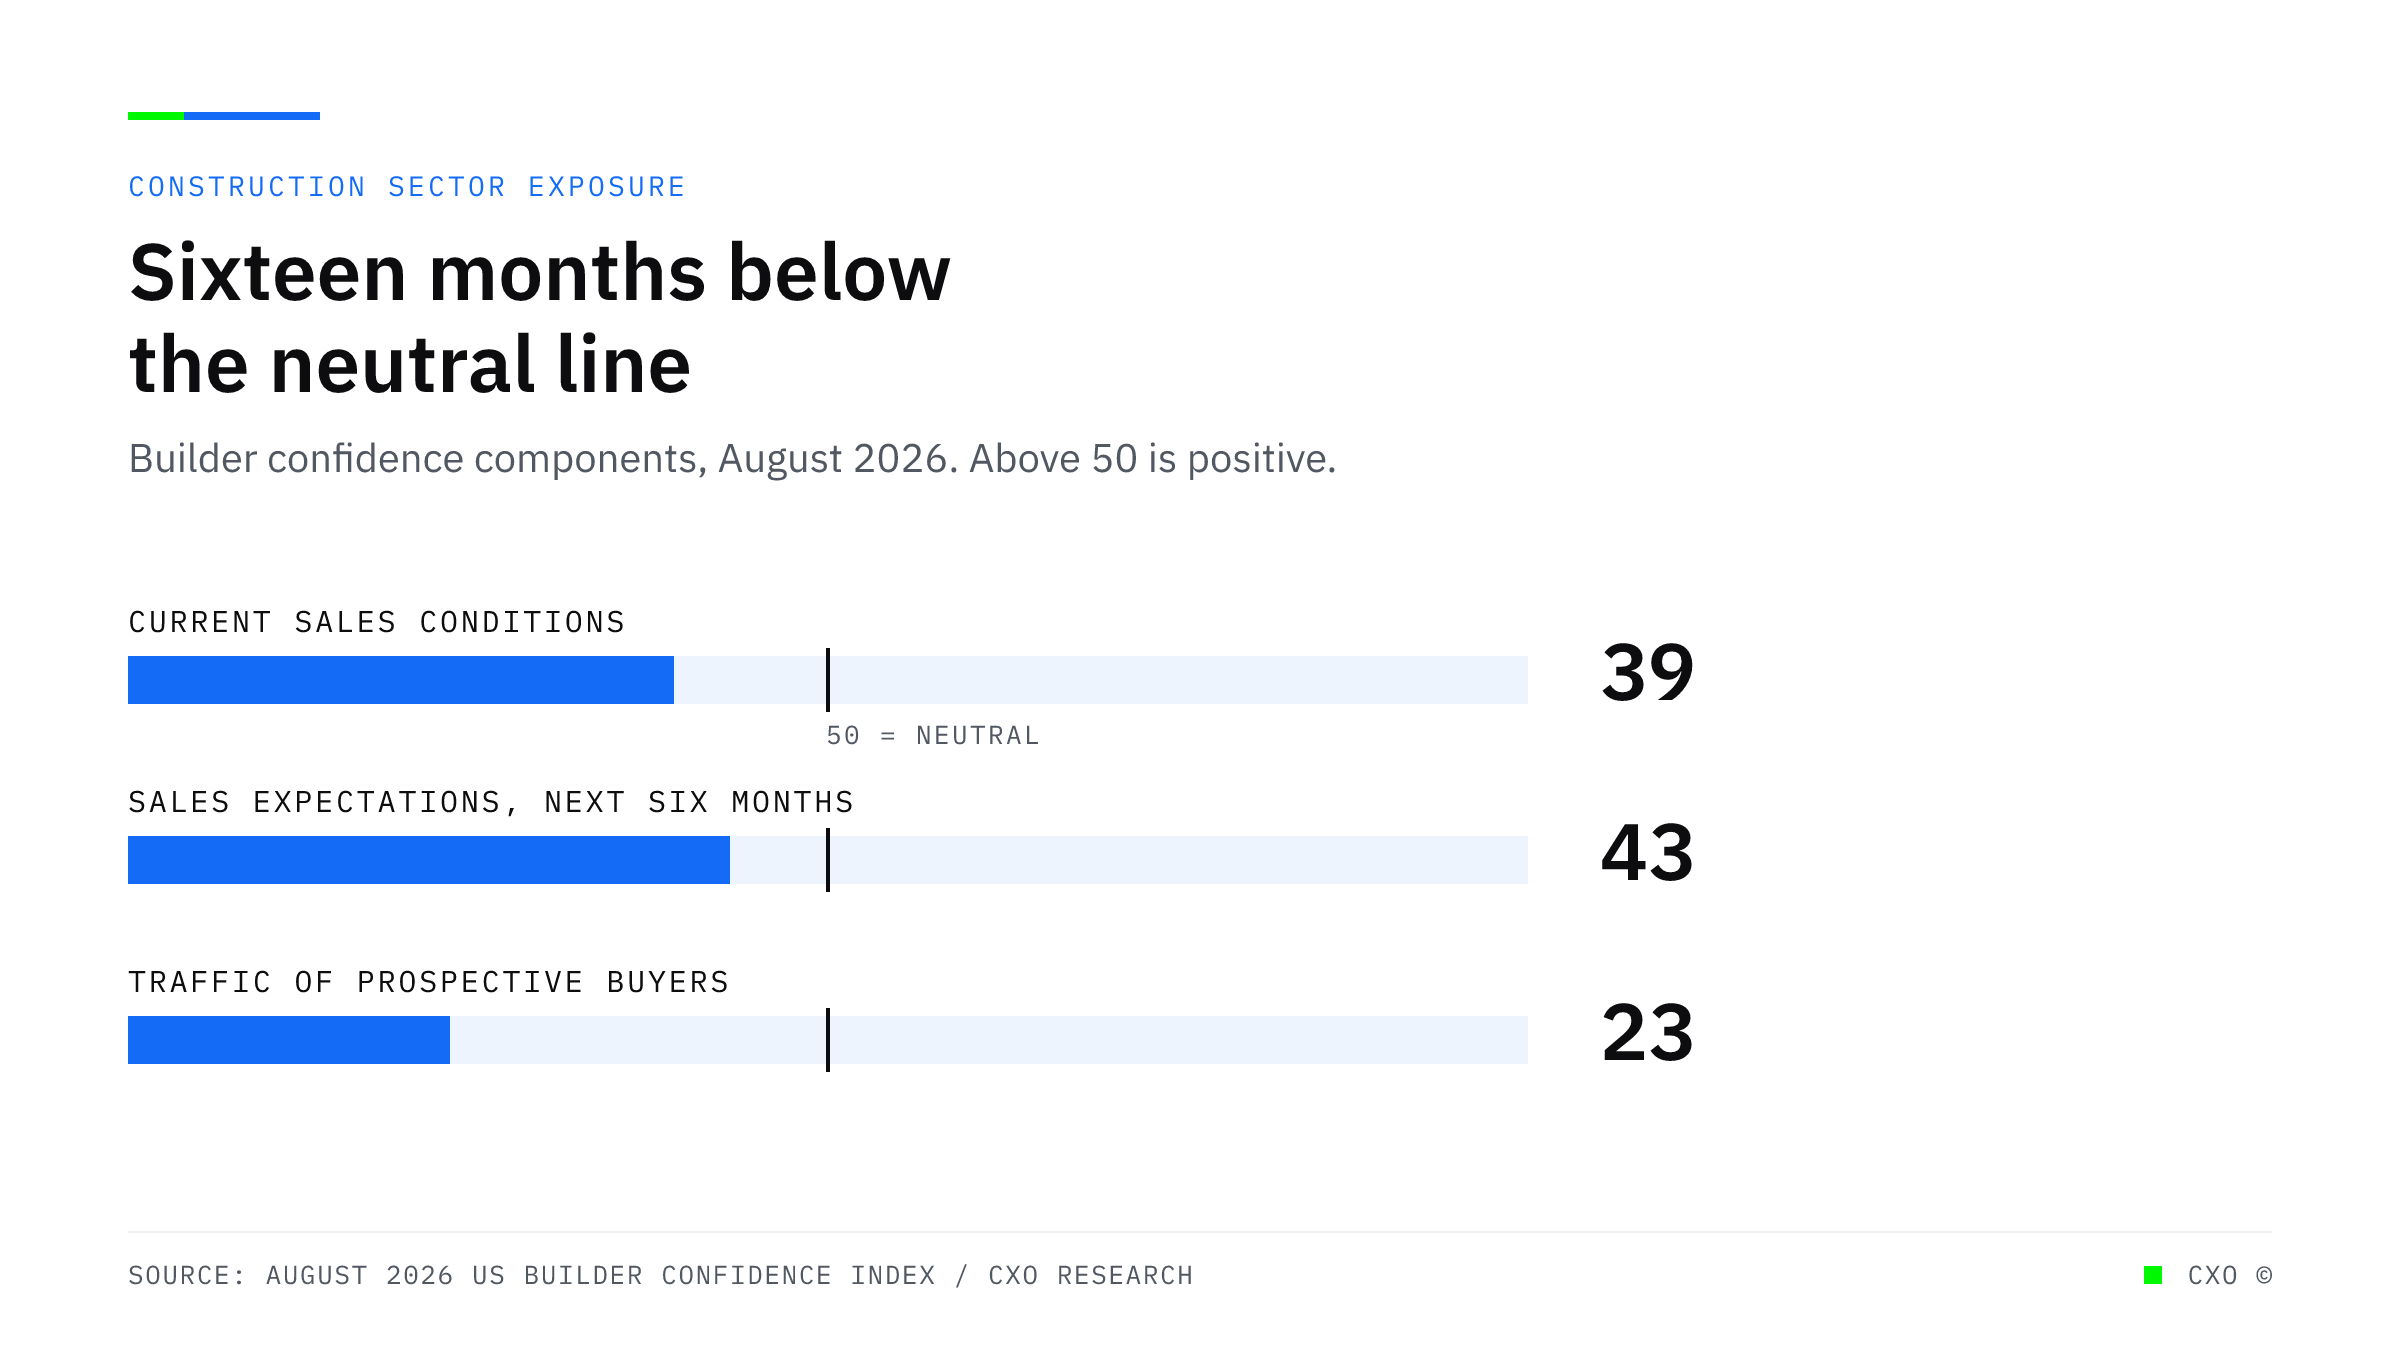
Three bullet bars showing builder confidence components against the neutral reading of 50: current sales conditions at 39, sales expectations at 43, and prospective buyer traffic at 23.

Housing Starts Fell 12.4 Percent. That Reaches a Lending Book Through Files That Look Unrelated.

July housing starts fell 12.4 percent on the month and 13.5 percent on the year, with builder confidence at 35 for a sixteenth straight month. Sector exposure arrives as many separate problems.
View Insight
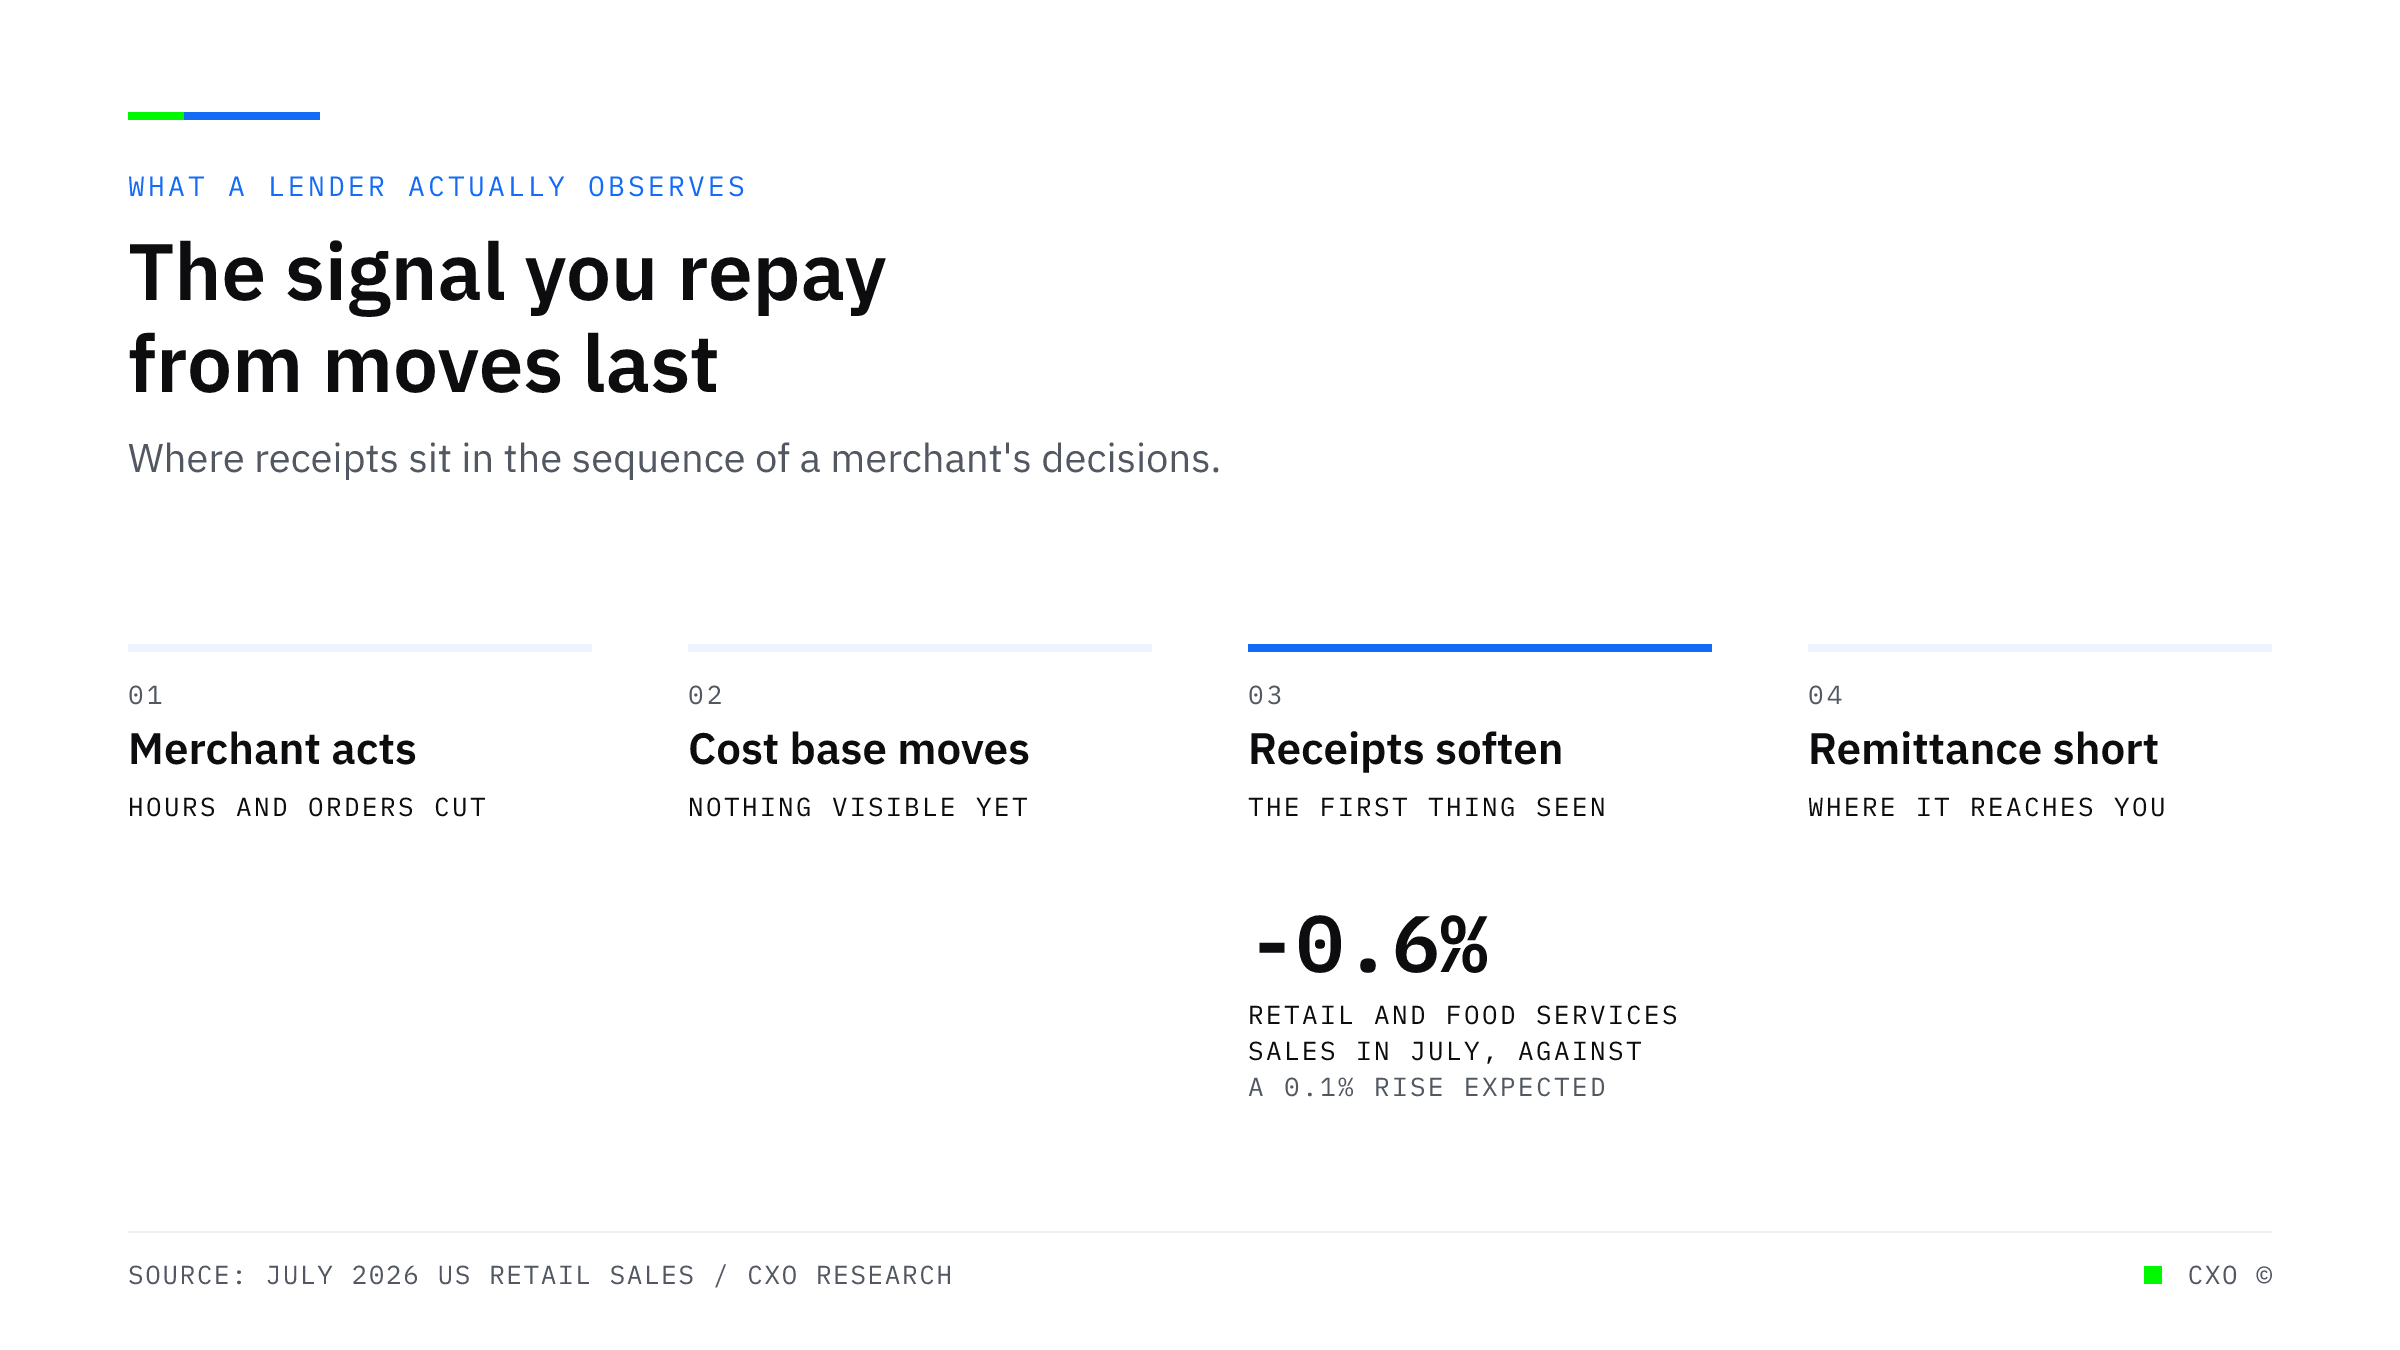
A labelled diagram of four stages showing that a merchant cuts hours and delays orders before anything changes in receipts, that July retail and food services sales fell 0.6 percent against an expected rise, and that remittance performance is where a lender finally sees it.

The Signal You Repay From Is the Last One to Move

July retail sales fell 0.6 percent against an expected rise, and categories ranged from minus 2.2 to plus 1.9 in the same month. Receipts are both the slowest signal a lender has and the least specific.
View Insight
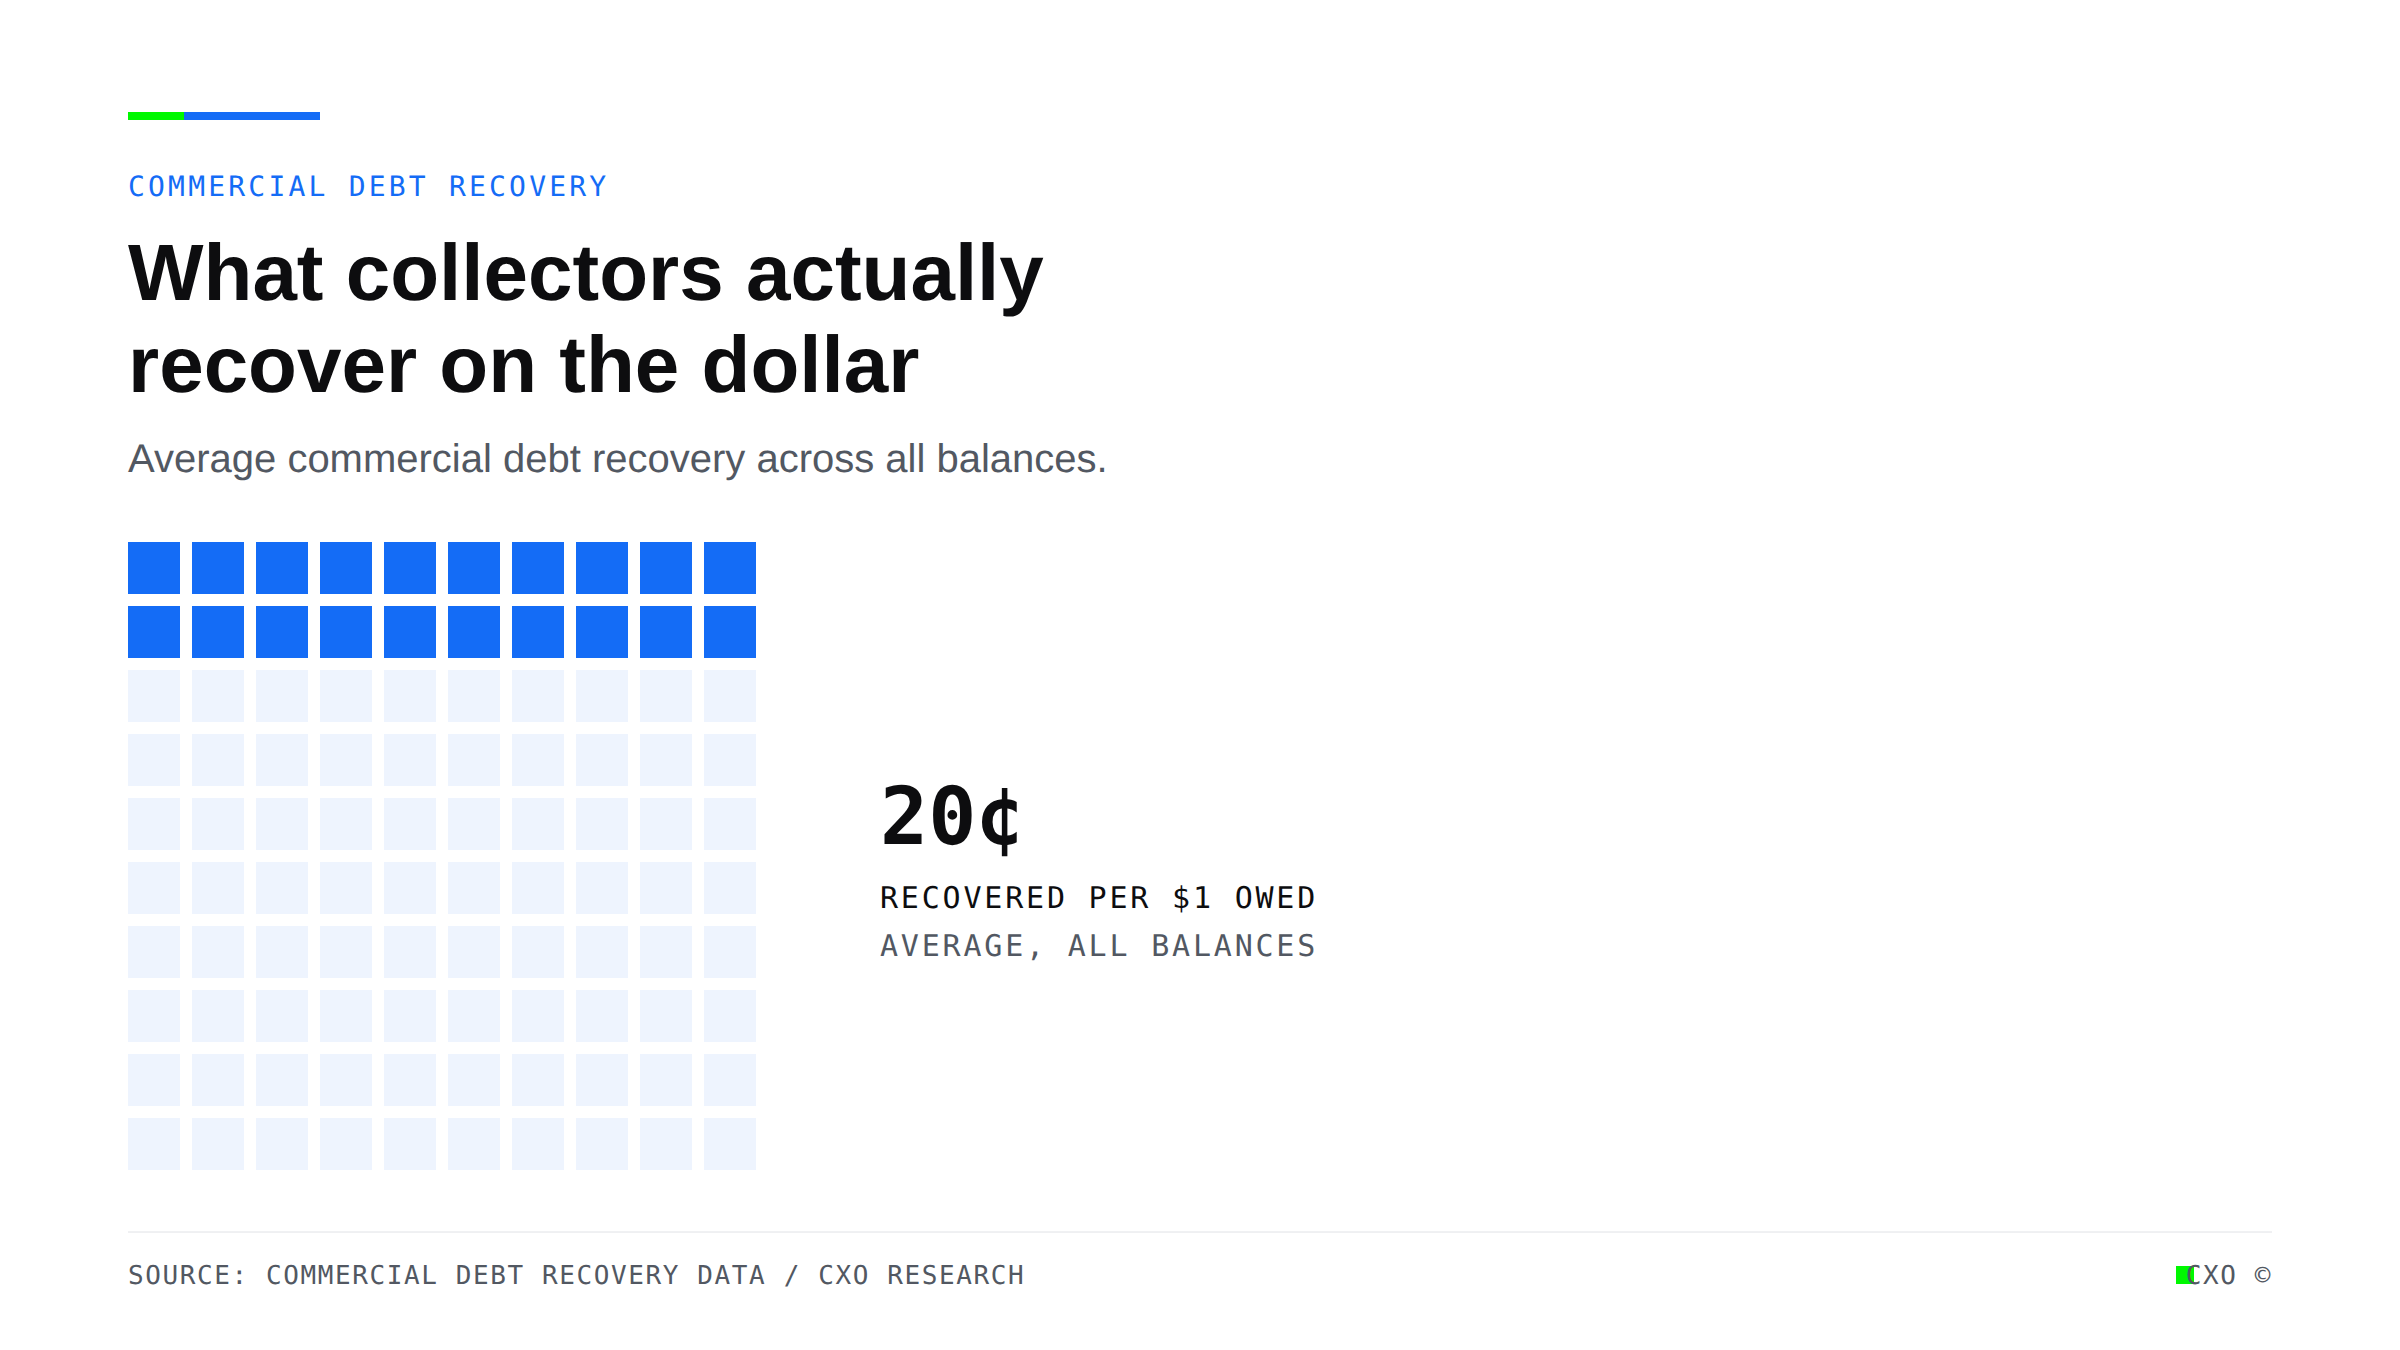
A grid of 100 squares with 20 filled in blue, showing that commercial debt collectors recover about twenty cents on the dollar owed.

Every MCA Collections Contact Is Now a Compliance Record

Federal small-business lending data rules and roughly ten state disclosure laws have turned documented, consistent MCA collections into a compliance requirement, not just a recovery tactic.
View Insight
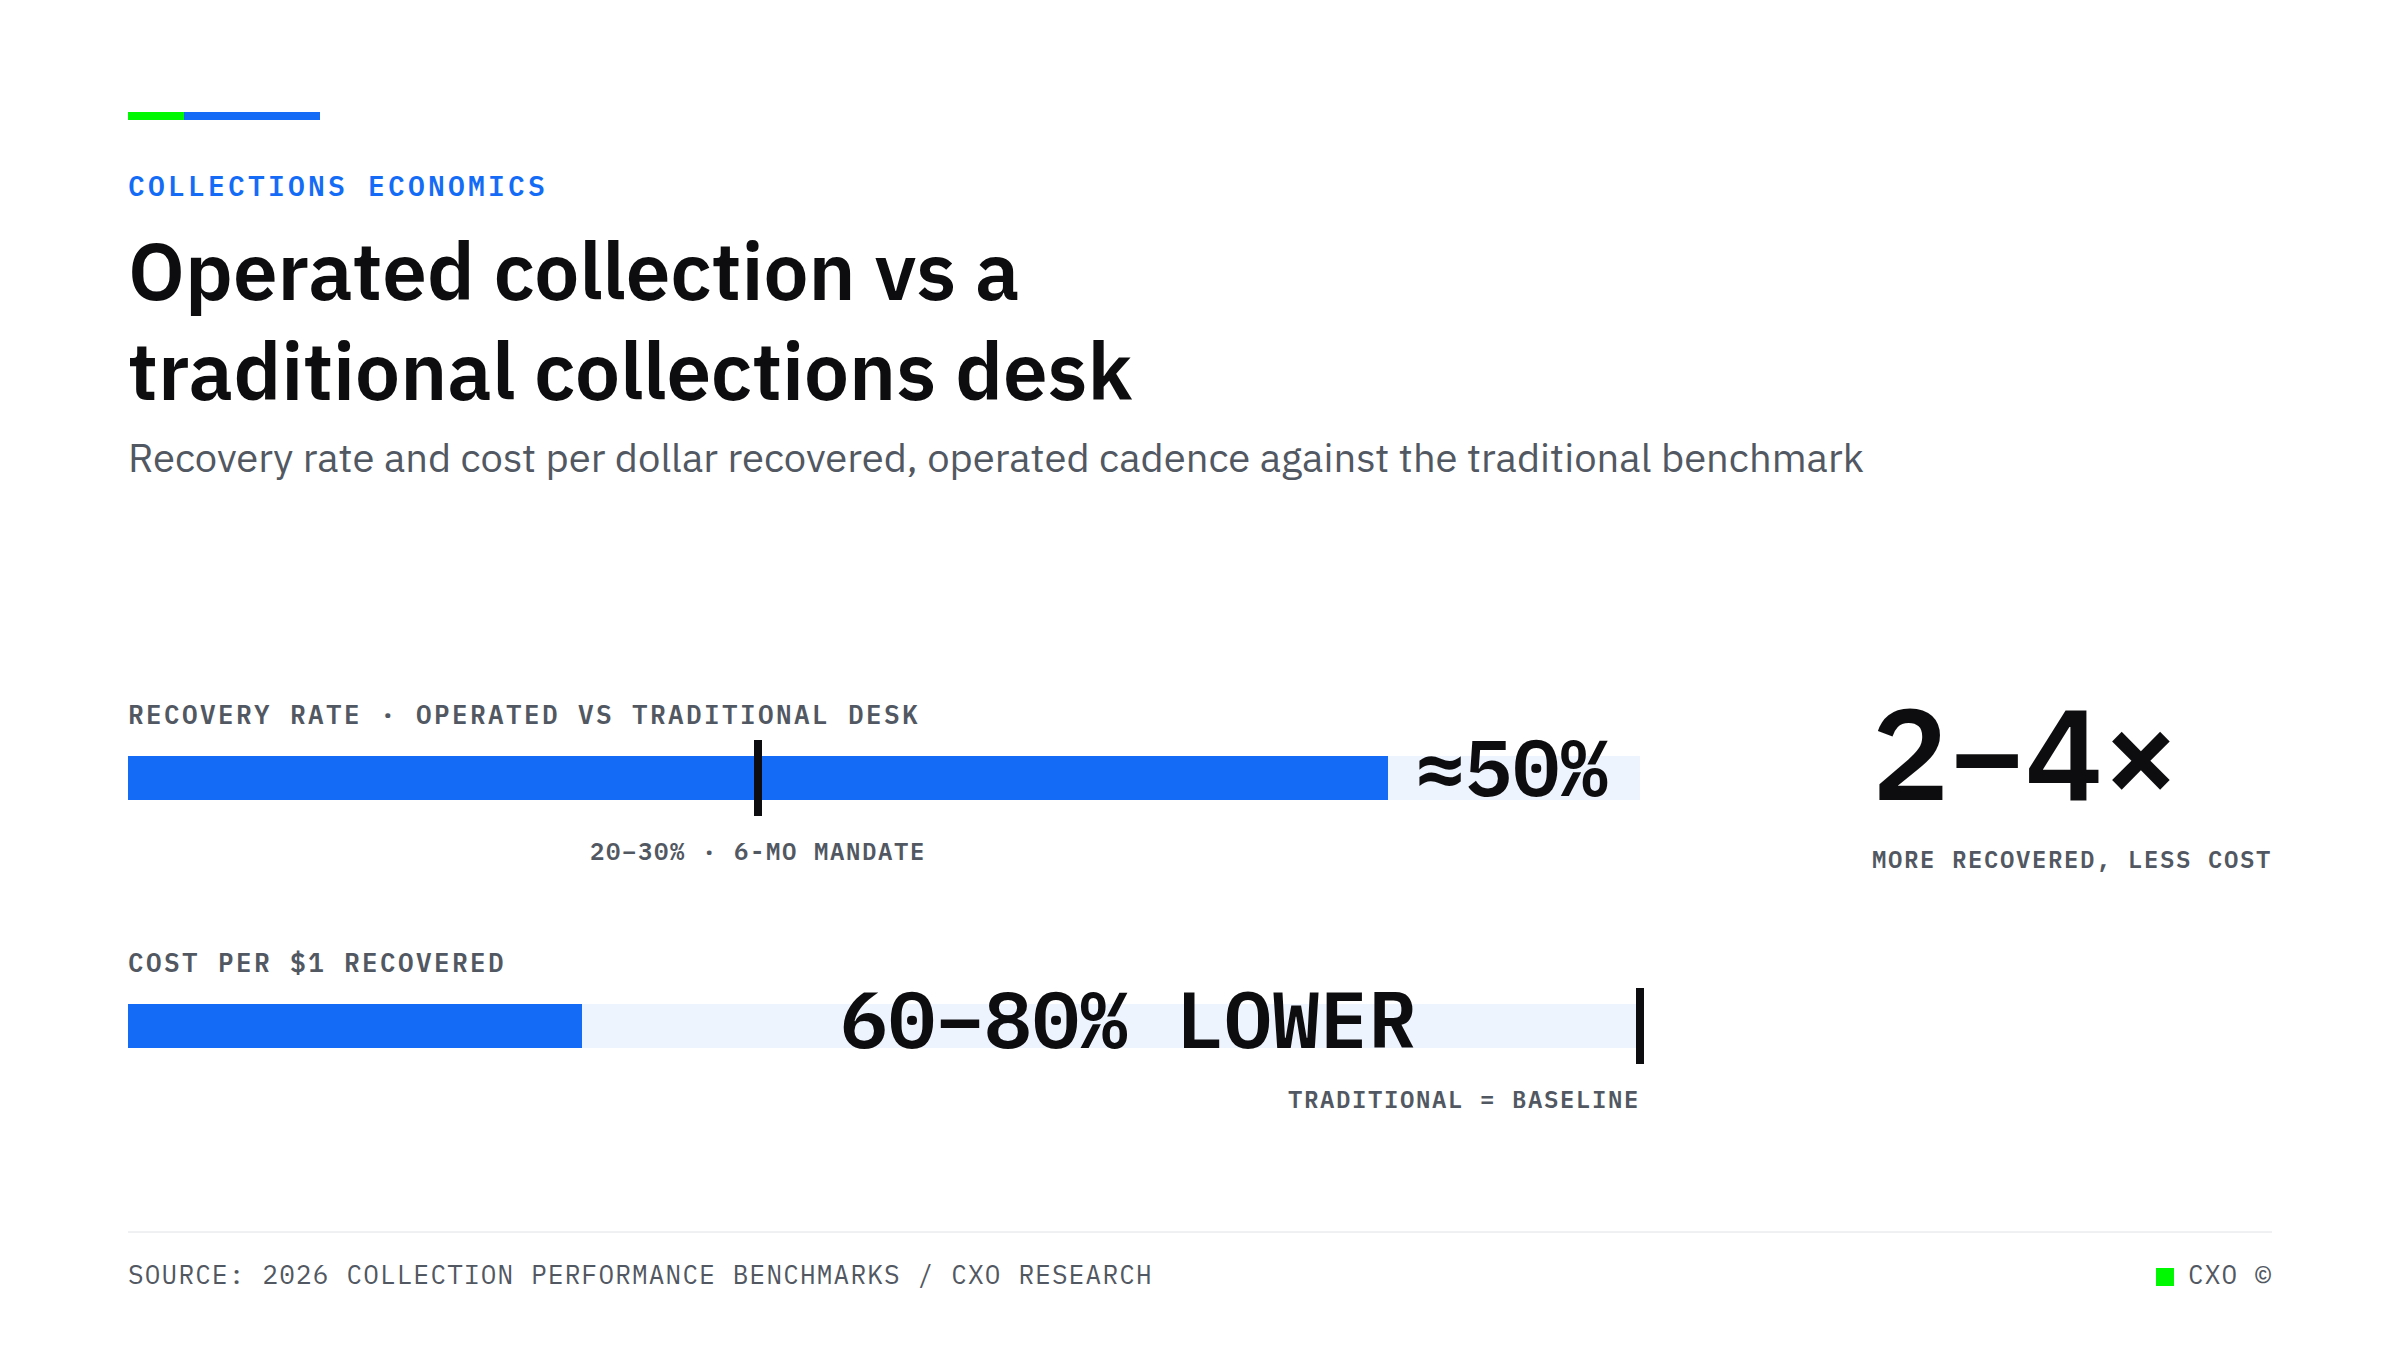
Bullet-chart cover comparing operated collection to a traditional desk: operated recovers about 50% against a 20 to 30% traditional benchmark, at 60 to 80% lower cost per dollar recovered, roughly 2 to 4 times the recovery.

The Collections Desk That Scaled With the Book Was the Wrong One

Two lenders, one book size, two collections cost structures. Why a manual desk scales with headcount while an operated cadence holds cost flat as the book grows.
View Insight
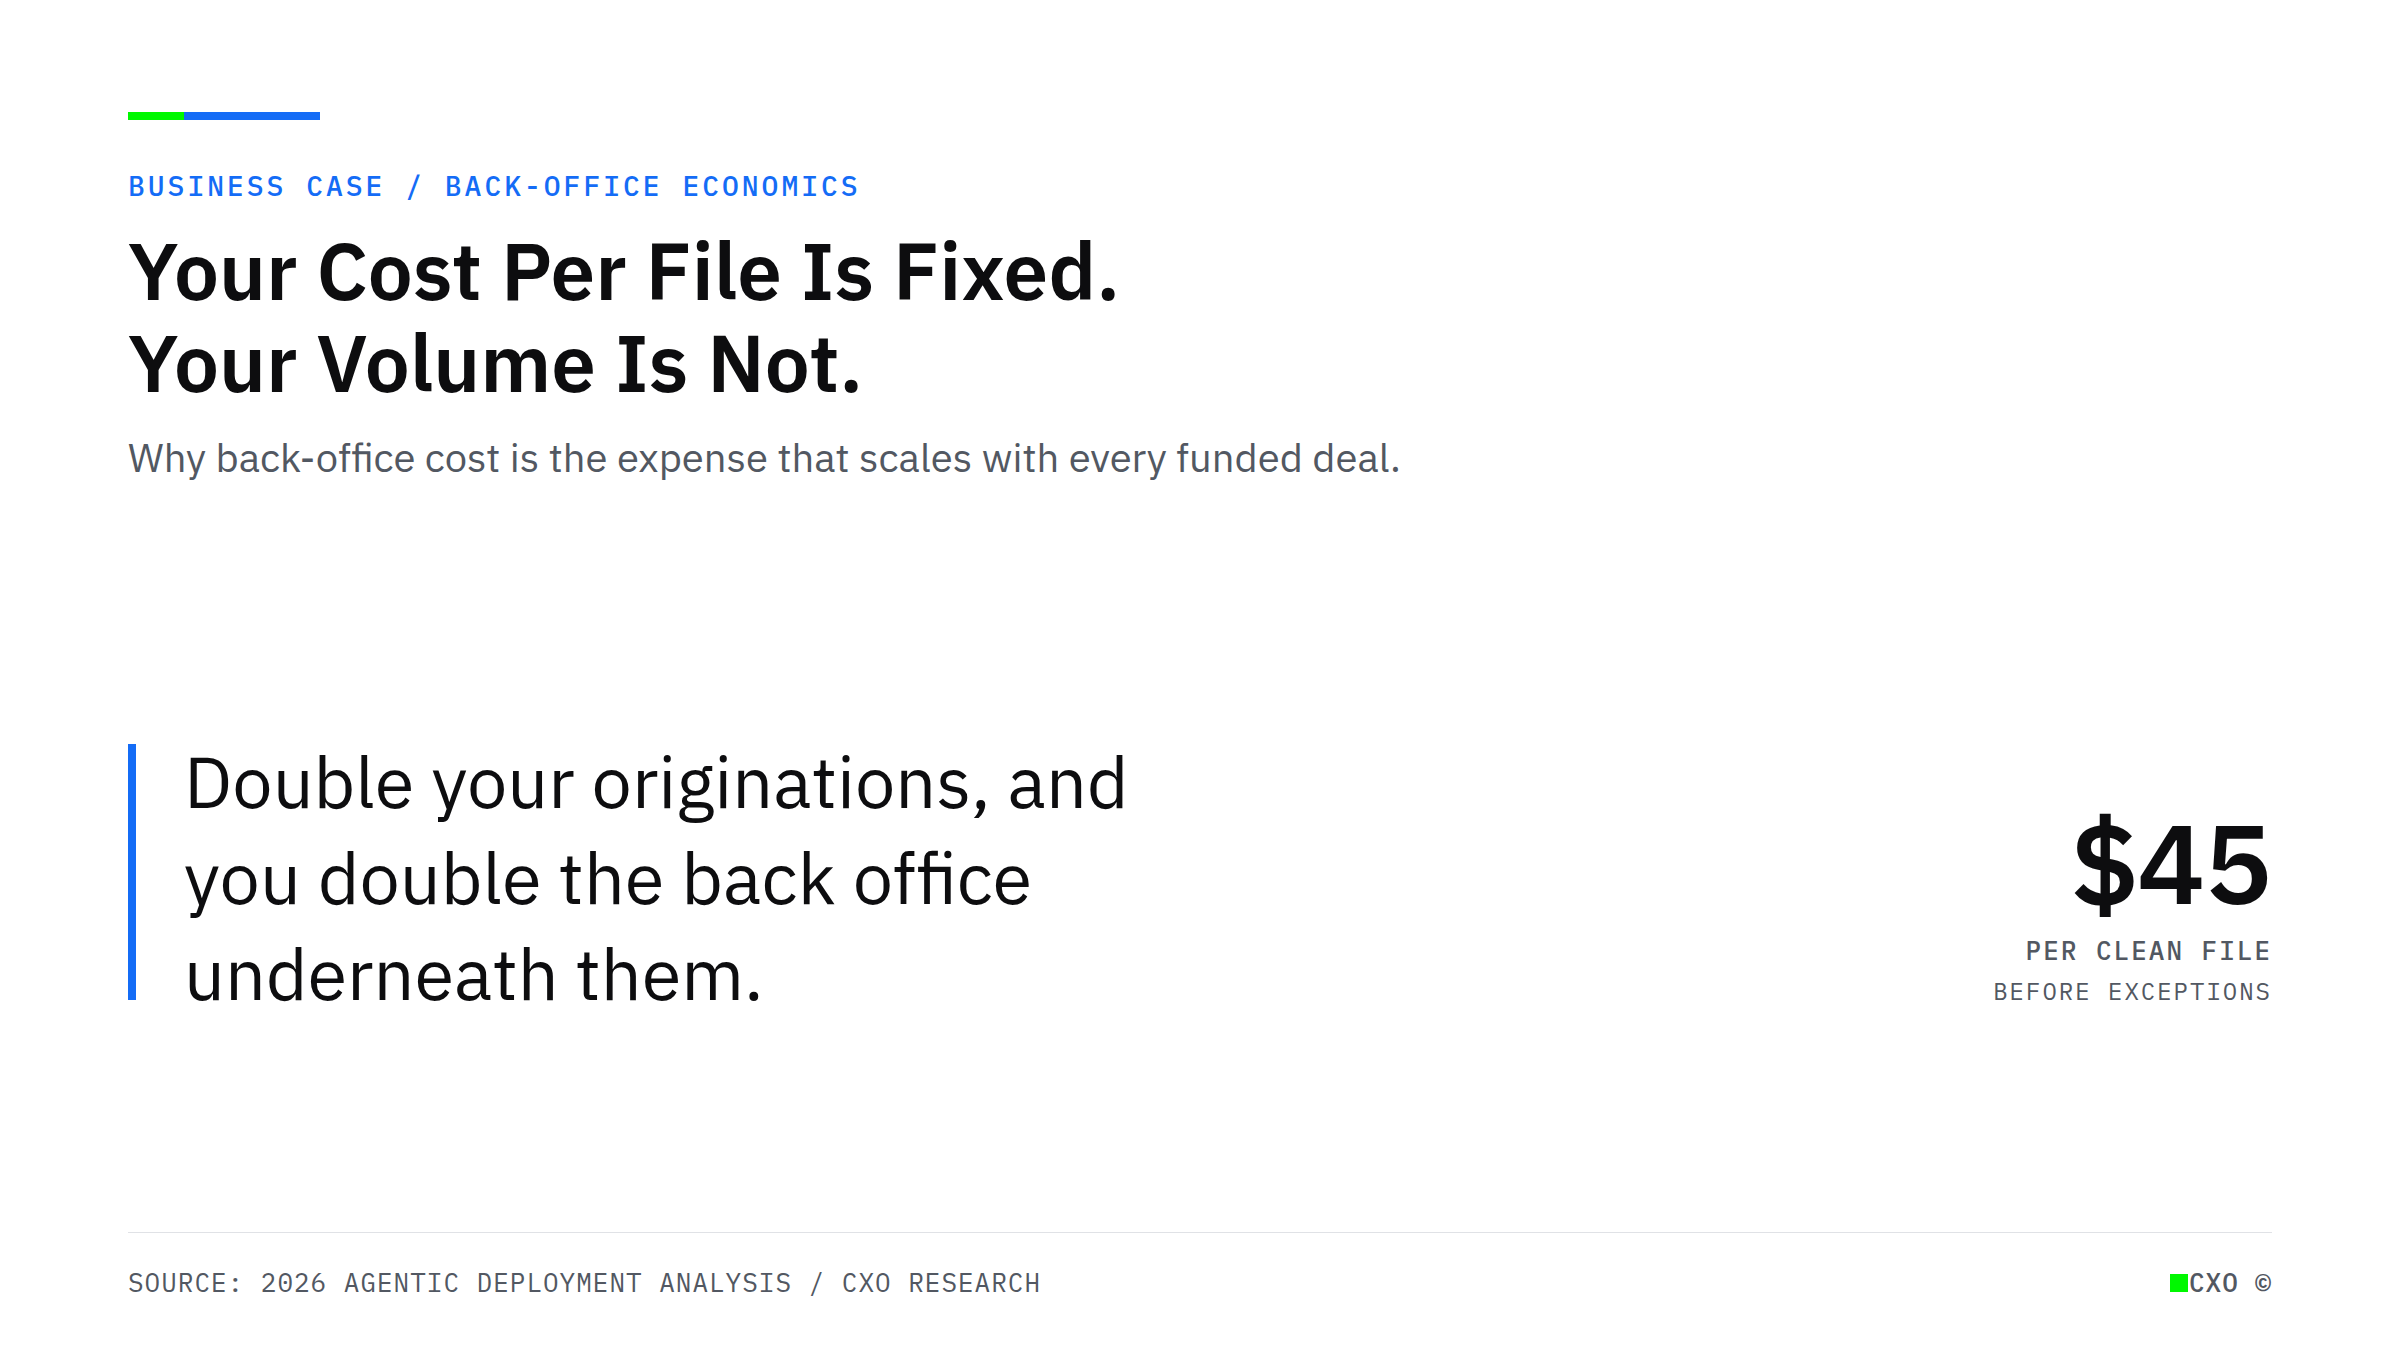
Editorial pull-quote cover reading "Double your originations, and you double the back office underneath them," annotated with roughly $45 per clean file before exceptions

Your Cost Per File Is Fixed. Your Volume Is Not. That Is Where Growth Gets Expensive.

Back-office cost is the one expense that scales in lockstep with loan volume. At roughly $45 a clean file, growth quietly doubles it. Here is how alternative lenders break the link between volume and headcount.
View Insight
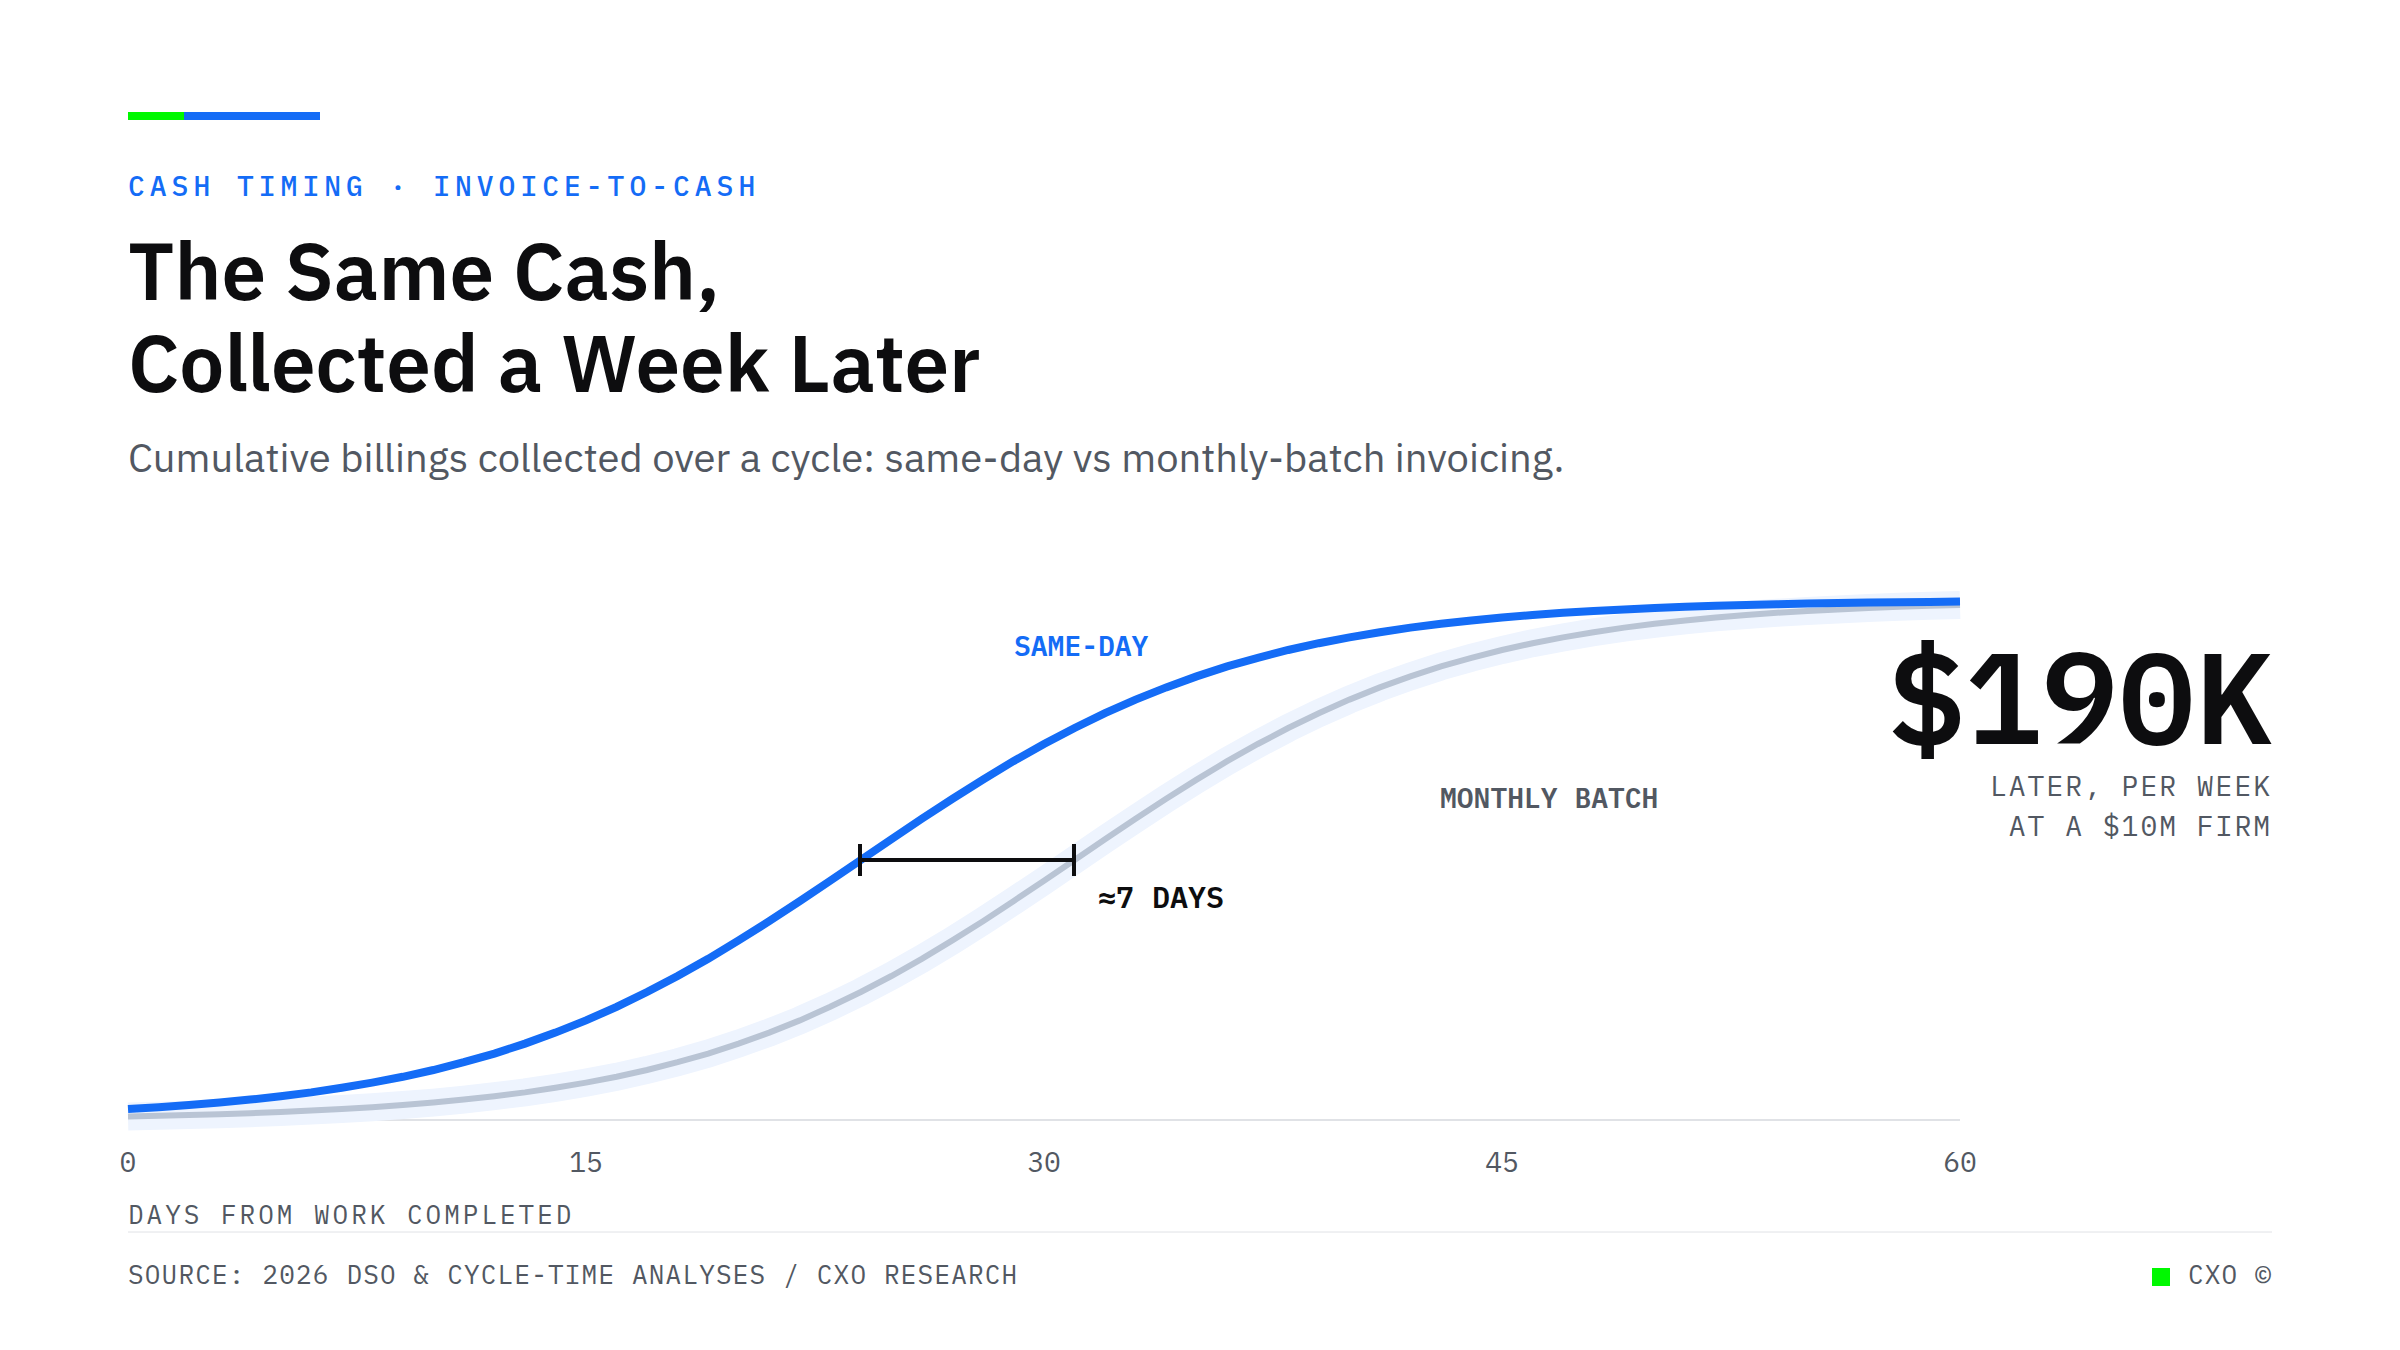
Line chart titled The Same Cash, Collected a Week Later, comparing cumulative billings collected under same-day versus monthly-batch invoicing over a 60-day cycle; the same-day curve leads the monthly-batch curve by about 7 days, a timing gap worth roughly $190,000 of cash arriving later per week at a $10M firm.

Most Collection Delay Happens Before You Send a Single Invoice

Your DSO clock starts when work is earned, not when you invoice. Batch billing builds a week of lost cash into every cycle. Where the leak really sits, and how to close it.
View Insight
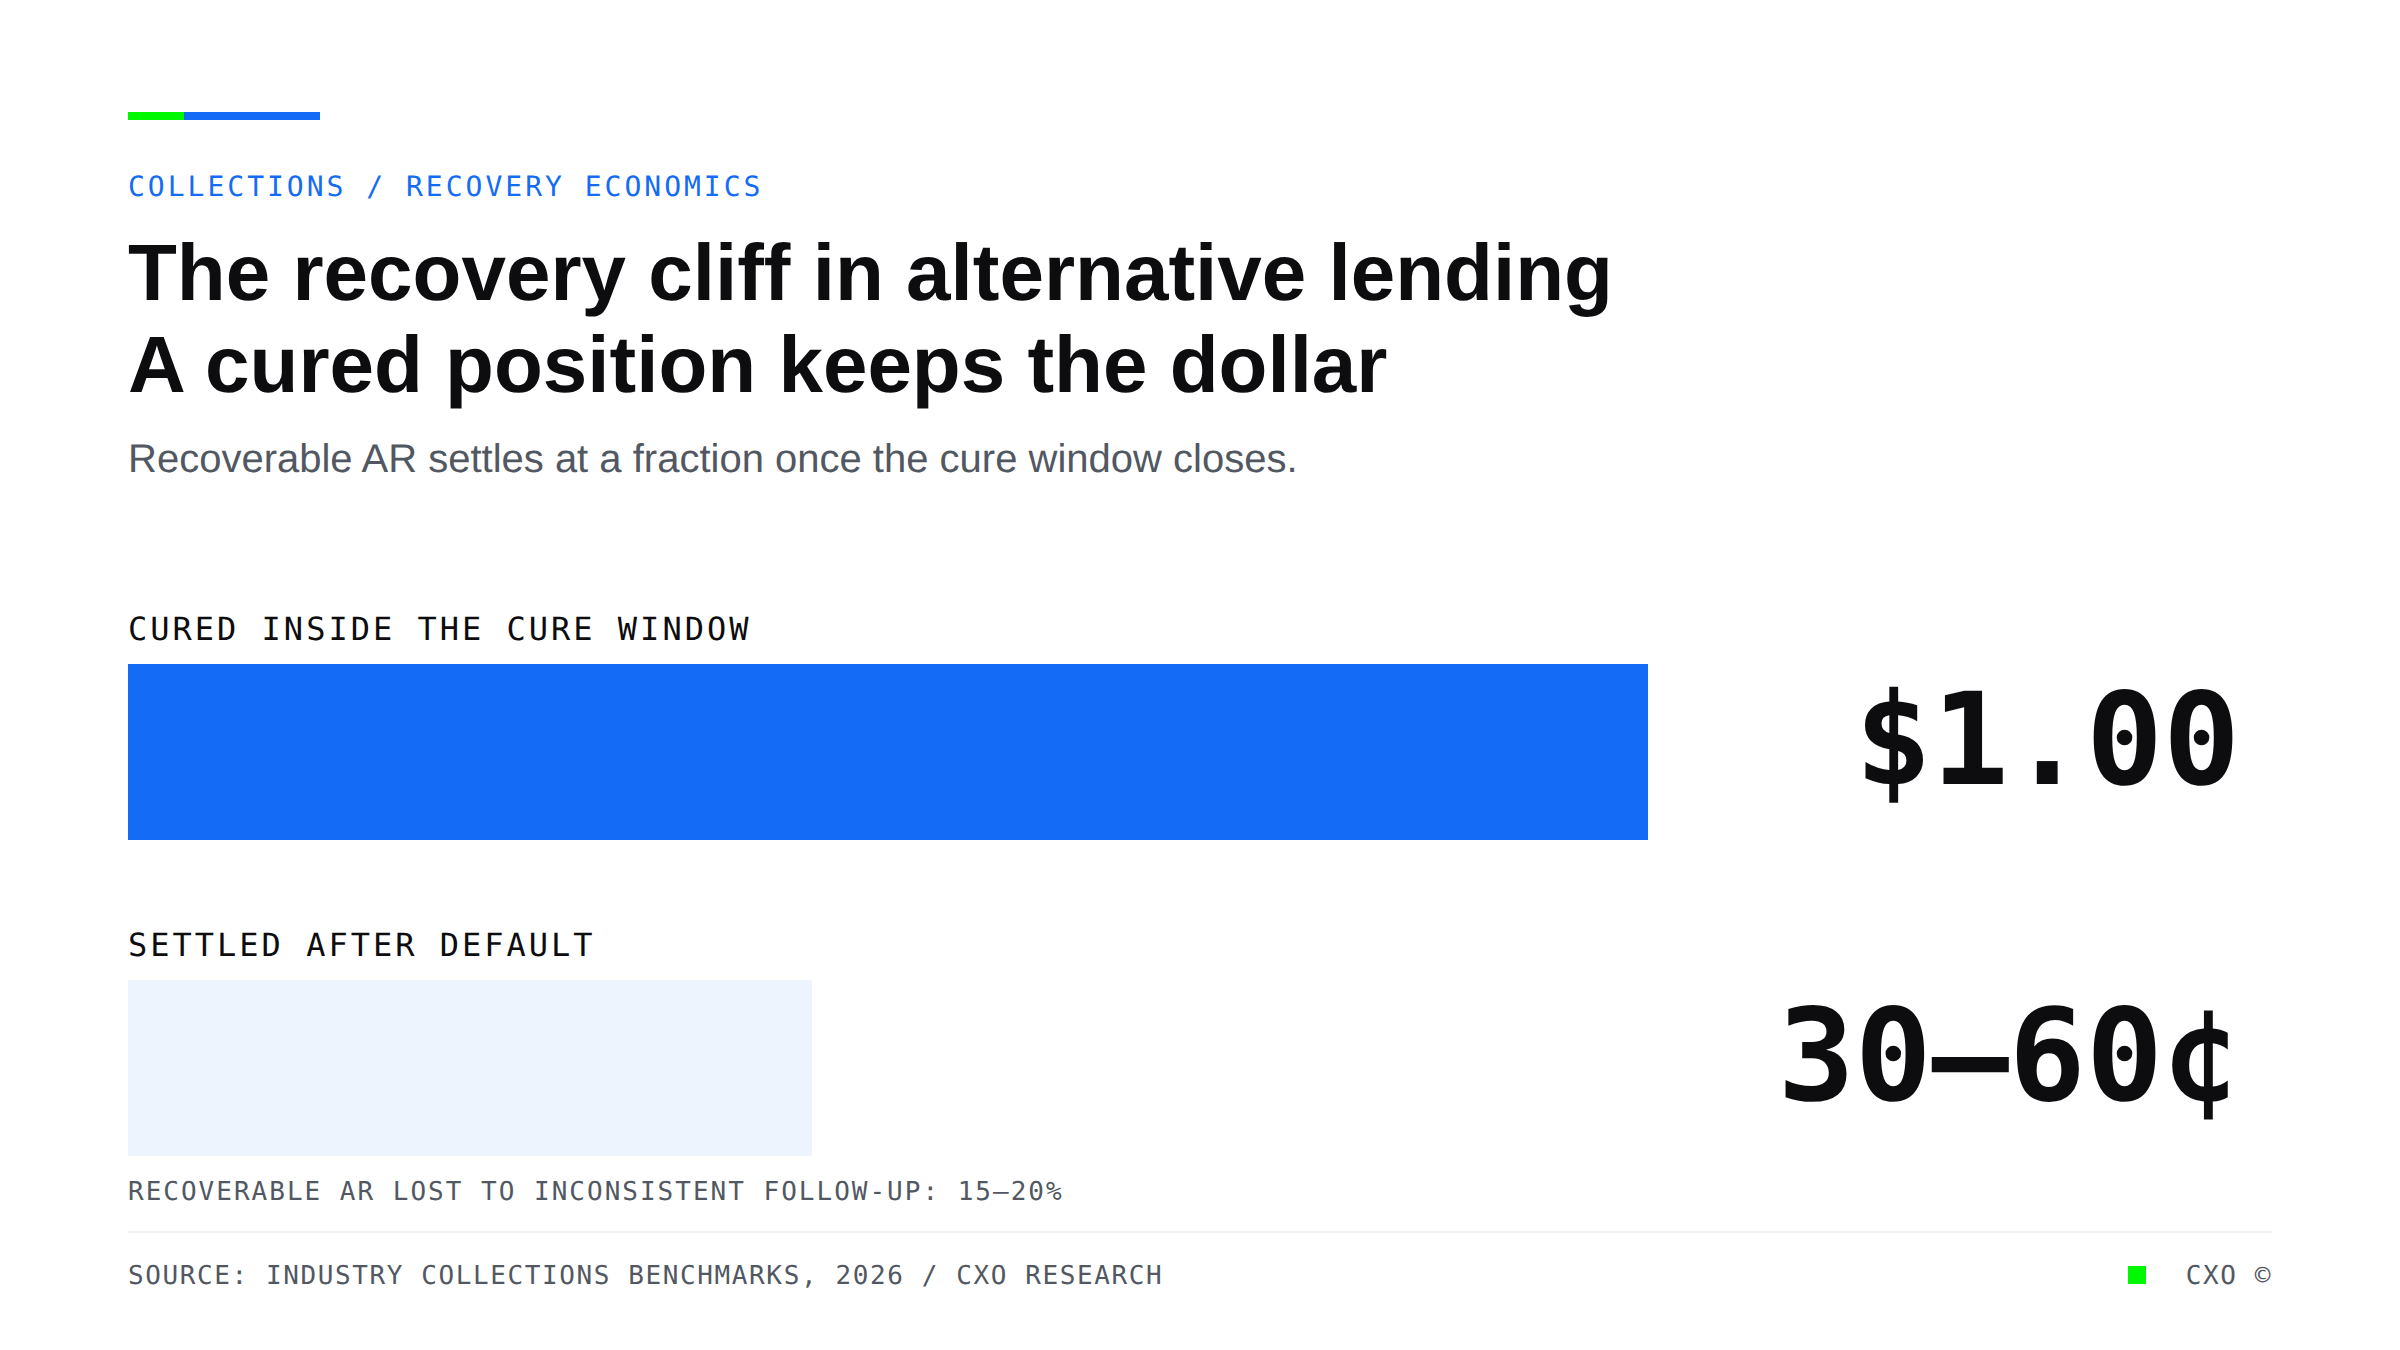
Bar comparison showing a cured alternative-lending position recovering 100 cents on the dollar versus 30 to 60 cents once it settles after default.

Your Worst Recoveries Are a Scheduling Problem, Not a Credit Problem

Alternative lenders lose 15 to 20% of recoverable AR to inconsistent follow-up, not bad credit. Why recovery is a timing problem, and how CXO closes the gap.
View Insight
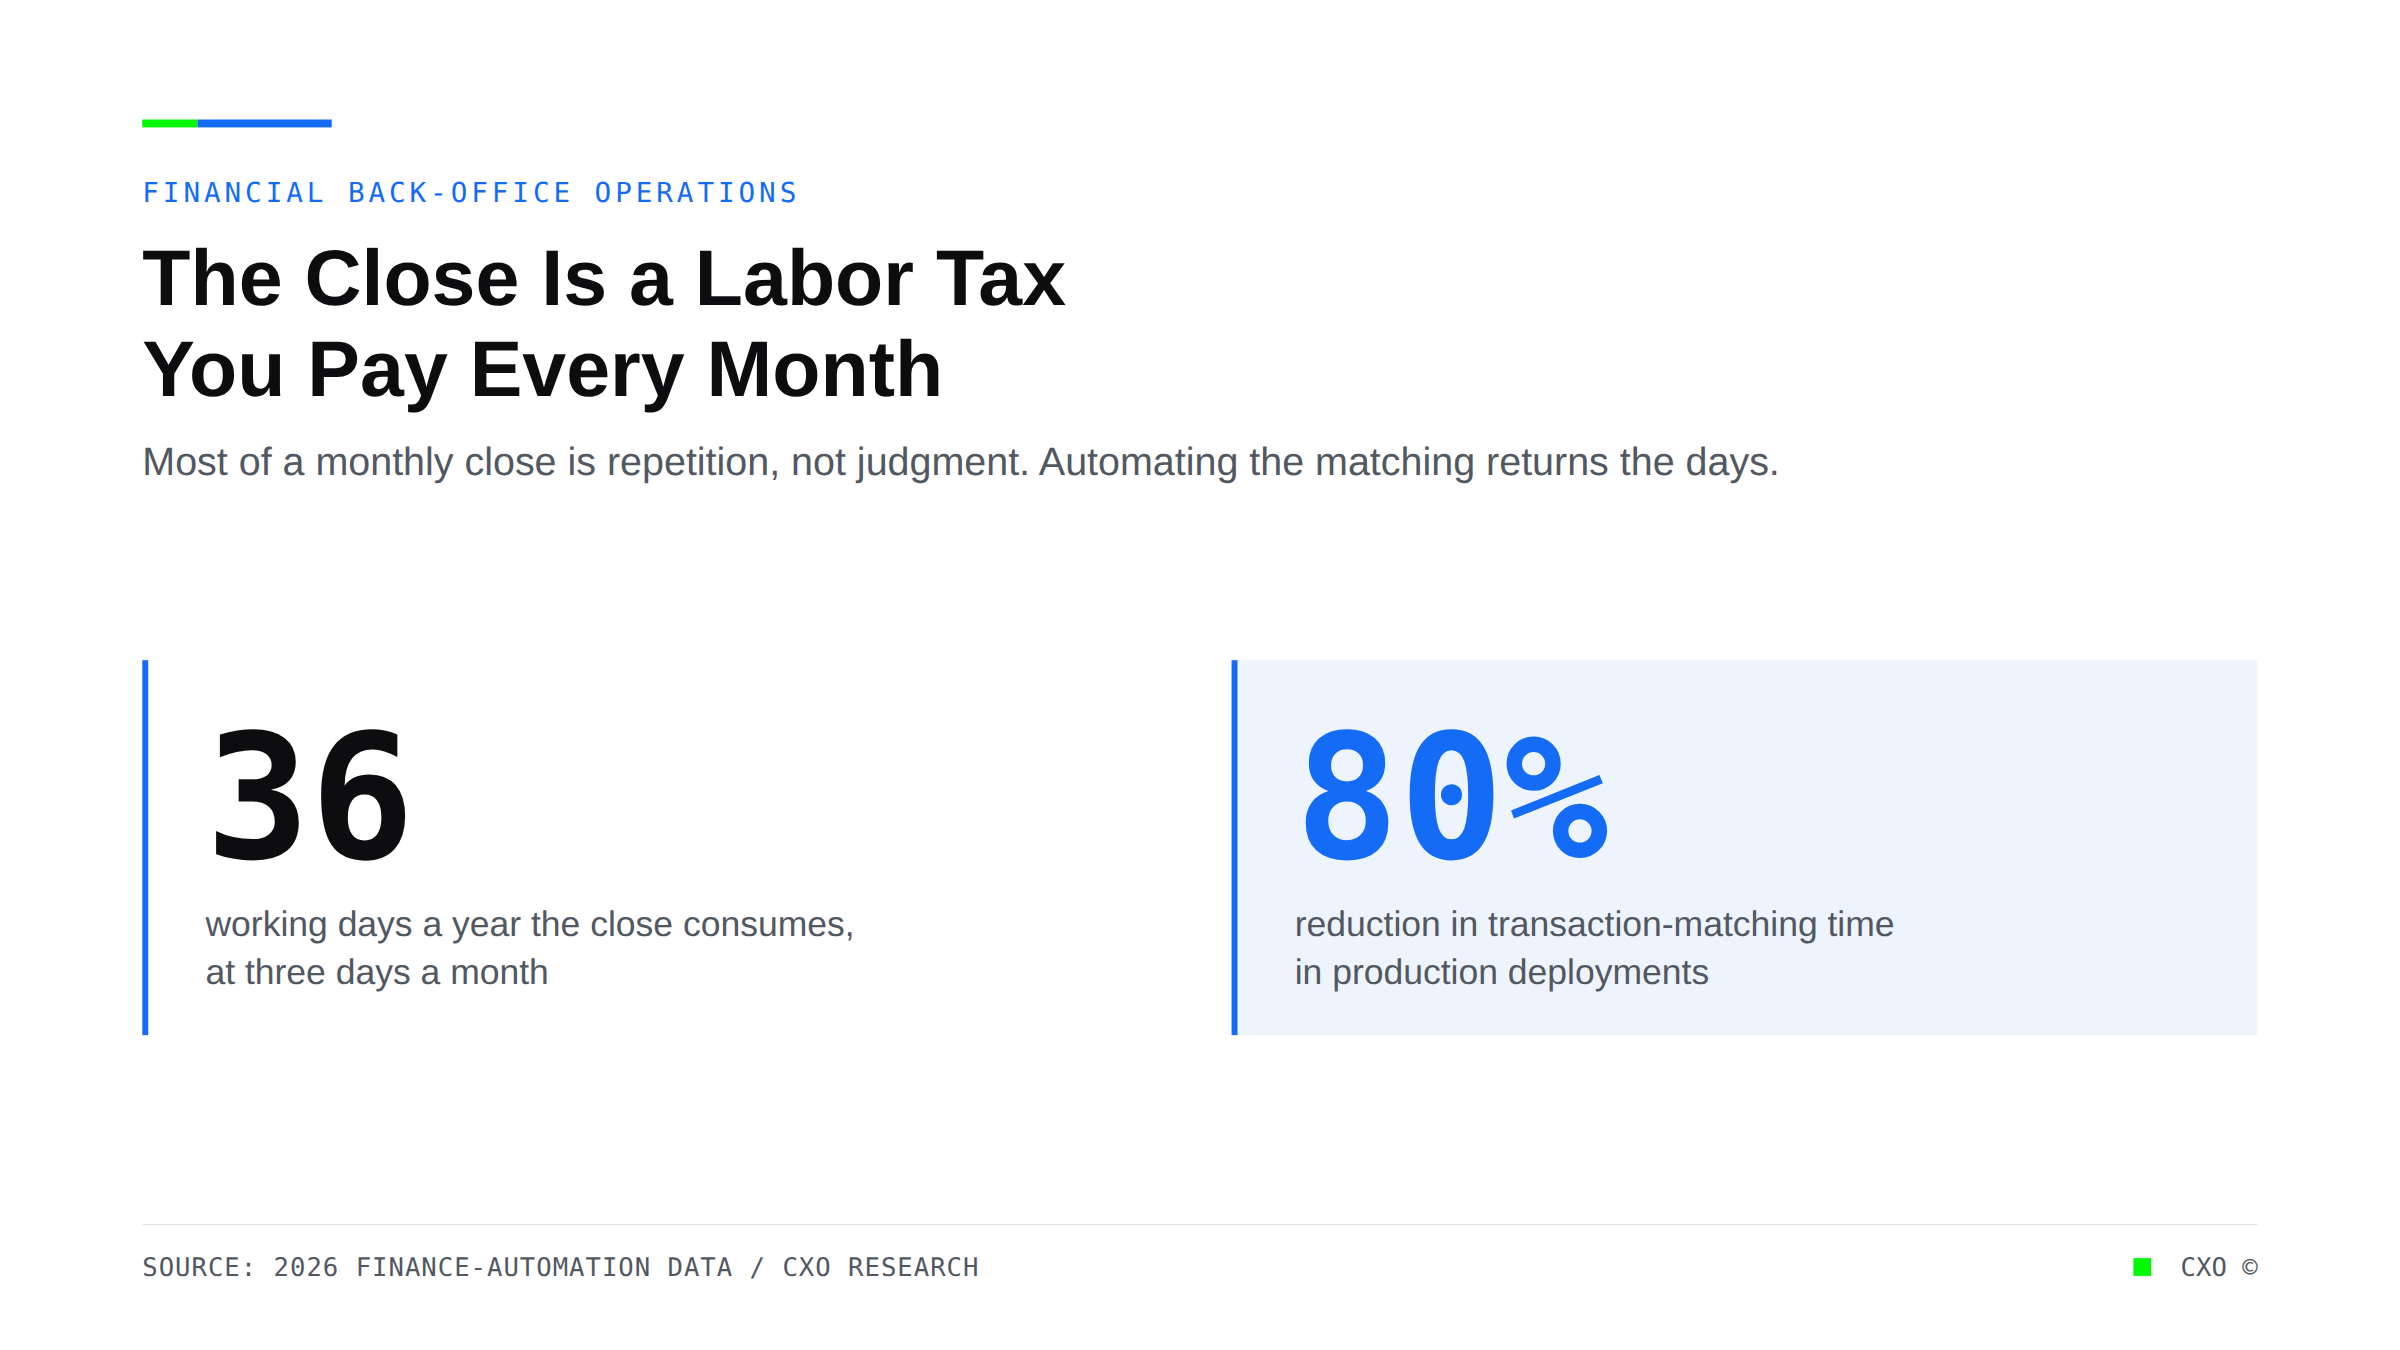
Cover graphic stating that production reconciliation deployments cut transaction-matching time by as much as 80 percent, reframing the monthly close as repetition rather than judgment for alternative lenders.

Month-End Close Is a Three-Day Tax You Pay Every Month. It Should Be Forty Minutes.

A three-day month-end close is a recurring labor tax most lenders never price. Here is where the cost leaks and what exception-based automation returns to the close.
View Insight

Start with the process that costs you most.

A conversation first. A structured assessment when it earns one. Or see what a discovery finds before you book anything.

Book a discovery call See what a discovery finds