Tag

alternative lending operations

10 insights

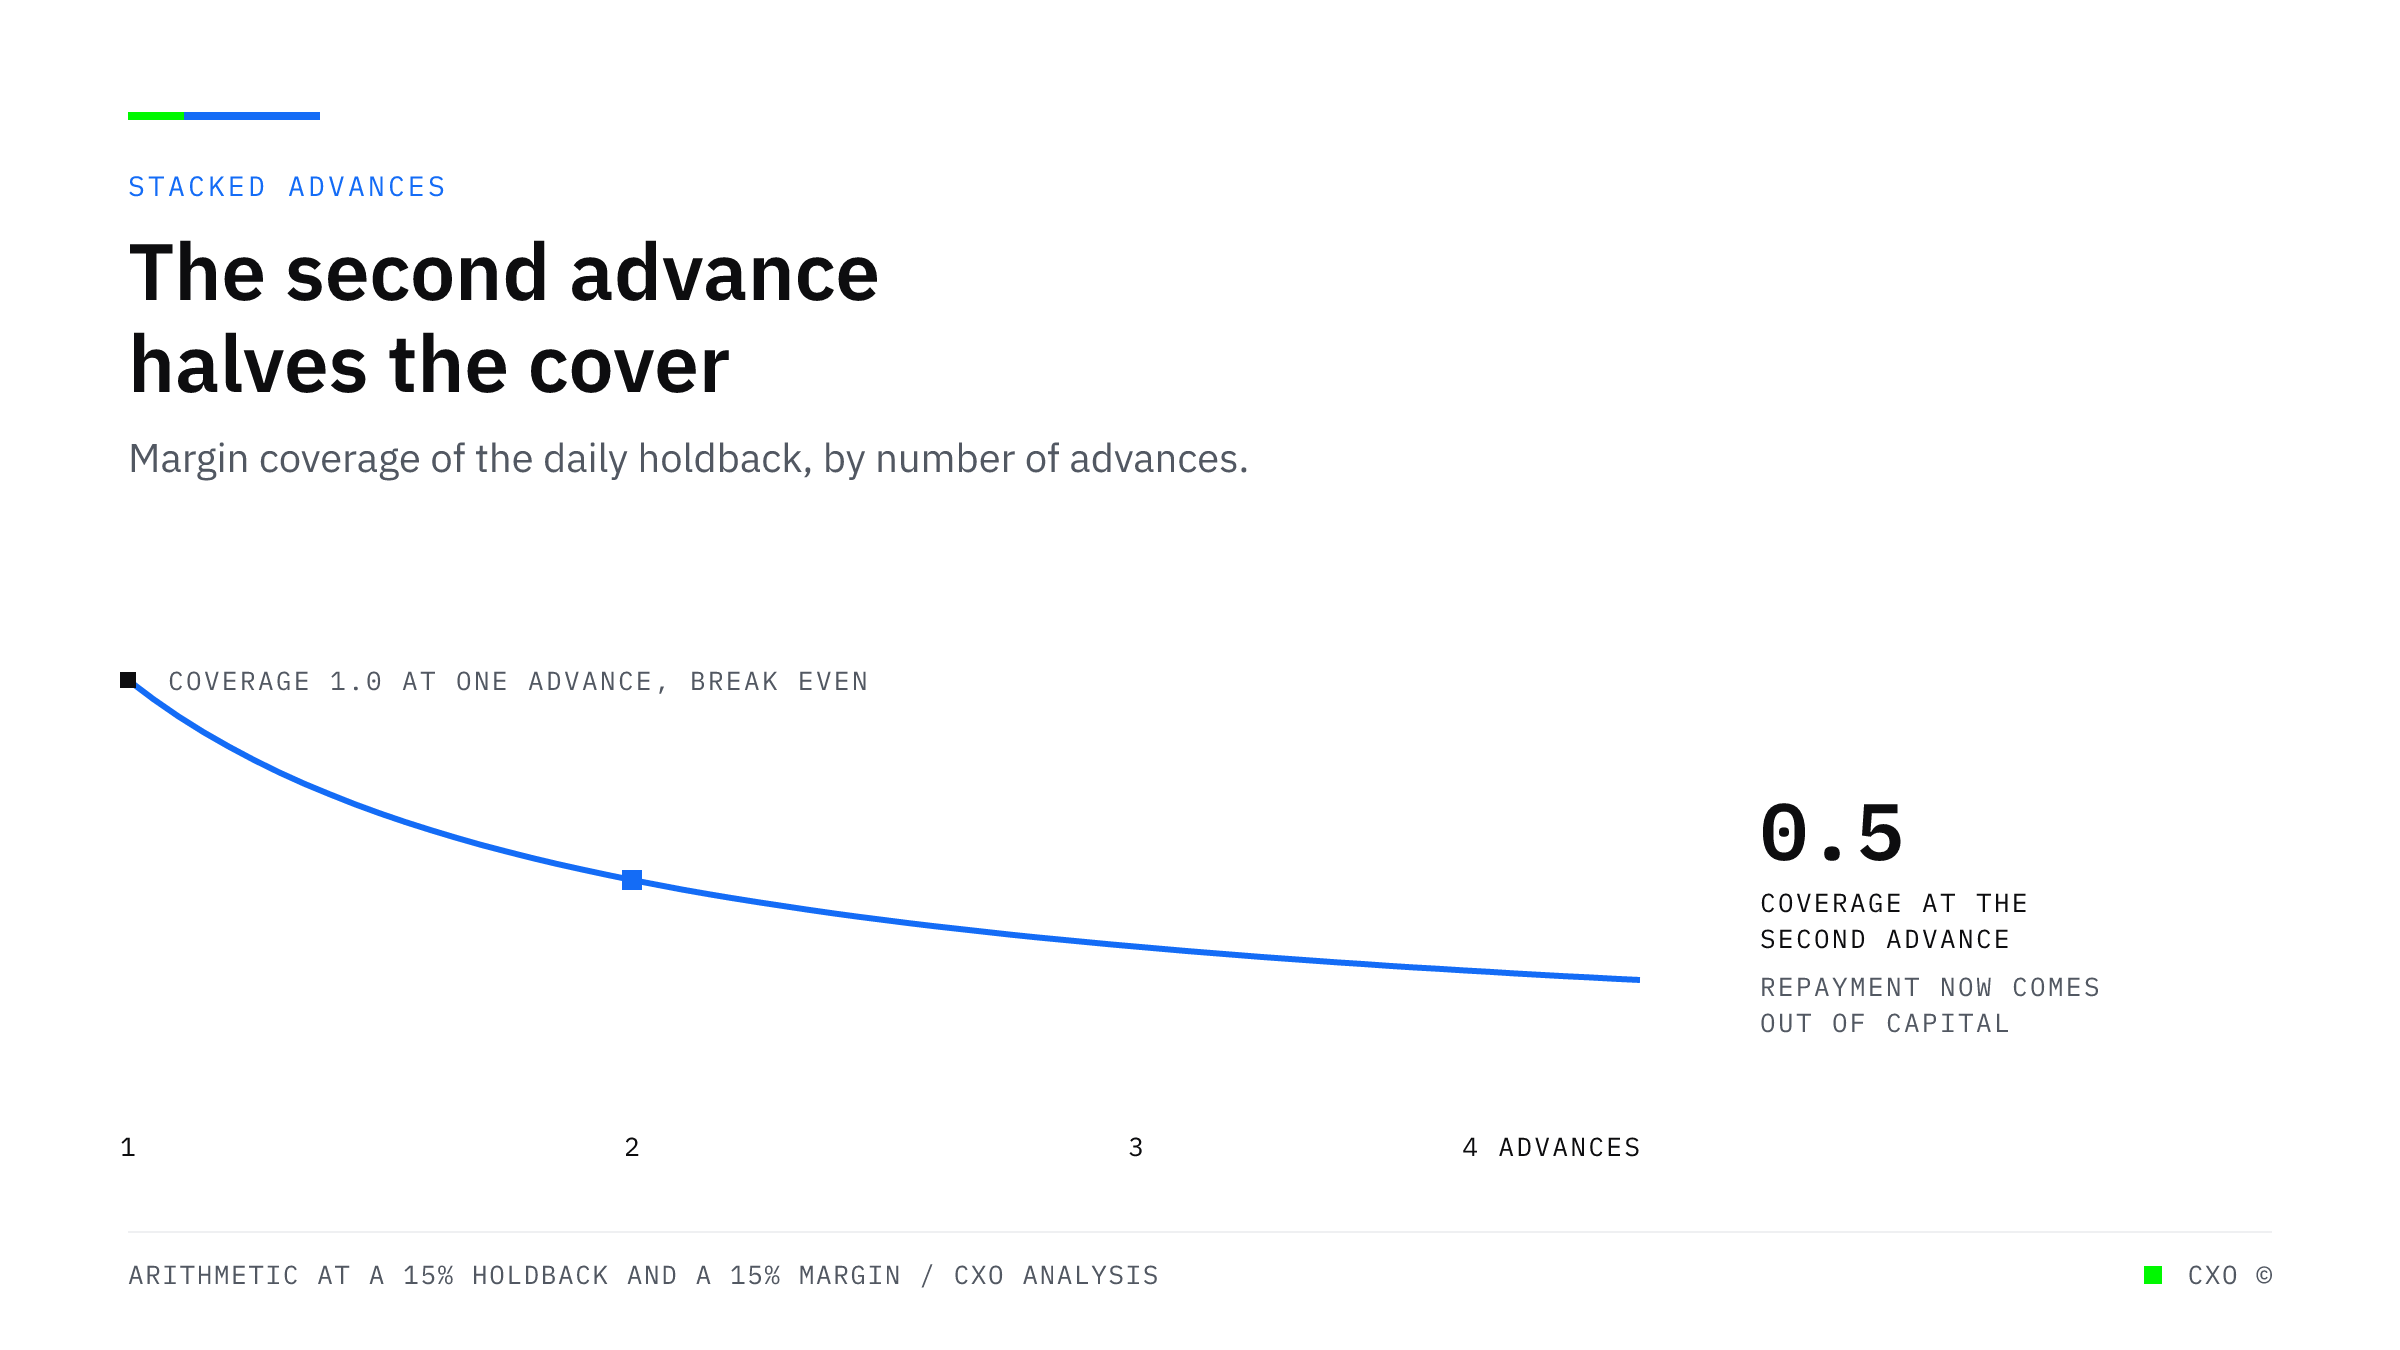
A falling curve showing how a merchant's margin coverage of their daily holdback collapses as advances stack, passing below the break-even threshold at the second advance.

Every Lender in a Stacked Position Underwrote It Correctly

One advance takes 10 to 20 percent of daily receipts. Two or more take 30 to 40. Each funder assessed the file in front of it, and the position that kills the merchant exists only across files.
View Insight
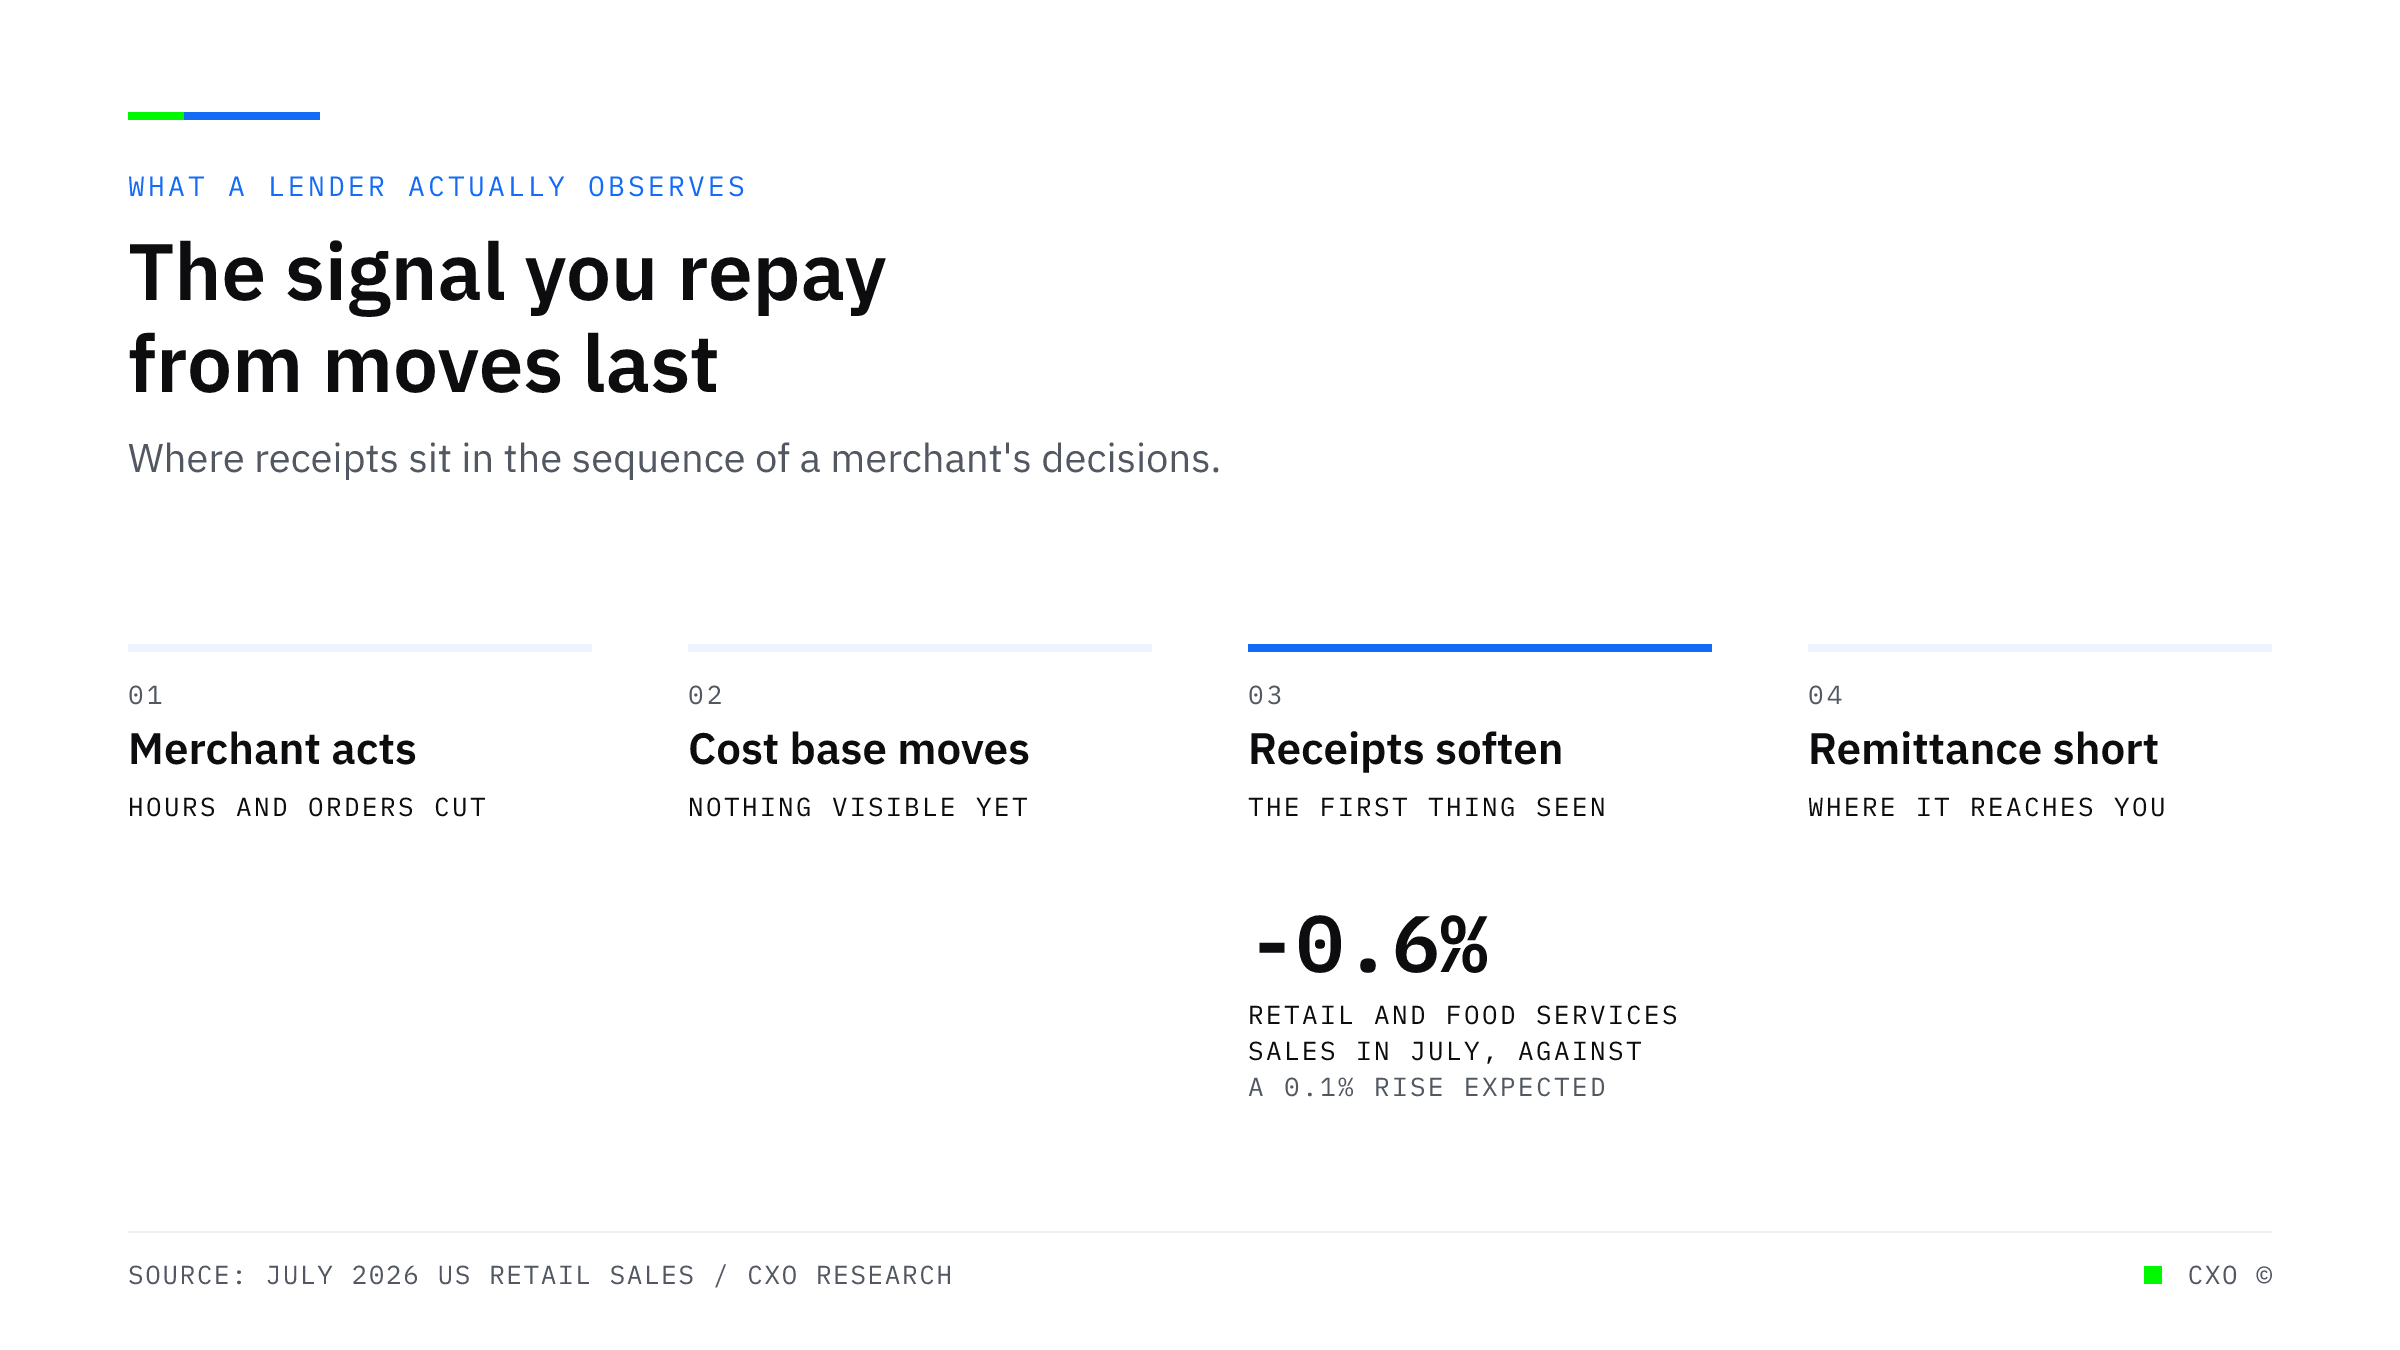
A labelled diagram of four stages showing that a merchant cuts hours and delays orders before anything changes in receipts, that July retail and food services sales fell 0.6 percent against an expected rise, and that remittance performance is where a lender finally sees it.

The Signal You Repay From Is the Last One to Move

July retail sales fell 0.6 percent against an expected rise, and categories ranged from minus 2.2 to plus 1.9 in the same month. Receipts are both the slowest signal a lender has and the least specific.
View Insight
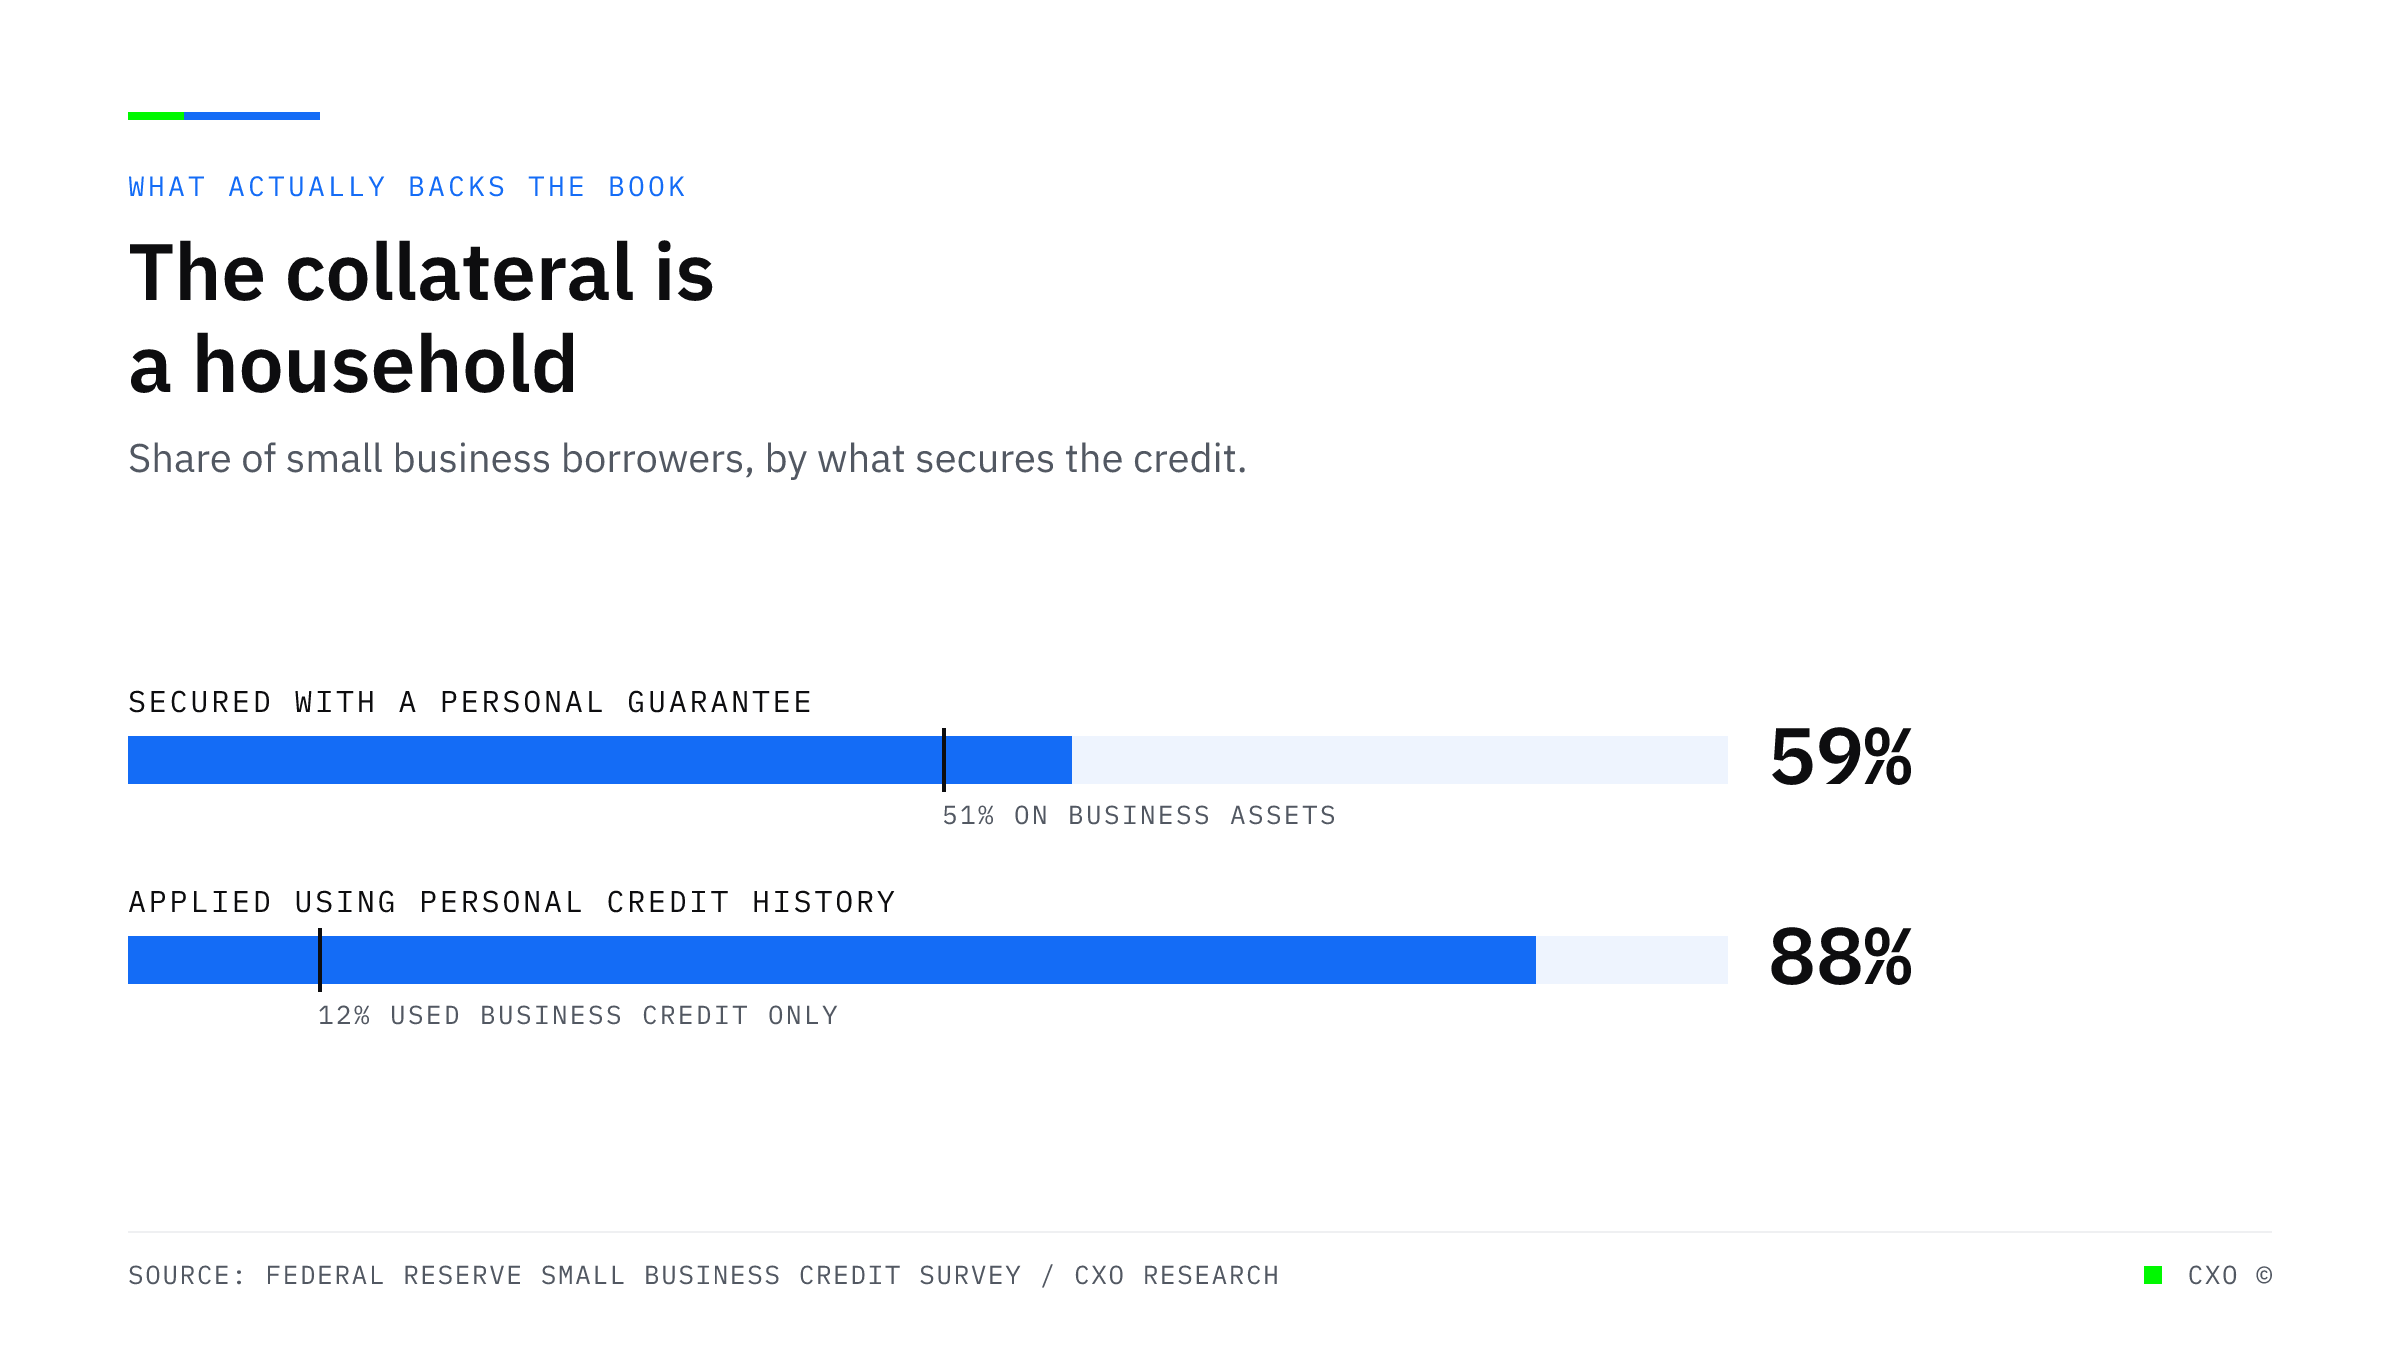
Two bullet bars showing that 59 percent of small business debt holders secured their debt with a personal guarantee against 51 percent using business assets, and that 88 percent of owners applied using personal credit history against 12 percent who used business credit only.

Fifty-Nine Percent of Small Business Debt Is Secured on a Household You Underwrite Once

Most small business debt is backed by a personal guarantee, which makes a household balance sheet the collateral. Merchants get monitored daily. Guarantors get looked at once, at origination.
View Insight
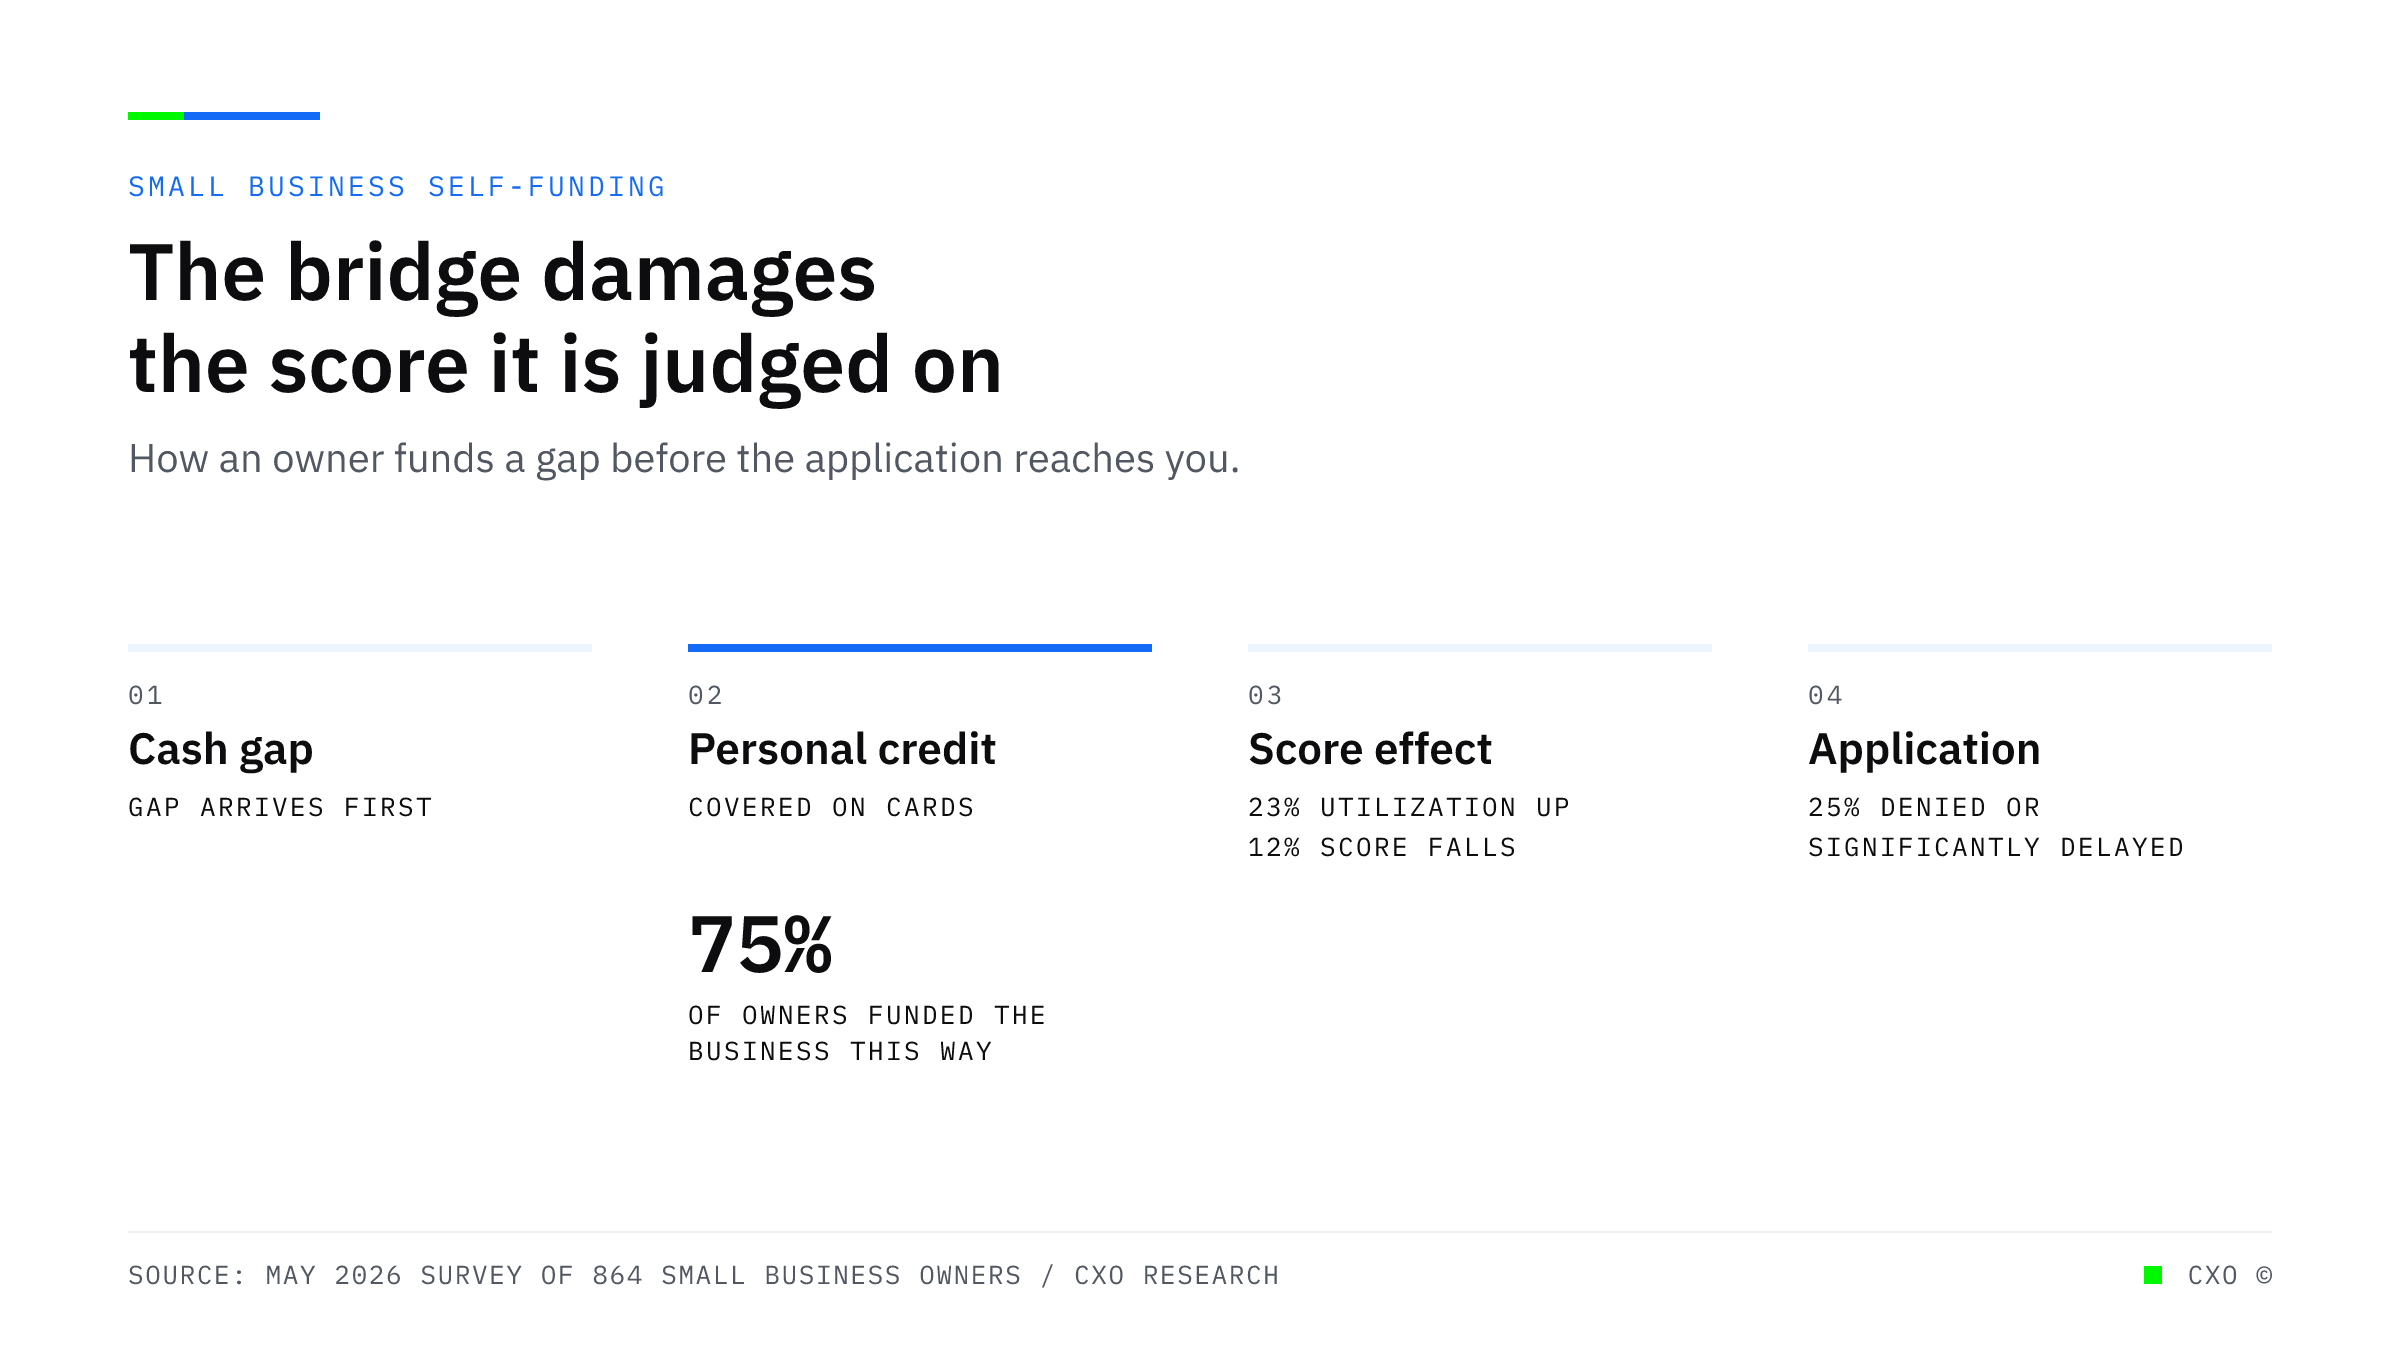
A labelled diagram of how a small business owner self-funds before applying: a cash gap appears, personal credit covers it for 75 percent of owners, utilization rises for 23 percent and personal credit scores fall for 12 percent, and 25 percent are then denied or significantly delayed on the business application that follows.

Three in Four Applicants Already Borrowed Before They Reached You. It Was on Personal Credit.

Revolving credit is growing at nearly twice the pace of everything else, and 75 percent of small business owners funded the business on personal credit in the past year, up from 49 percent in 2024.
View Insight
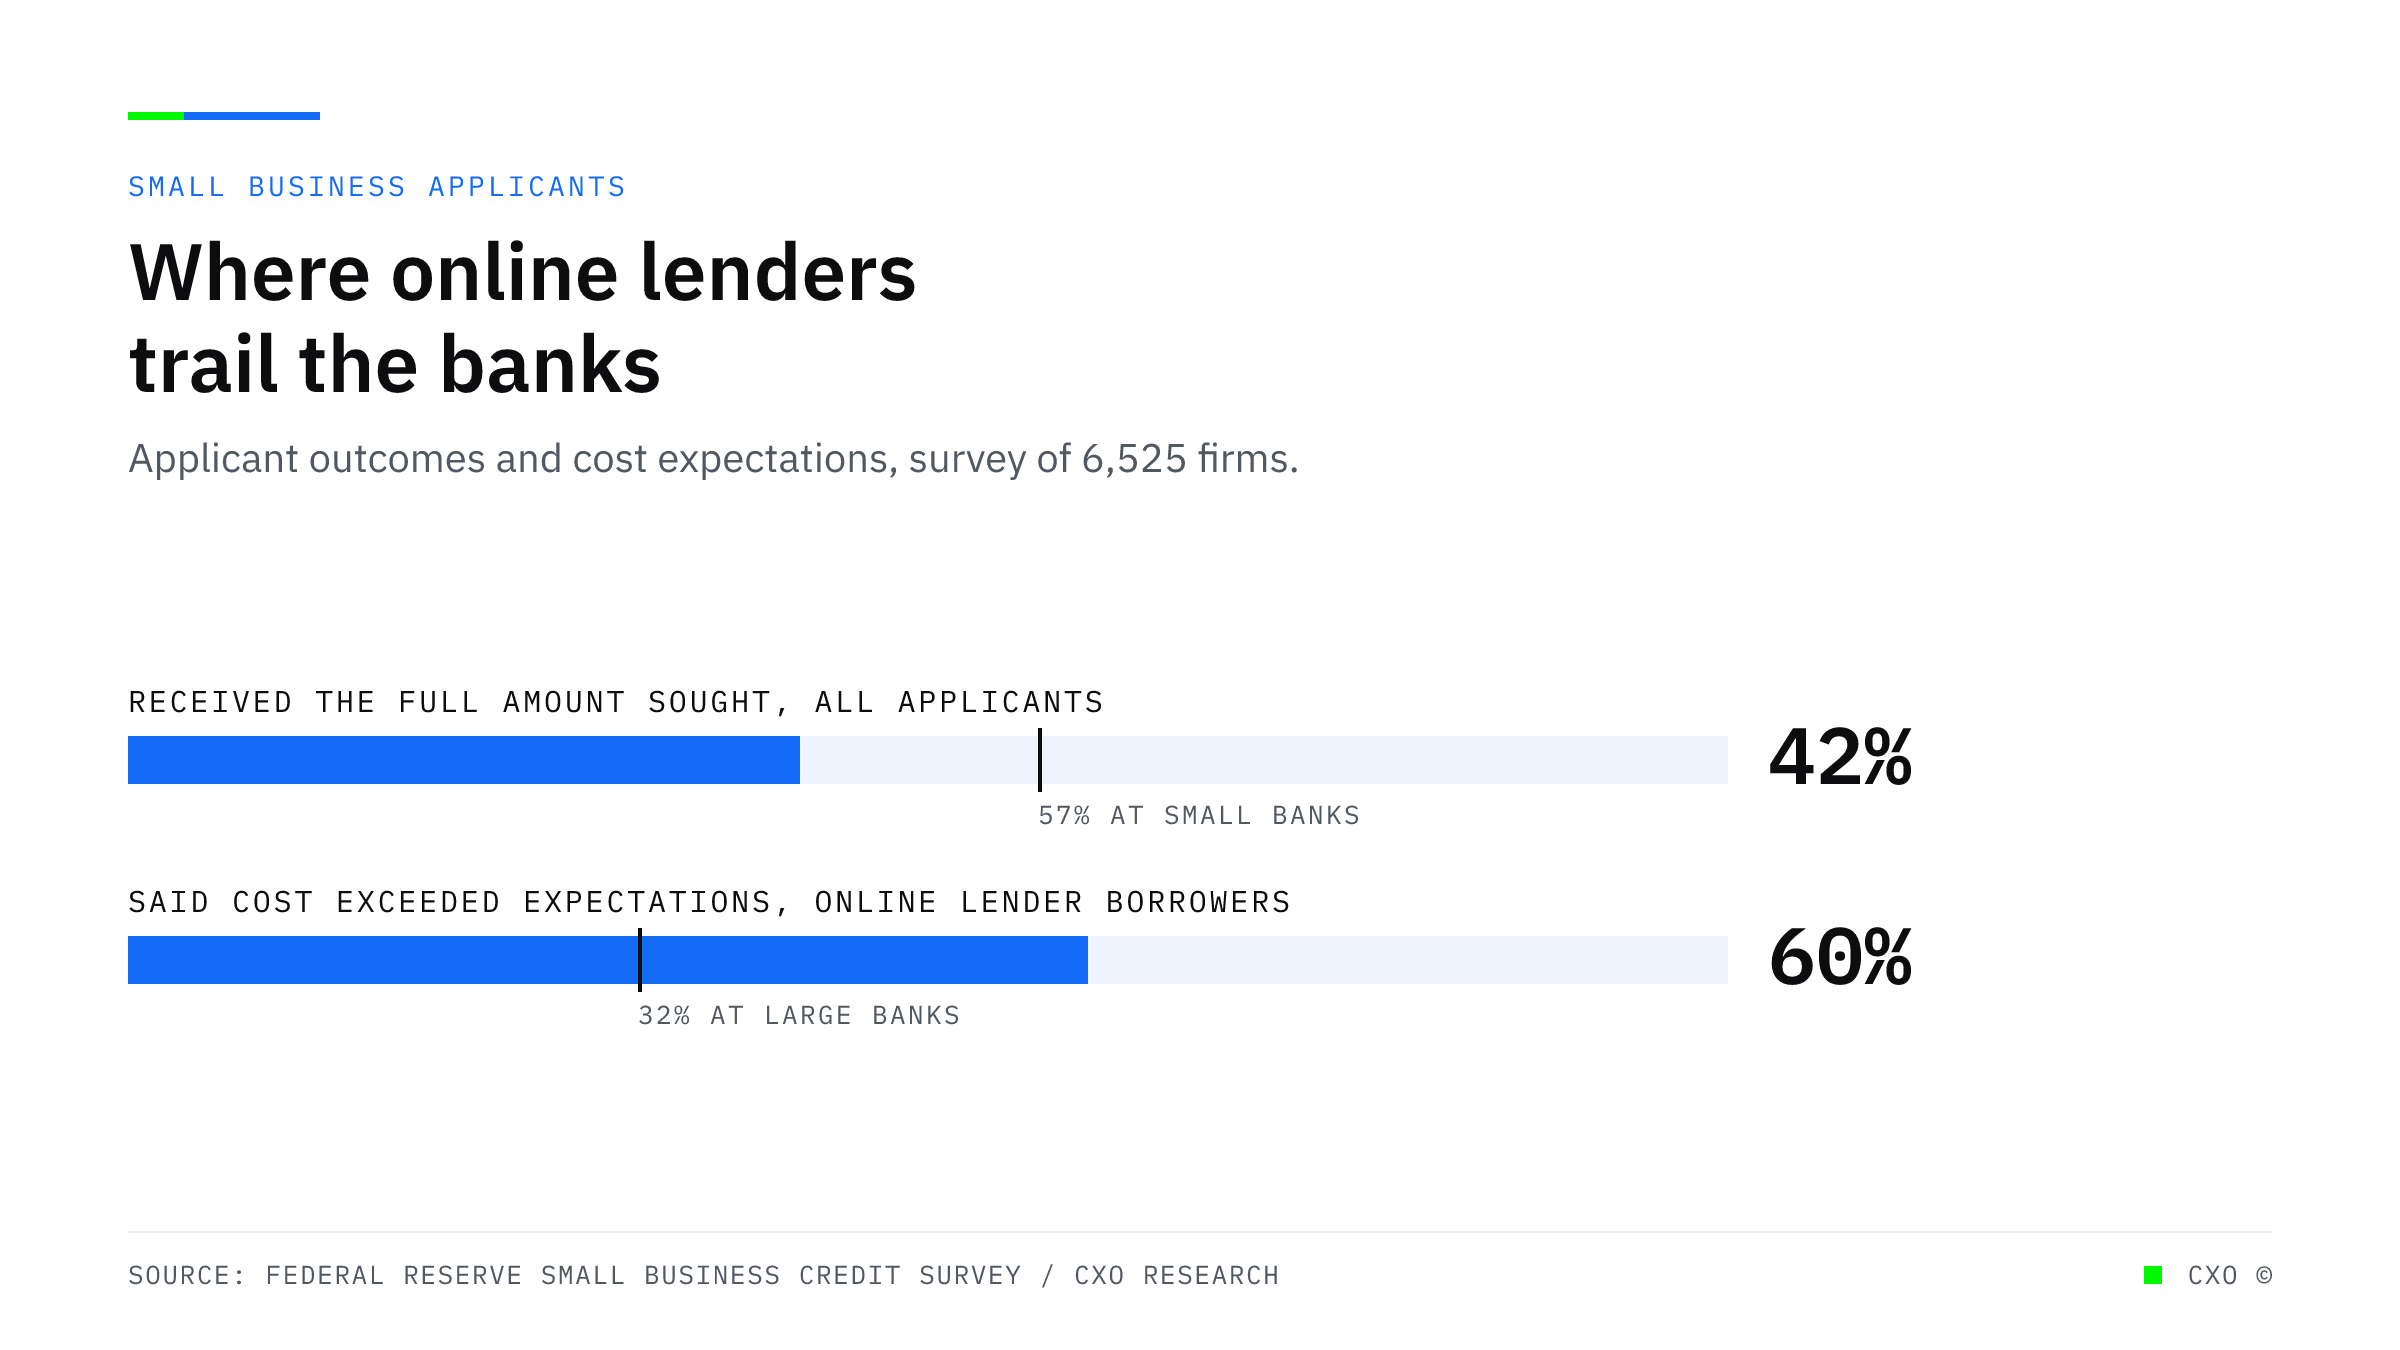
Two bullet bars comparing small business applicant outcomes against bank benchmarks: 42 percent received the full amount sought against 57 percent at small banks, and 60 percent of online lender borrowers said costs exceeded expectations against 32 percent at large banks.

Thirty-Six Percent of Applicants Got Part of What They Asked For. That Is Your Biggest Untouched Book.

Across small business applicants, 42 percent received the full amount sought and 36 percent received some or most. The partially funded group carries an unmet need, a completed file, and no owner.
View Insight
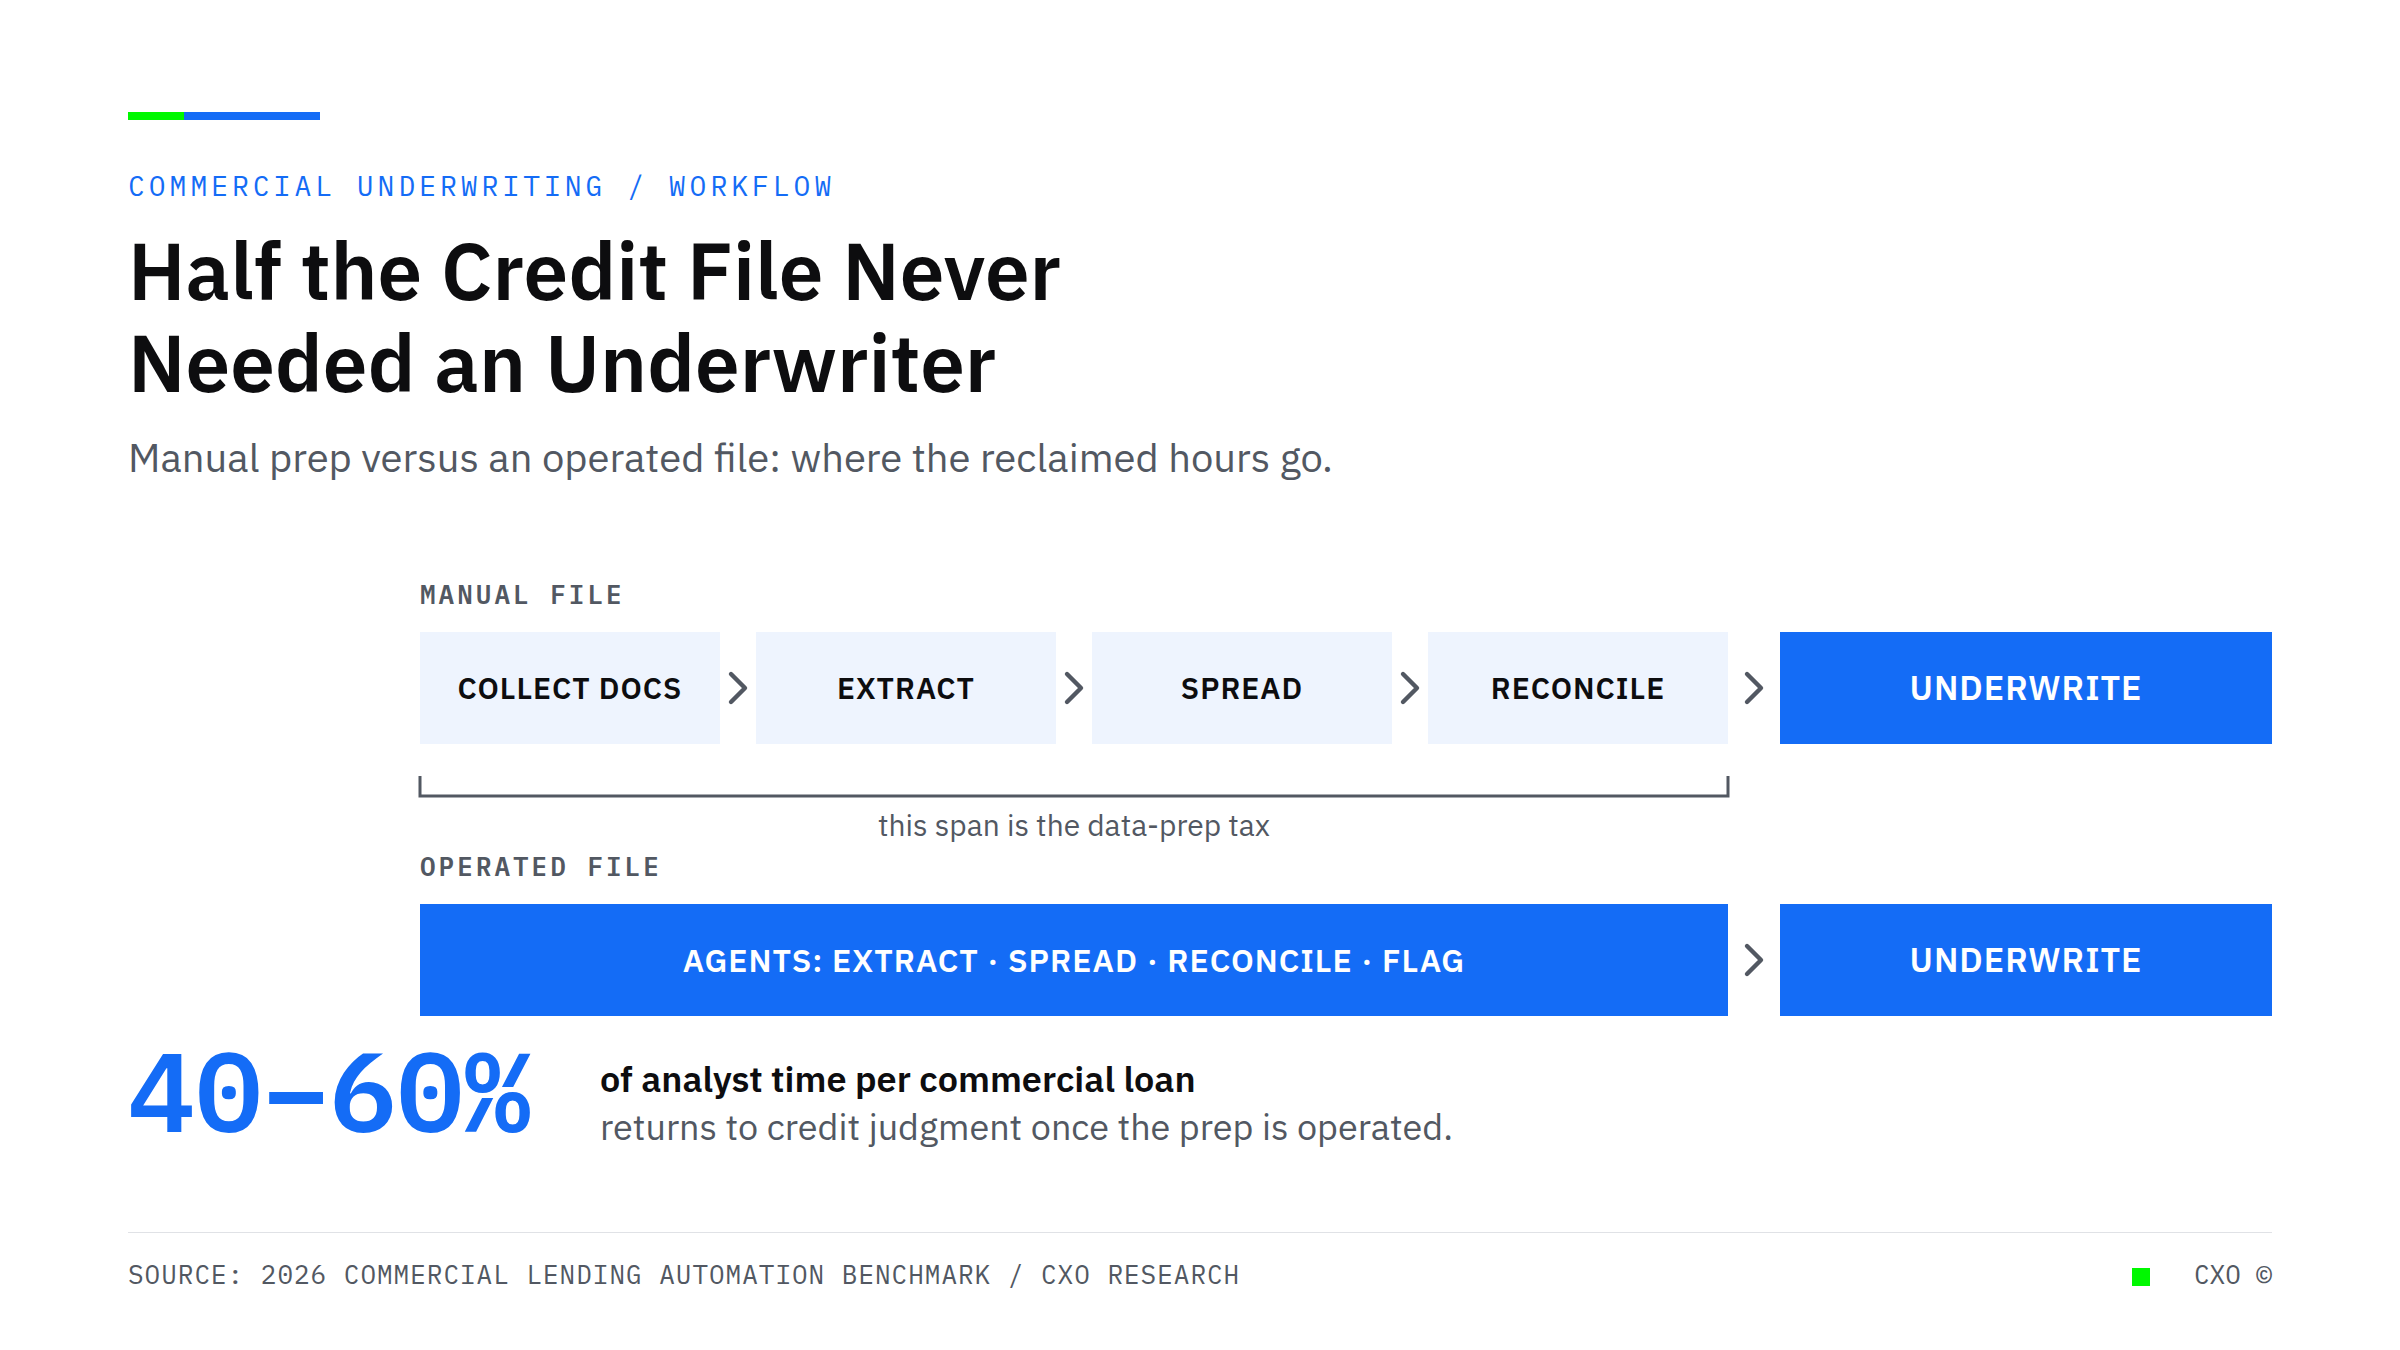
Anatomy of a commercial credit file comparing a manual file, which spends 40 to 60 percent of analyst time on document prep, with an operated file where agents handle extraction, spreading, and reconciliation before underwriting.

Your Best Underwriters Spend Half Their Day Not Underwriting

Automating financial spreading and reconciliation cuts analyst time per commercial loan by 40 to 60%. Why hiring another underwriter is the wrong fix for a backed-up pipeline, and what an operated credit file changes.
View Insight
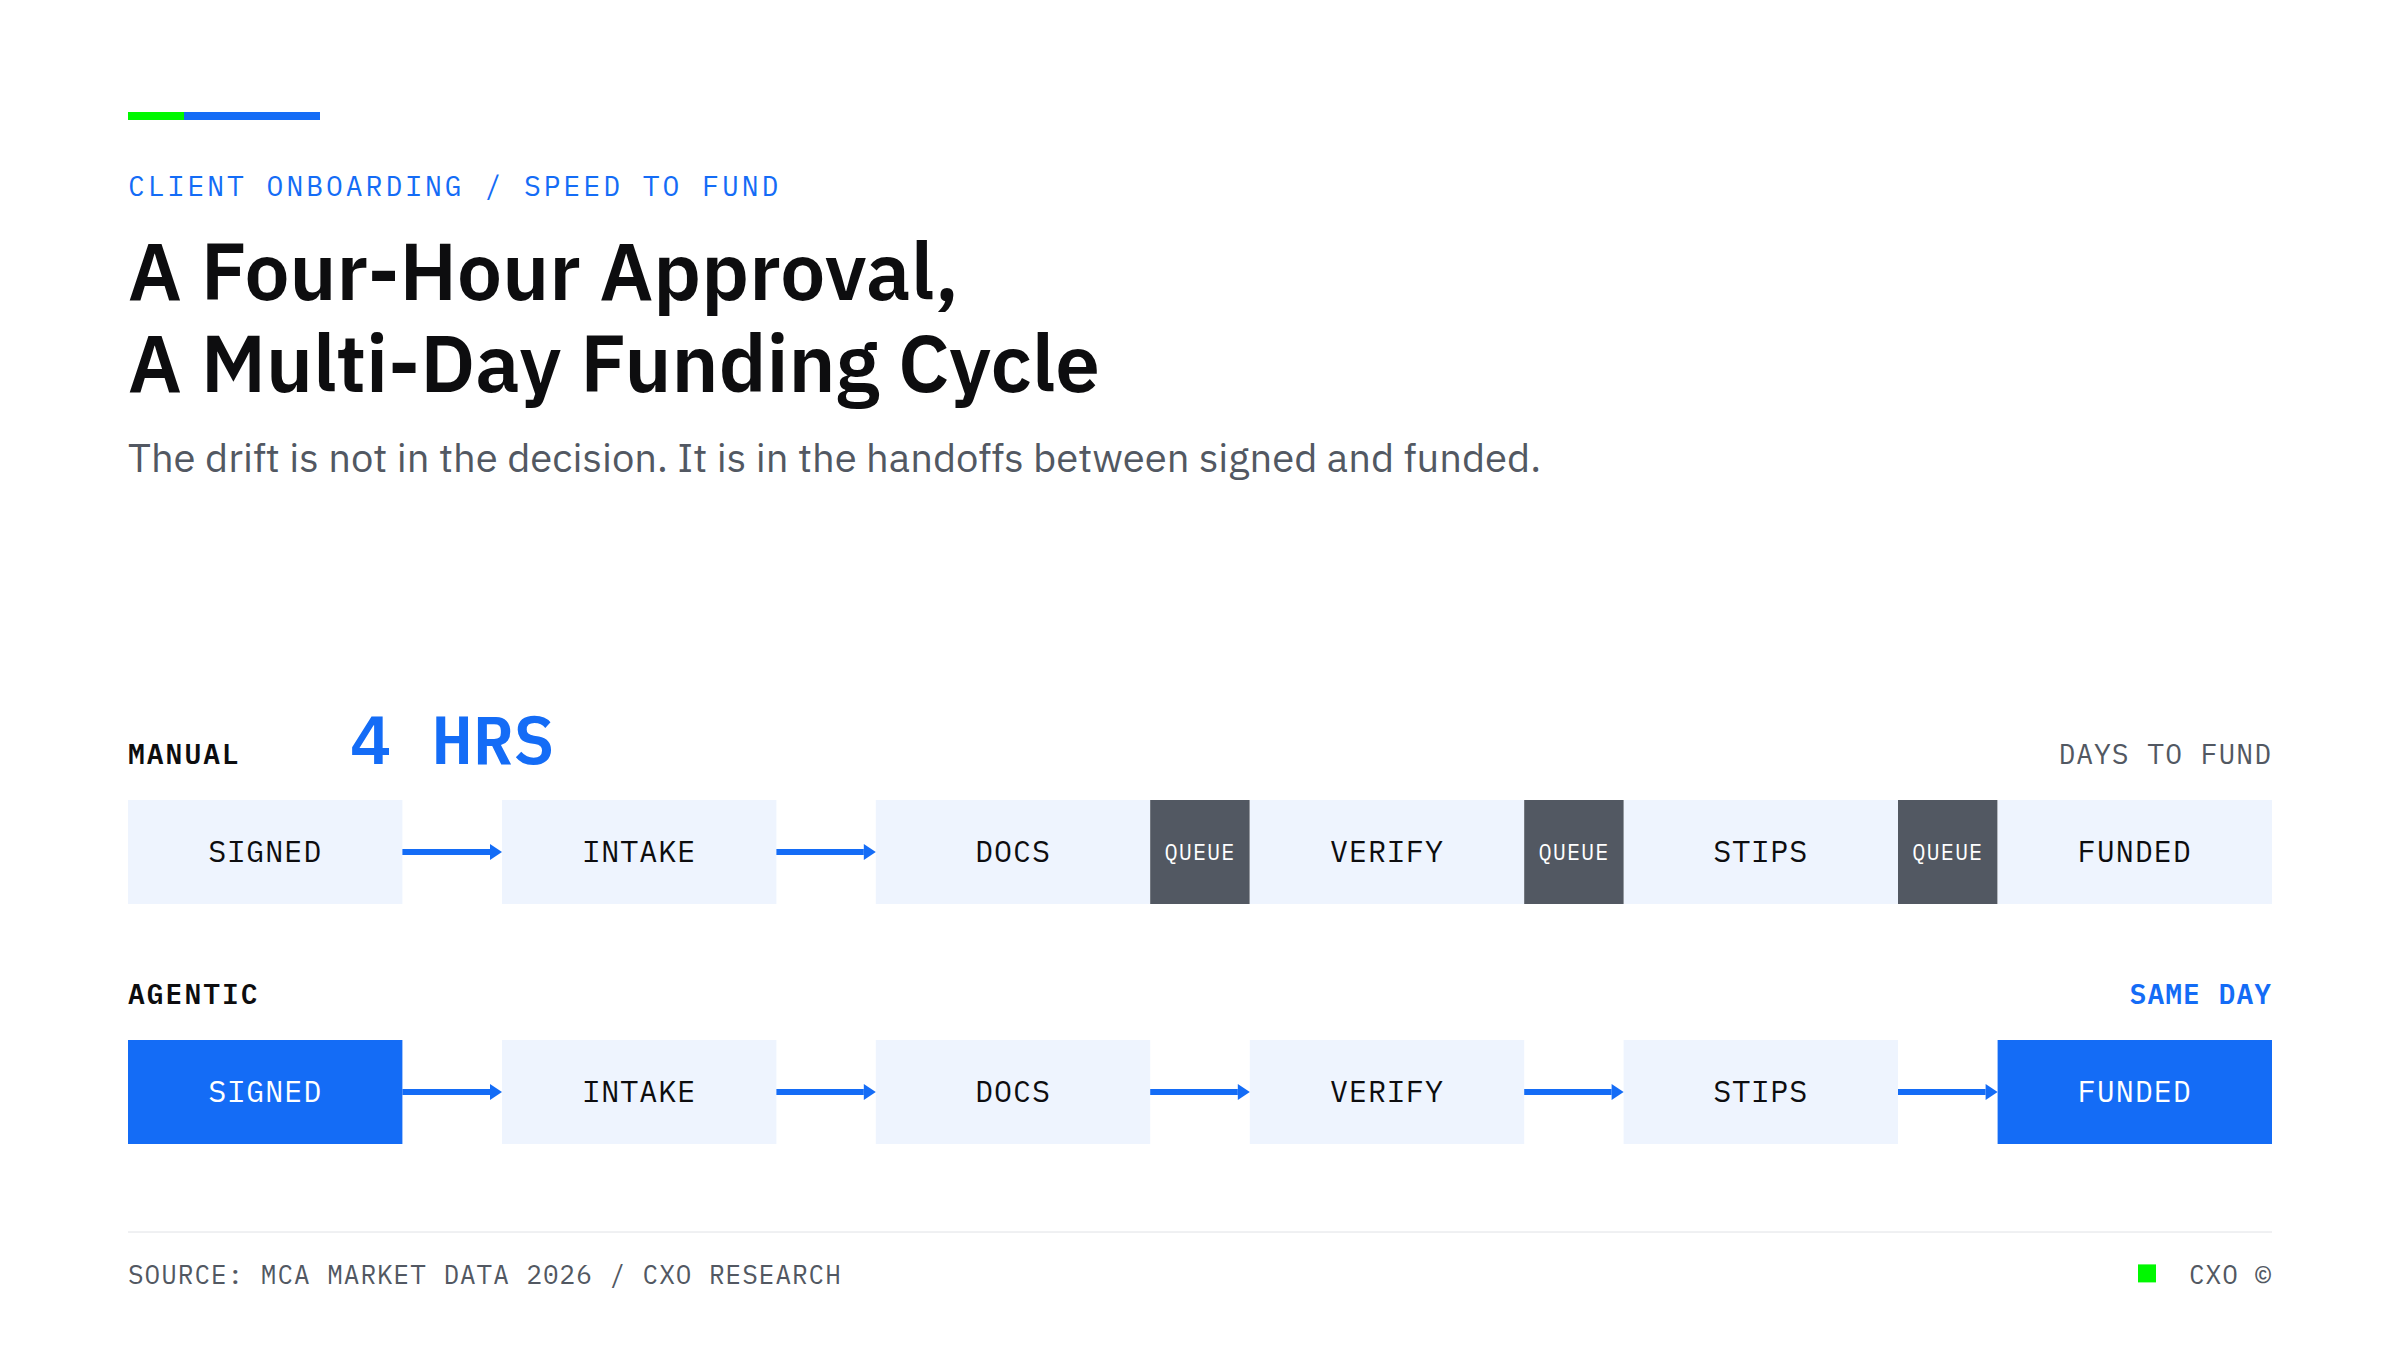
Two-track workflow diagram contrasting a four-hour advertised approval with a multi-day manual MCA funding cycle, marking the document, verification, and stipulation handoffs where days accumulate before funding.

The Funder Who Advertises Four-Hour Approvals Takes Nine Days to Actually Fund

Alternative lenders advertise four-hour funding but operate multi-day cycles. See where the days hide between signed application and wire, and how agentic onboarding closes the gap.
View Insight
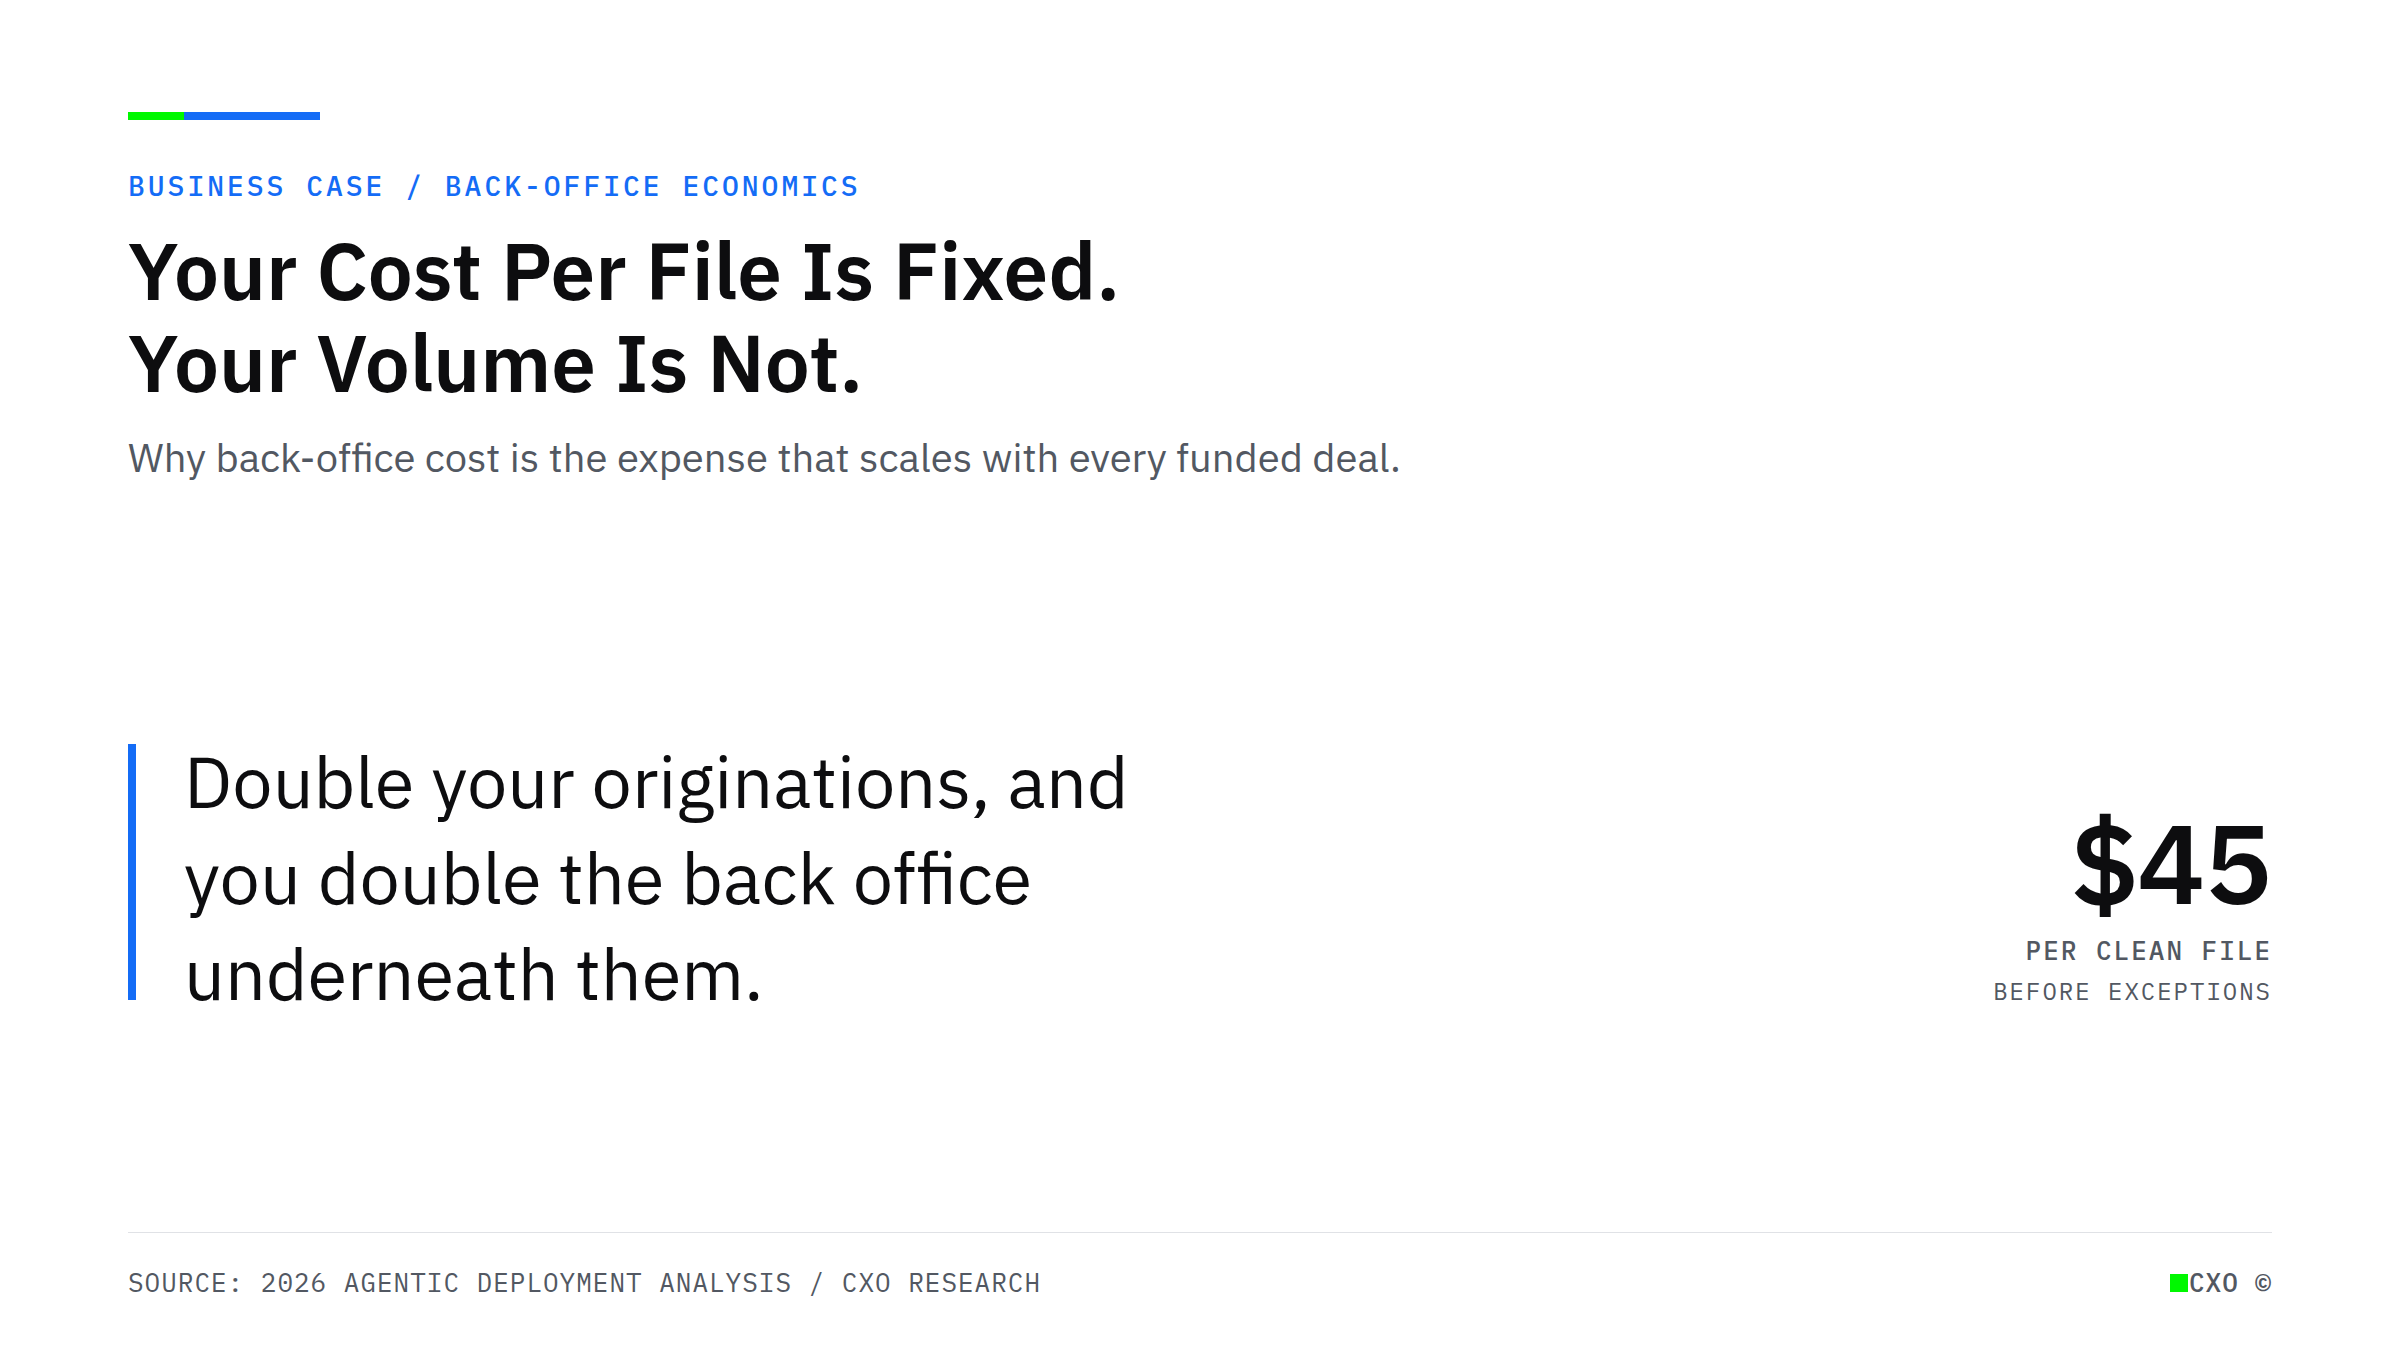
Editorial pull-quote cover reading "Double your originations, and you double the back office underneath them," annotated with roughly $45 per clean file before exceptions

Your Cost Per File Is Fixed. Your Volume Is Not. That Is Where Growth Gets Expensive.

Back-office cost is the one expense that scales in lockstep with loan volume. At roughly $45 a clean file, growth quietly doubles it. Here is how alternative lenders break the link between volume and headcount.
View Insight
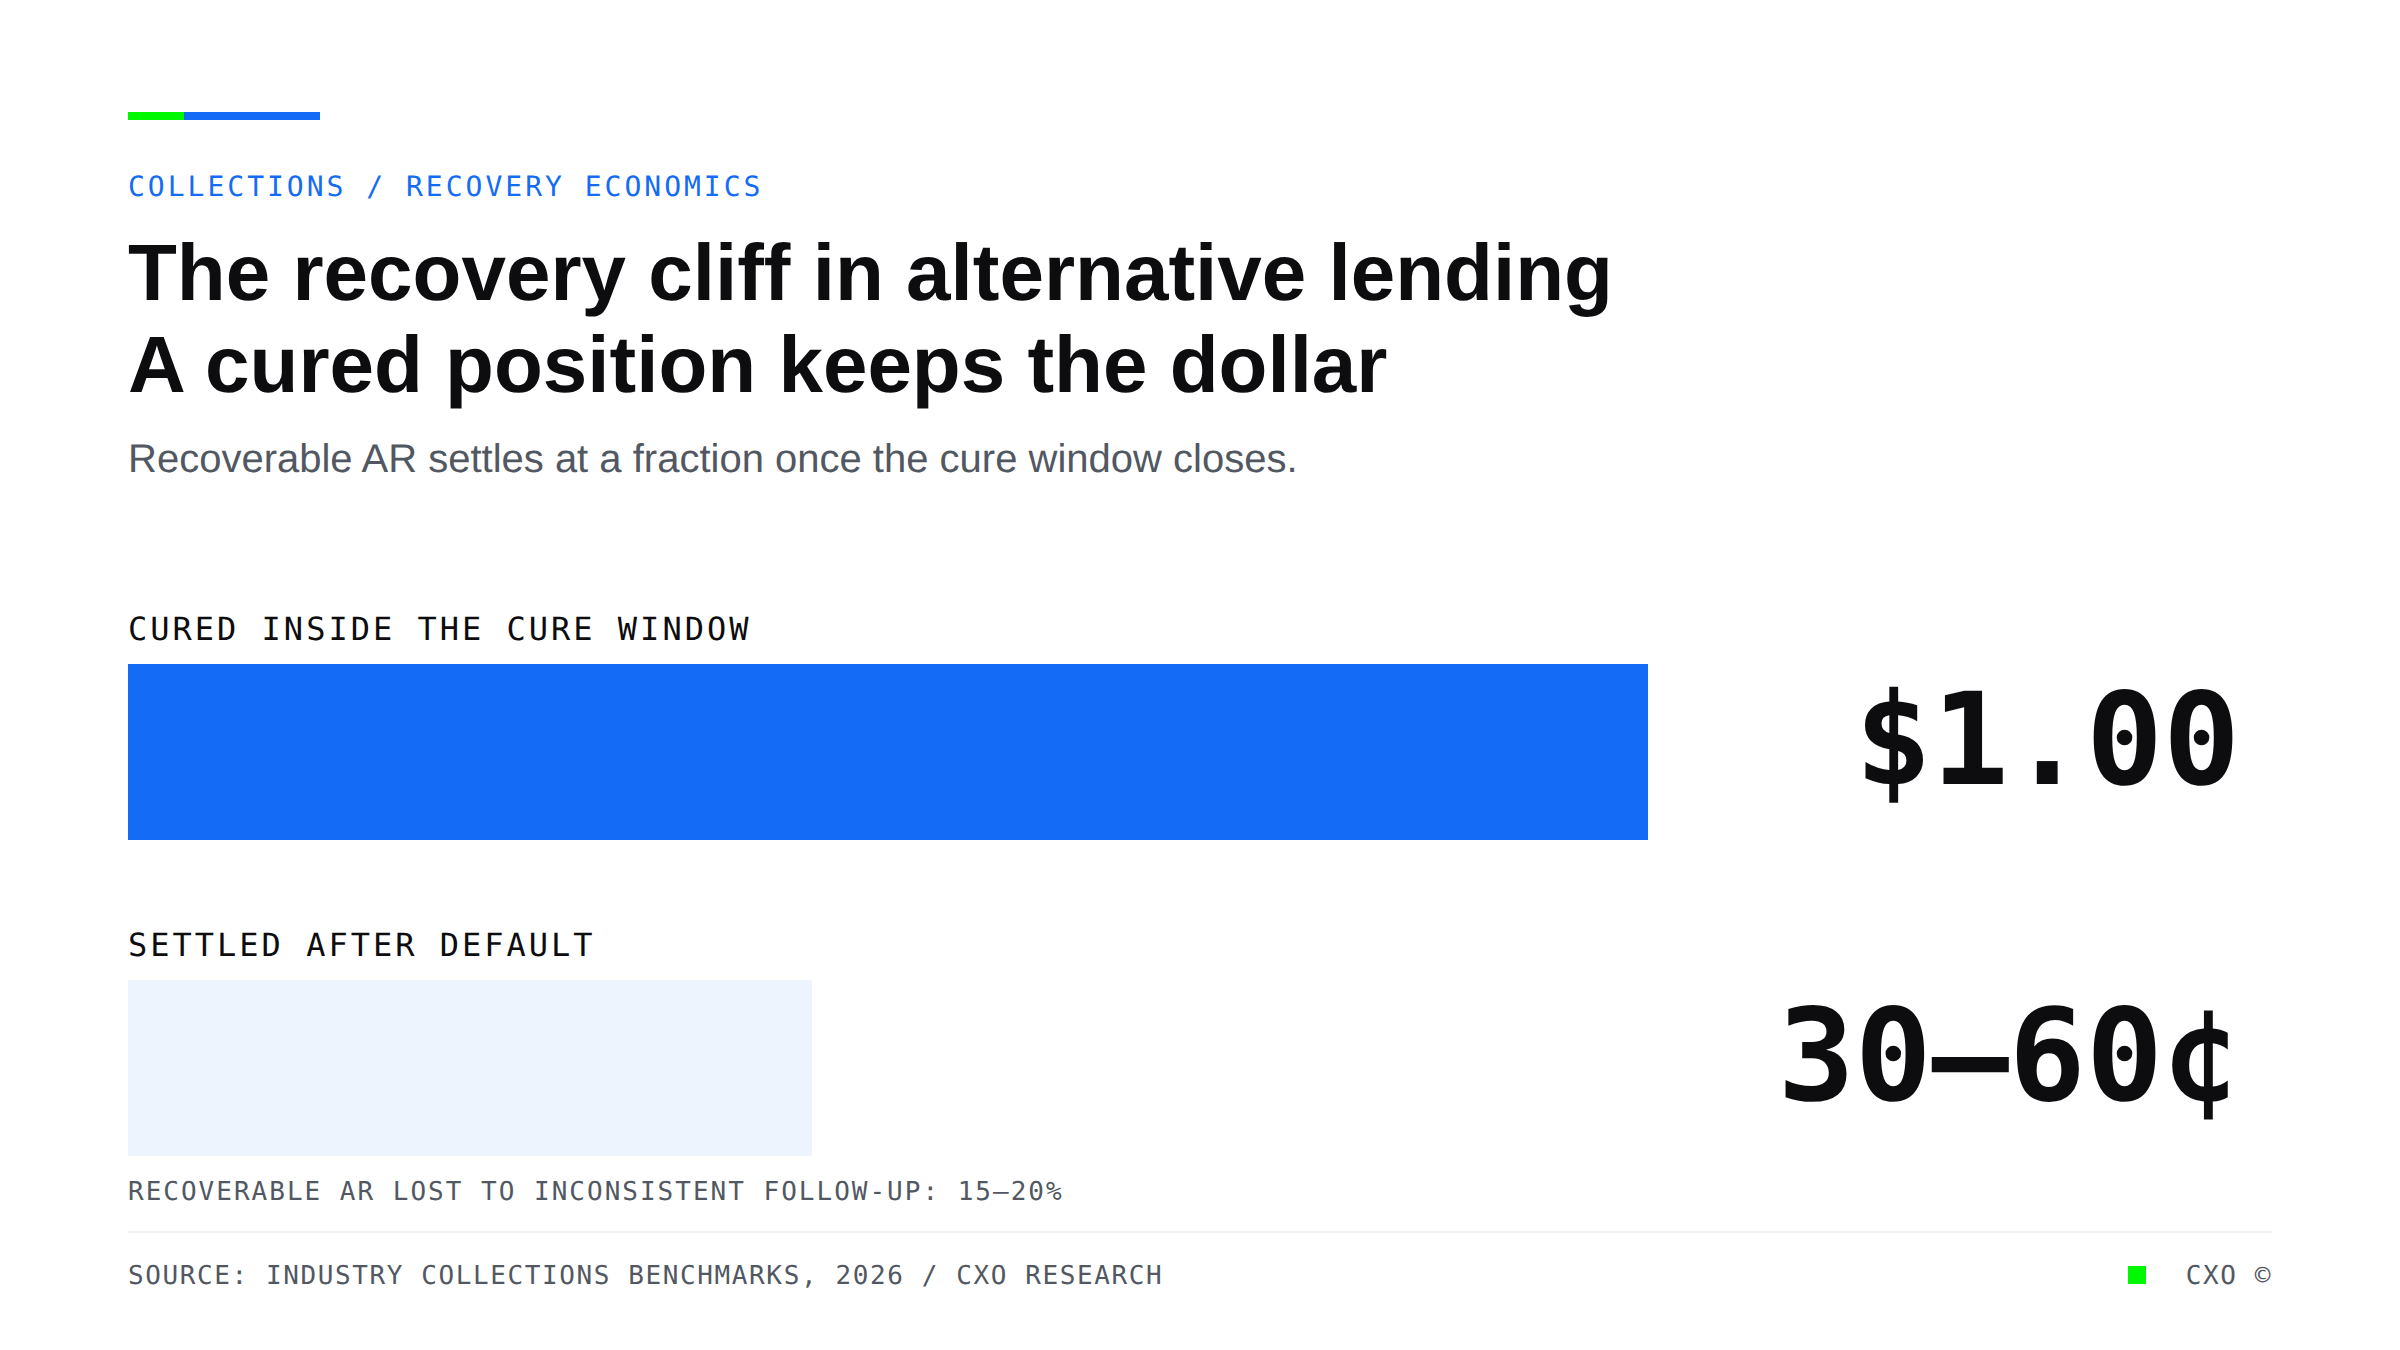
Bar comparison showing a cured alternative-lending position recovering 100 cents on the dollar versus 30 to 60 cents once it settles after default.

Your Worst Recoveries Are a Scheduling Problem, Not a Credit Problem

Alternative lenders lose 15 to 20% of recoverable AR to inconsistent follow-up, not bad credit. Why recovery is a timing problem, and how CXO closes the gap.
View Insight
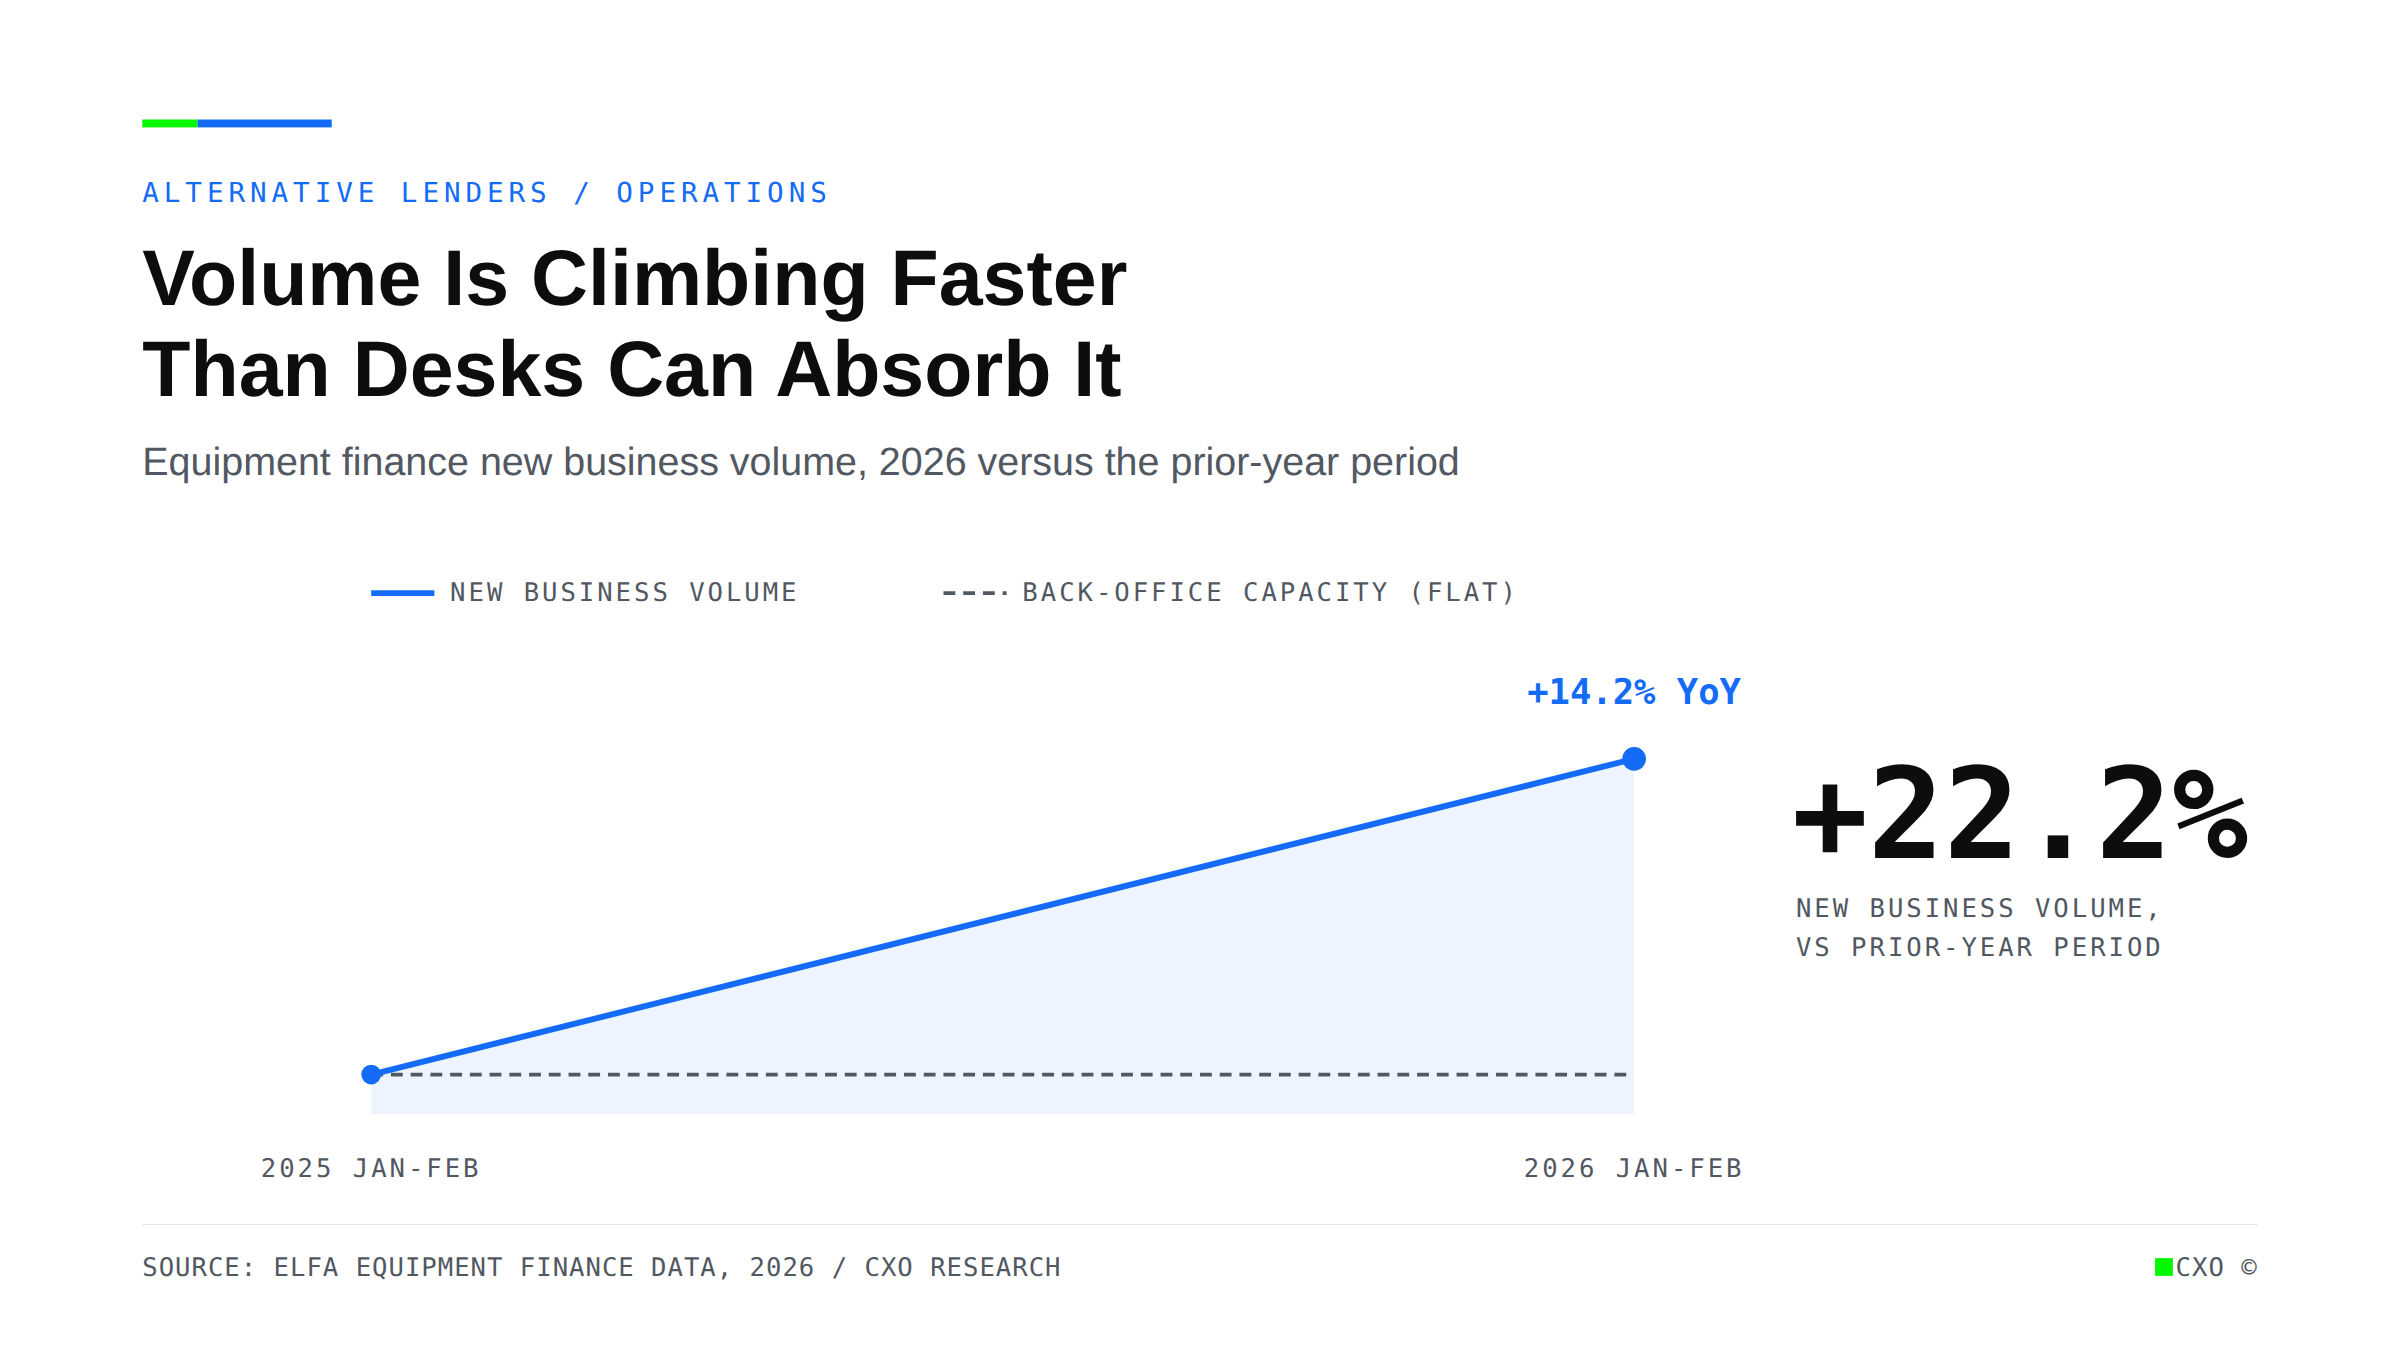
Line chart showing equipment finance new business volume rising 22.2% versus the prior-year period while back-office capacity stays flat, opening a widening operational gap.

Equipment Finance Volume Is Up Twenty-Two Percent. The Desks Processing It Did Not Grow Twenty-Two Percent.

Equipment finance volume is up 22.2% in early 2026, but the desks processing it did not grow with it. Why hiring through a surge fails, and how lenders scale volume without scaling headcount.
View Insight

Ready to put agentic AI to work?

See where automation can take the manual, repetitive work off your team. Book a discovery call and we'll map the highest-impact processes in your operation.

Book a discovery call