Category

Professional Services Ops

24 insights · page 3 of 3

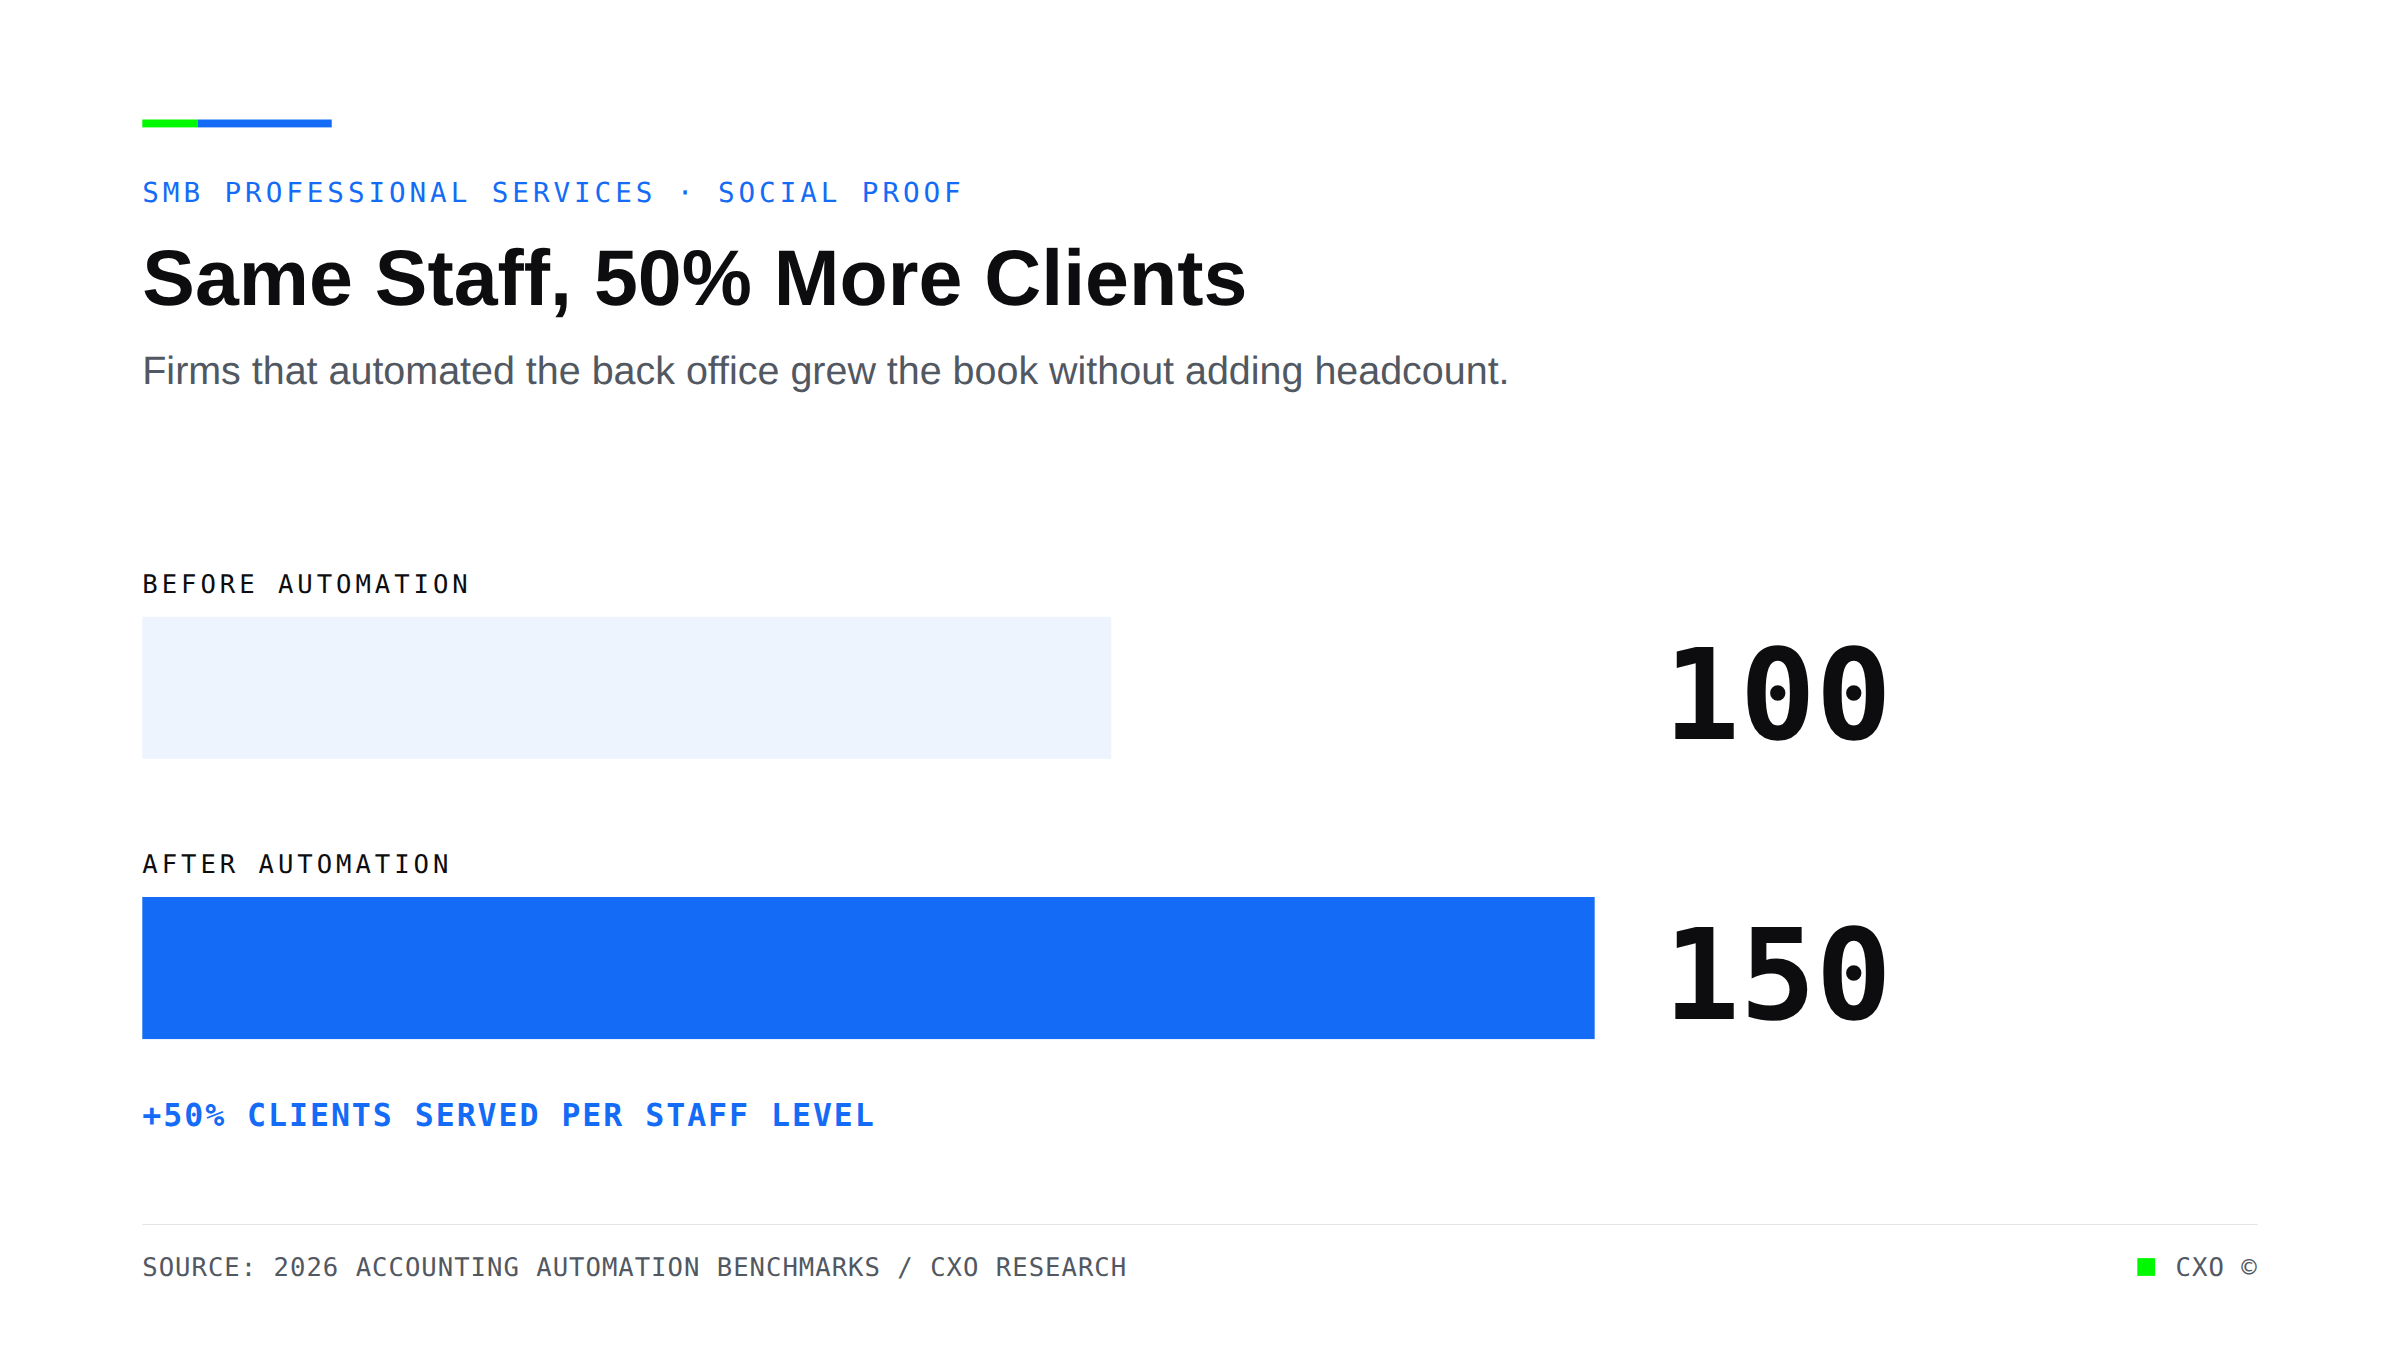
Bar chart comparison showing professional services firms serving 50 percent more clients at the same staff level after automating back-office operations

Same Staff, 50% More Clients: What Separates the Firms That Got There From the Ones Still Hiring

Firms that automated the back office are serving 50% more clients with the same staff. Why the growth ceiling is a capacity problem, not a hiring problem, and how to break it.
View Insight
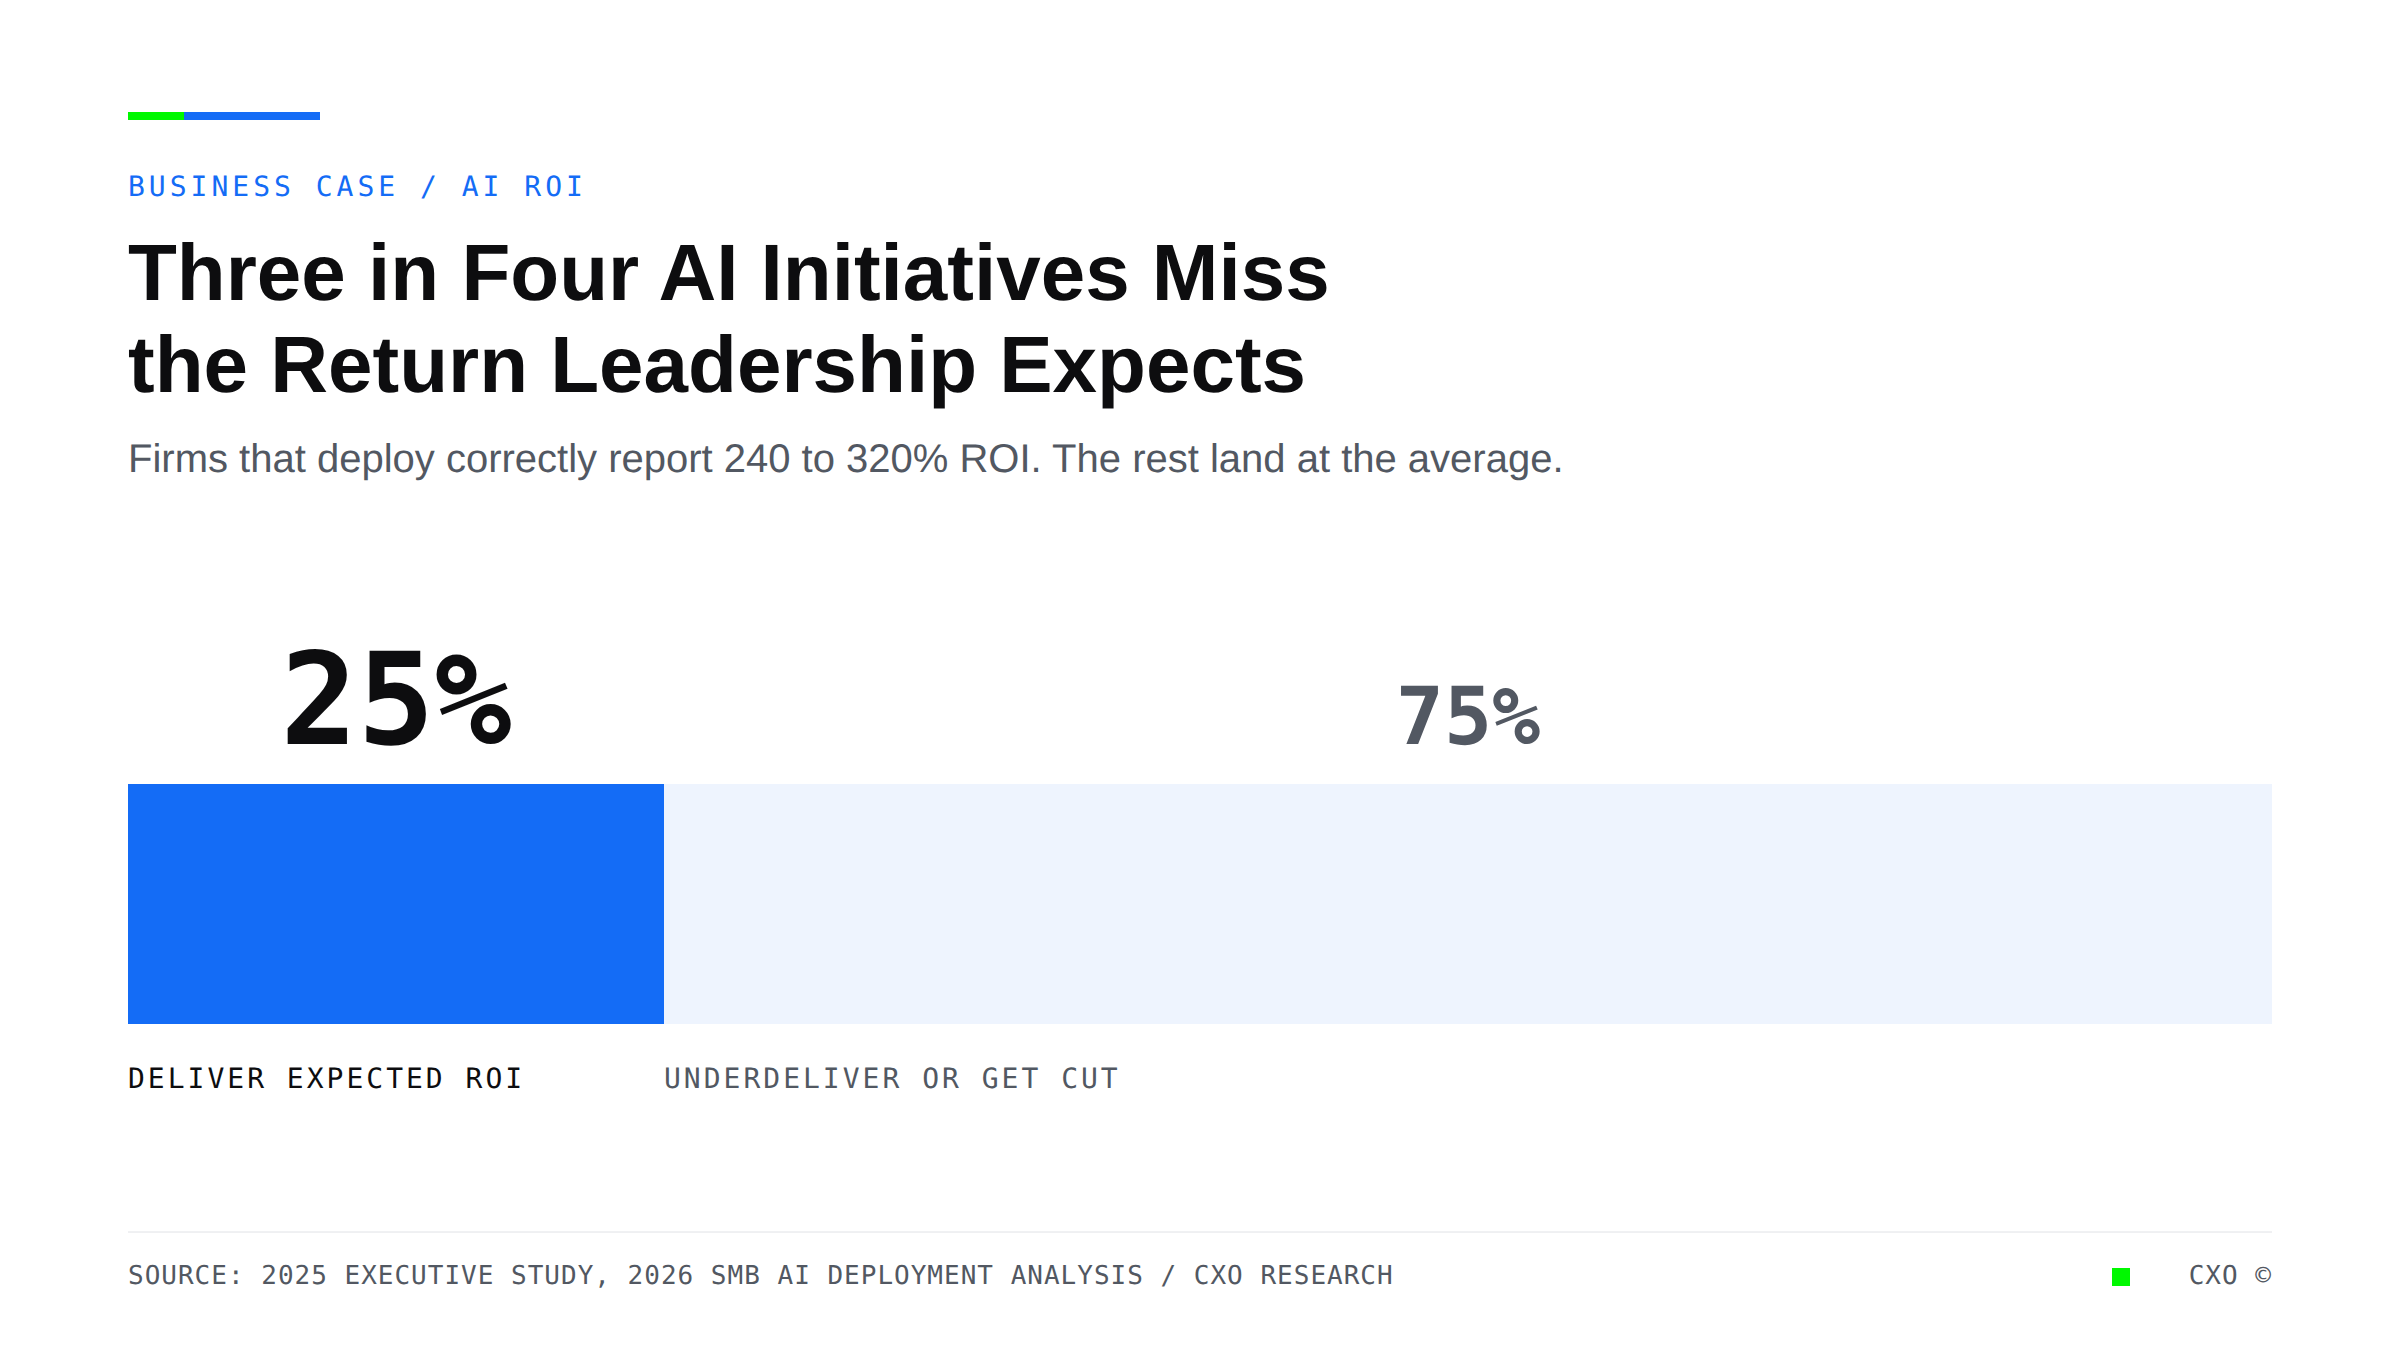
Stacked bar showing only about 25 percent of AI initiatives deliver the ROI leadership expects, with text on concentrating automation on the highest-cost process first.

The Back-Office Costs That Grow Every Time You Add a Client Are the Ones AI Should Take First

Sub-500-employee firms report 240 to 320% ROI on agentic AI, yet only 25% of initiatives hit their target. The difference is where you point it. Start with the back office.
View Insight
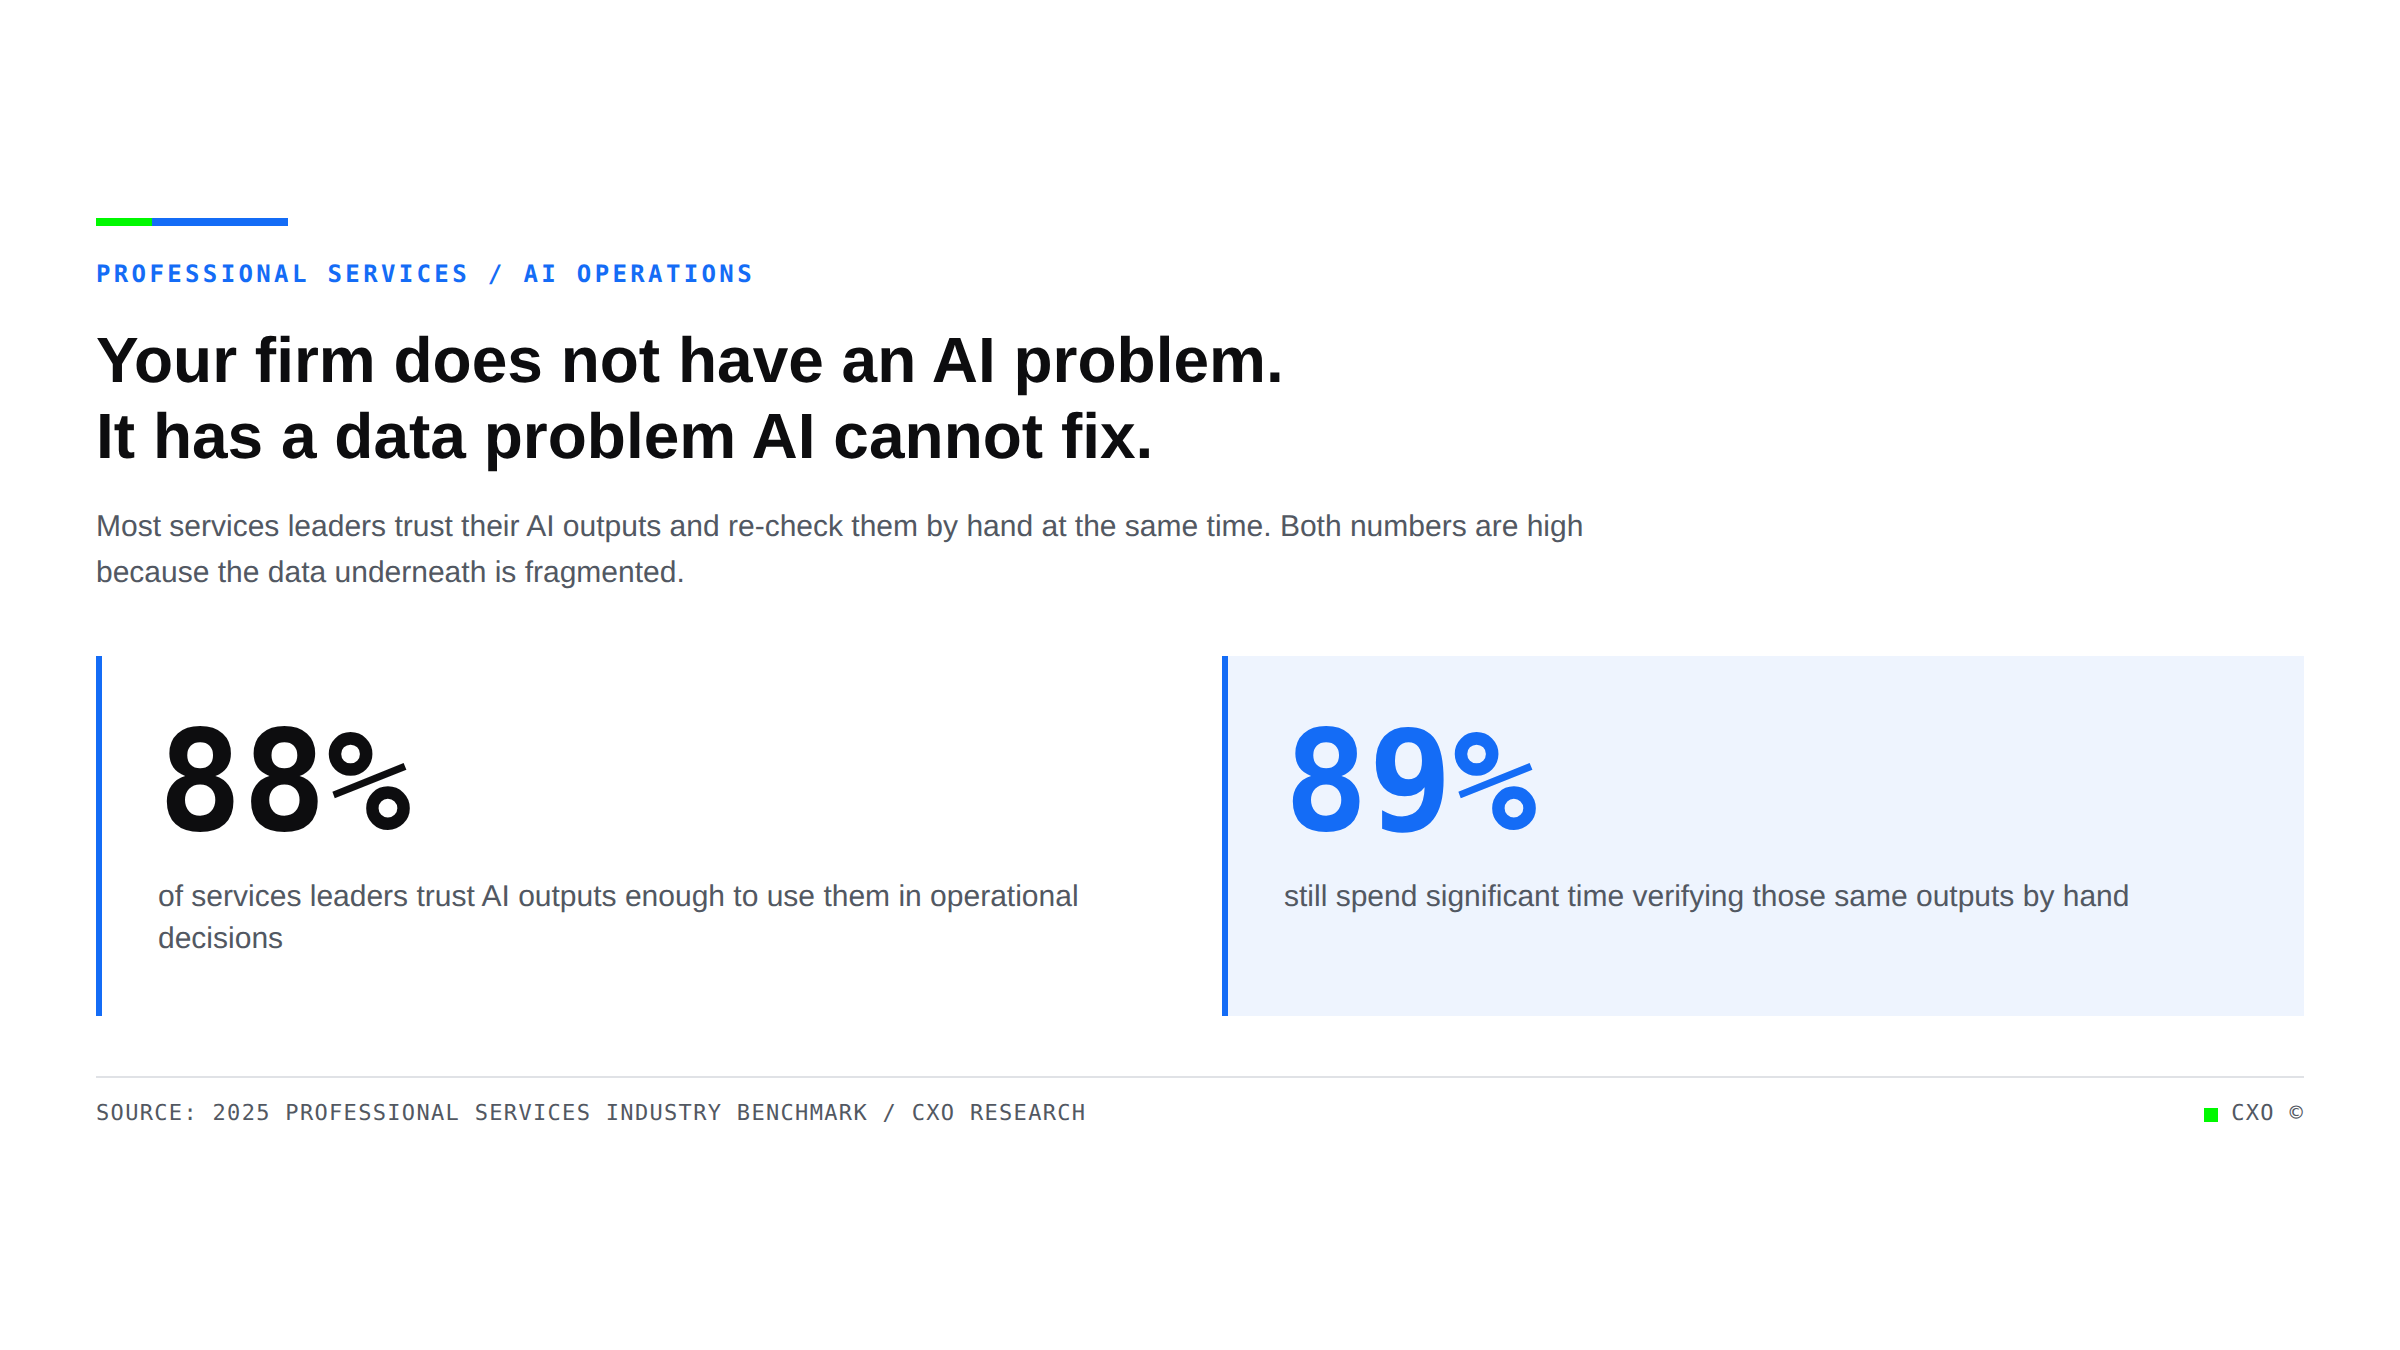
Stat panels showing 88% of services leaders trust AI outputs while 89% still verify them by hand

Your Firm Does Not Have an AI Problem. It Has a Data Problem AI Cannot Fix.

Services firms trust their AI outputs and re-check them by hand at the same time. The constraint is not the tool, it is fragmented data. Here is what actually moves the productivity gap.
View Insight
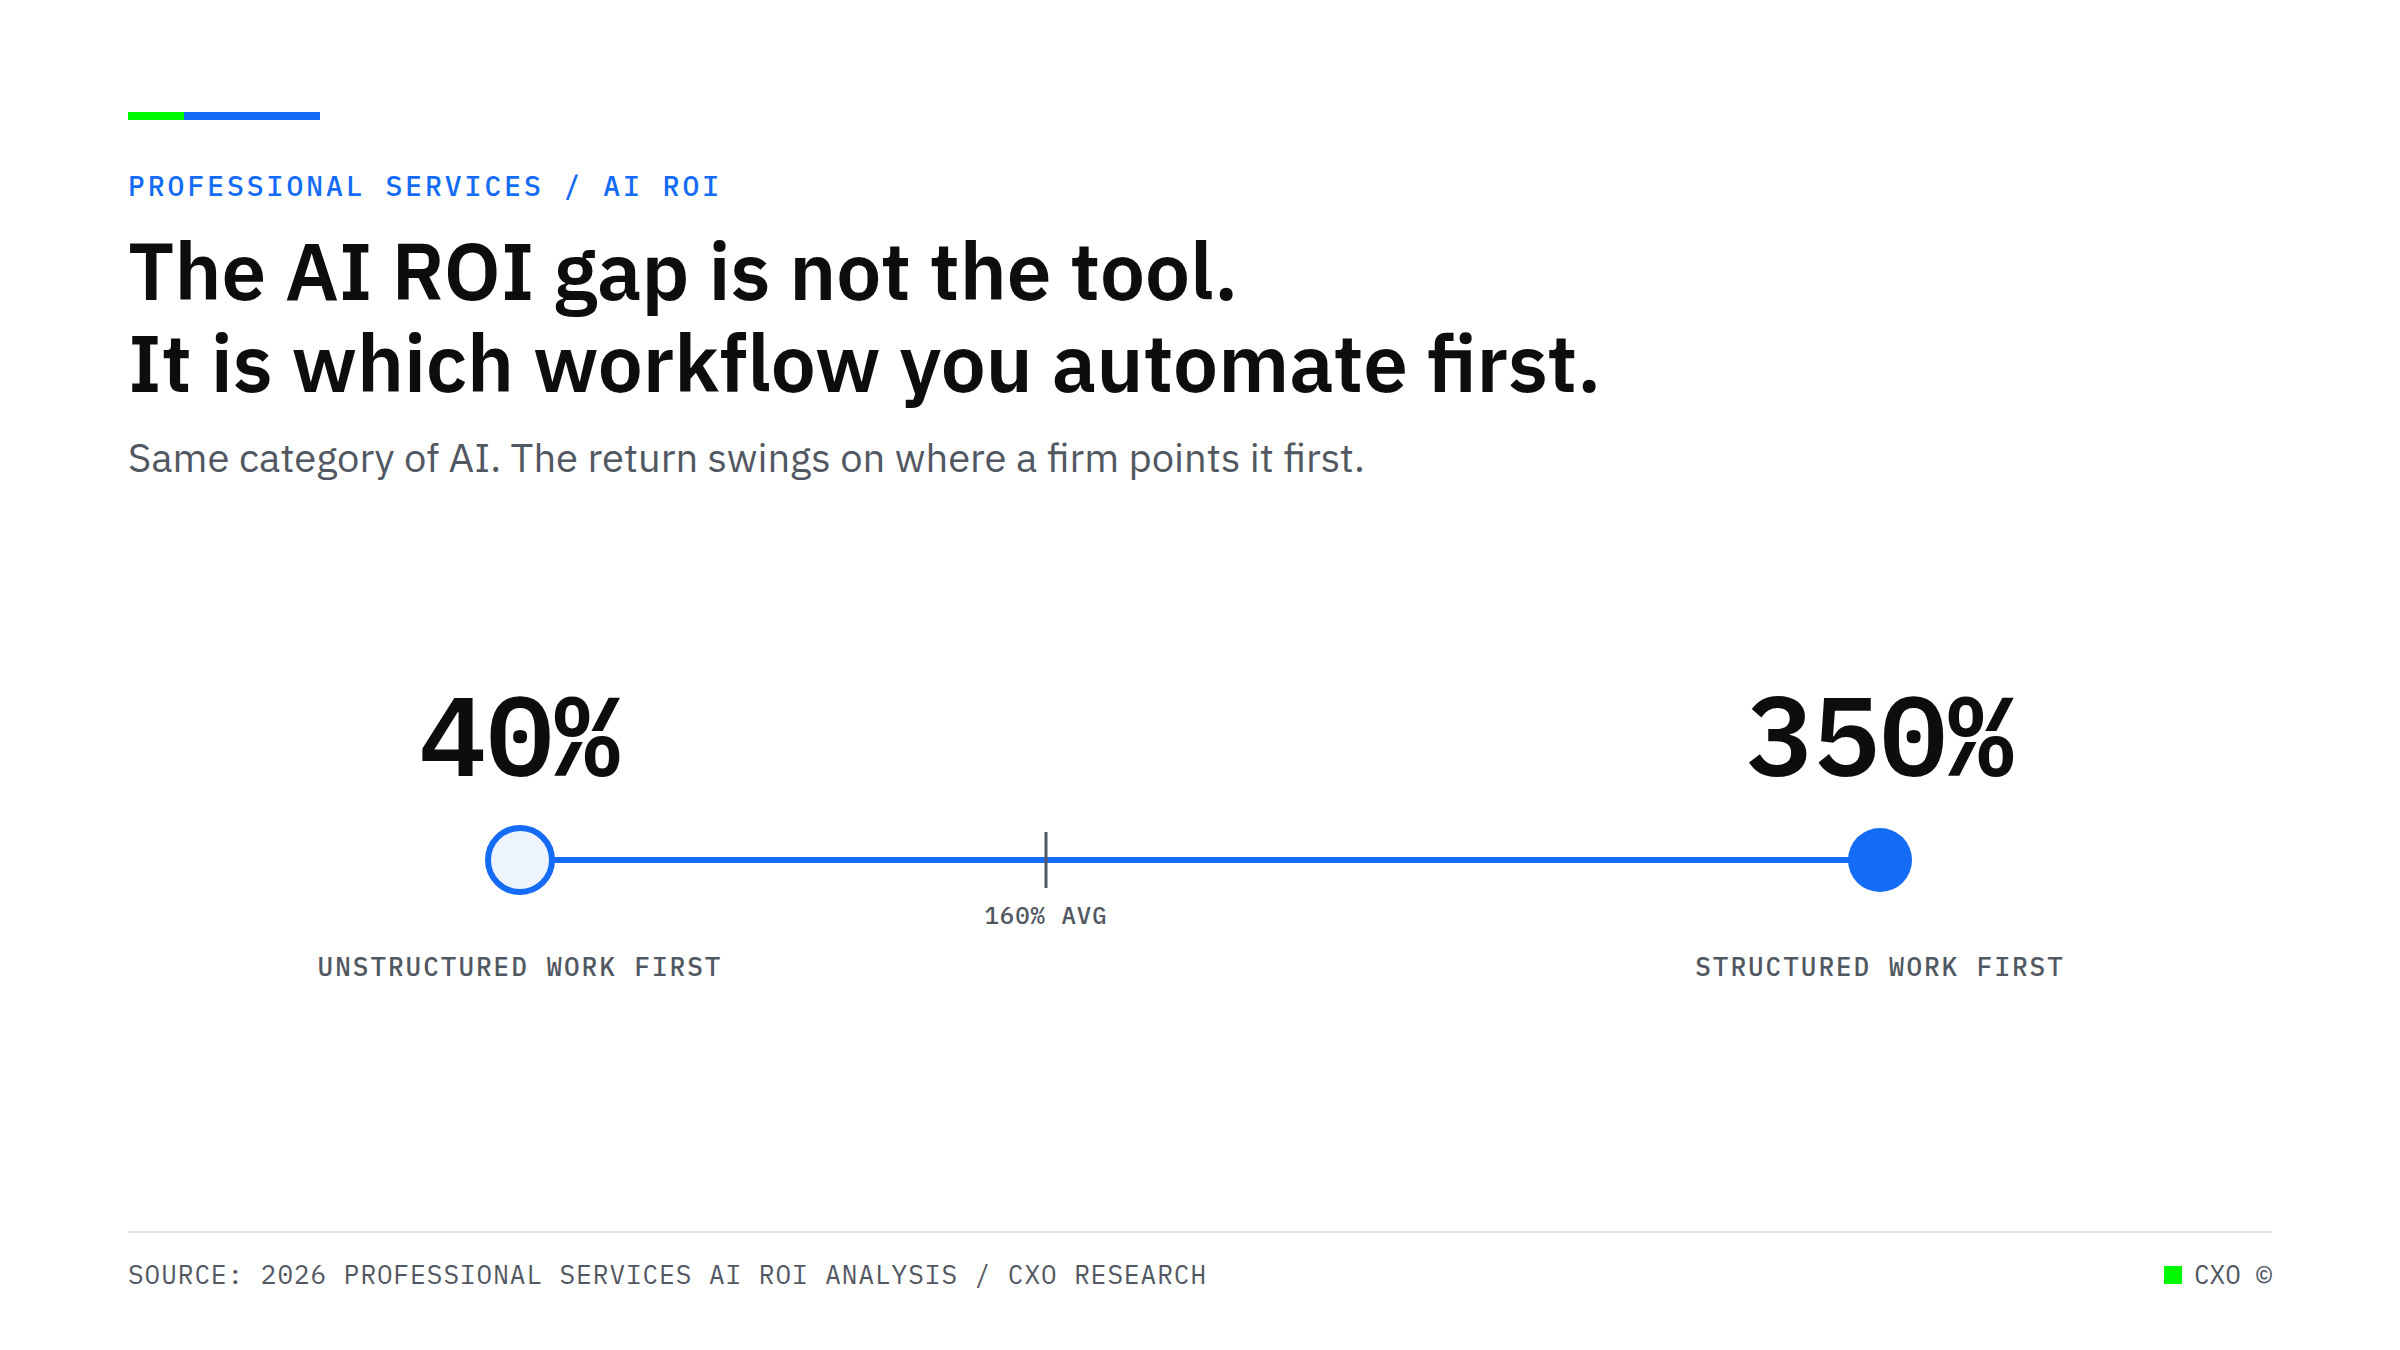
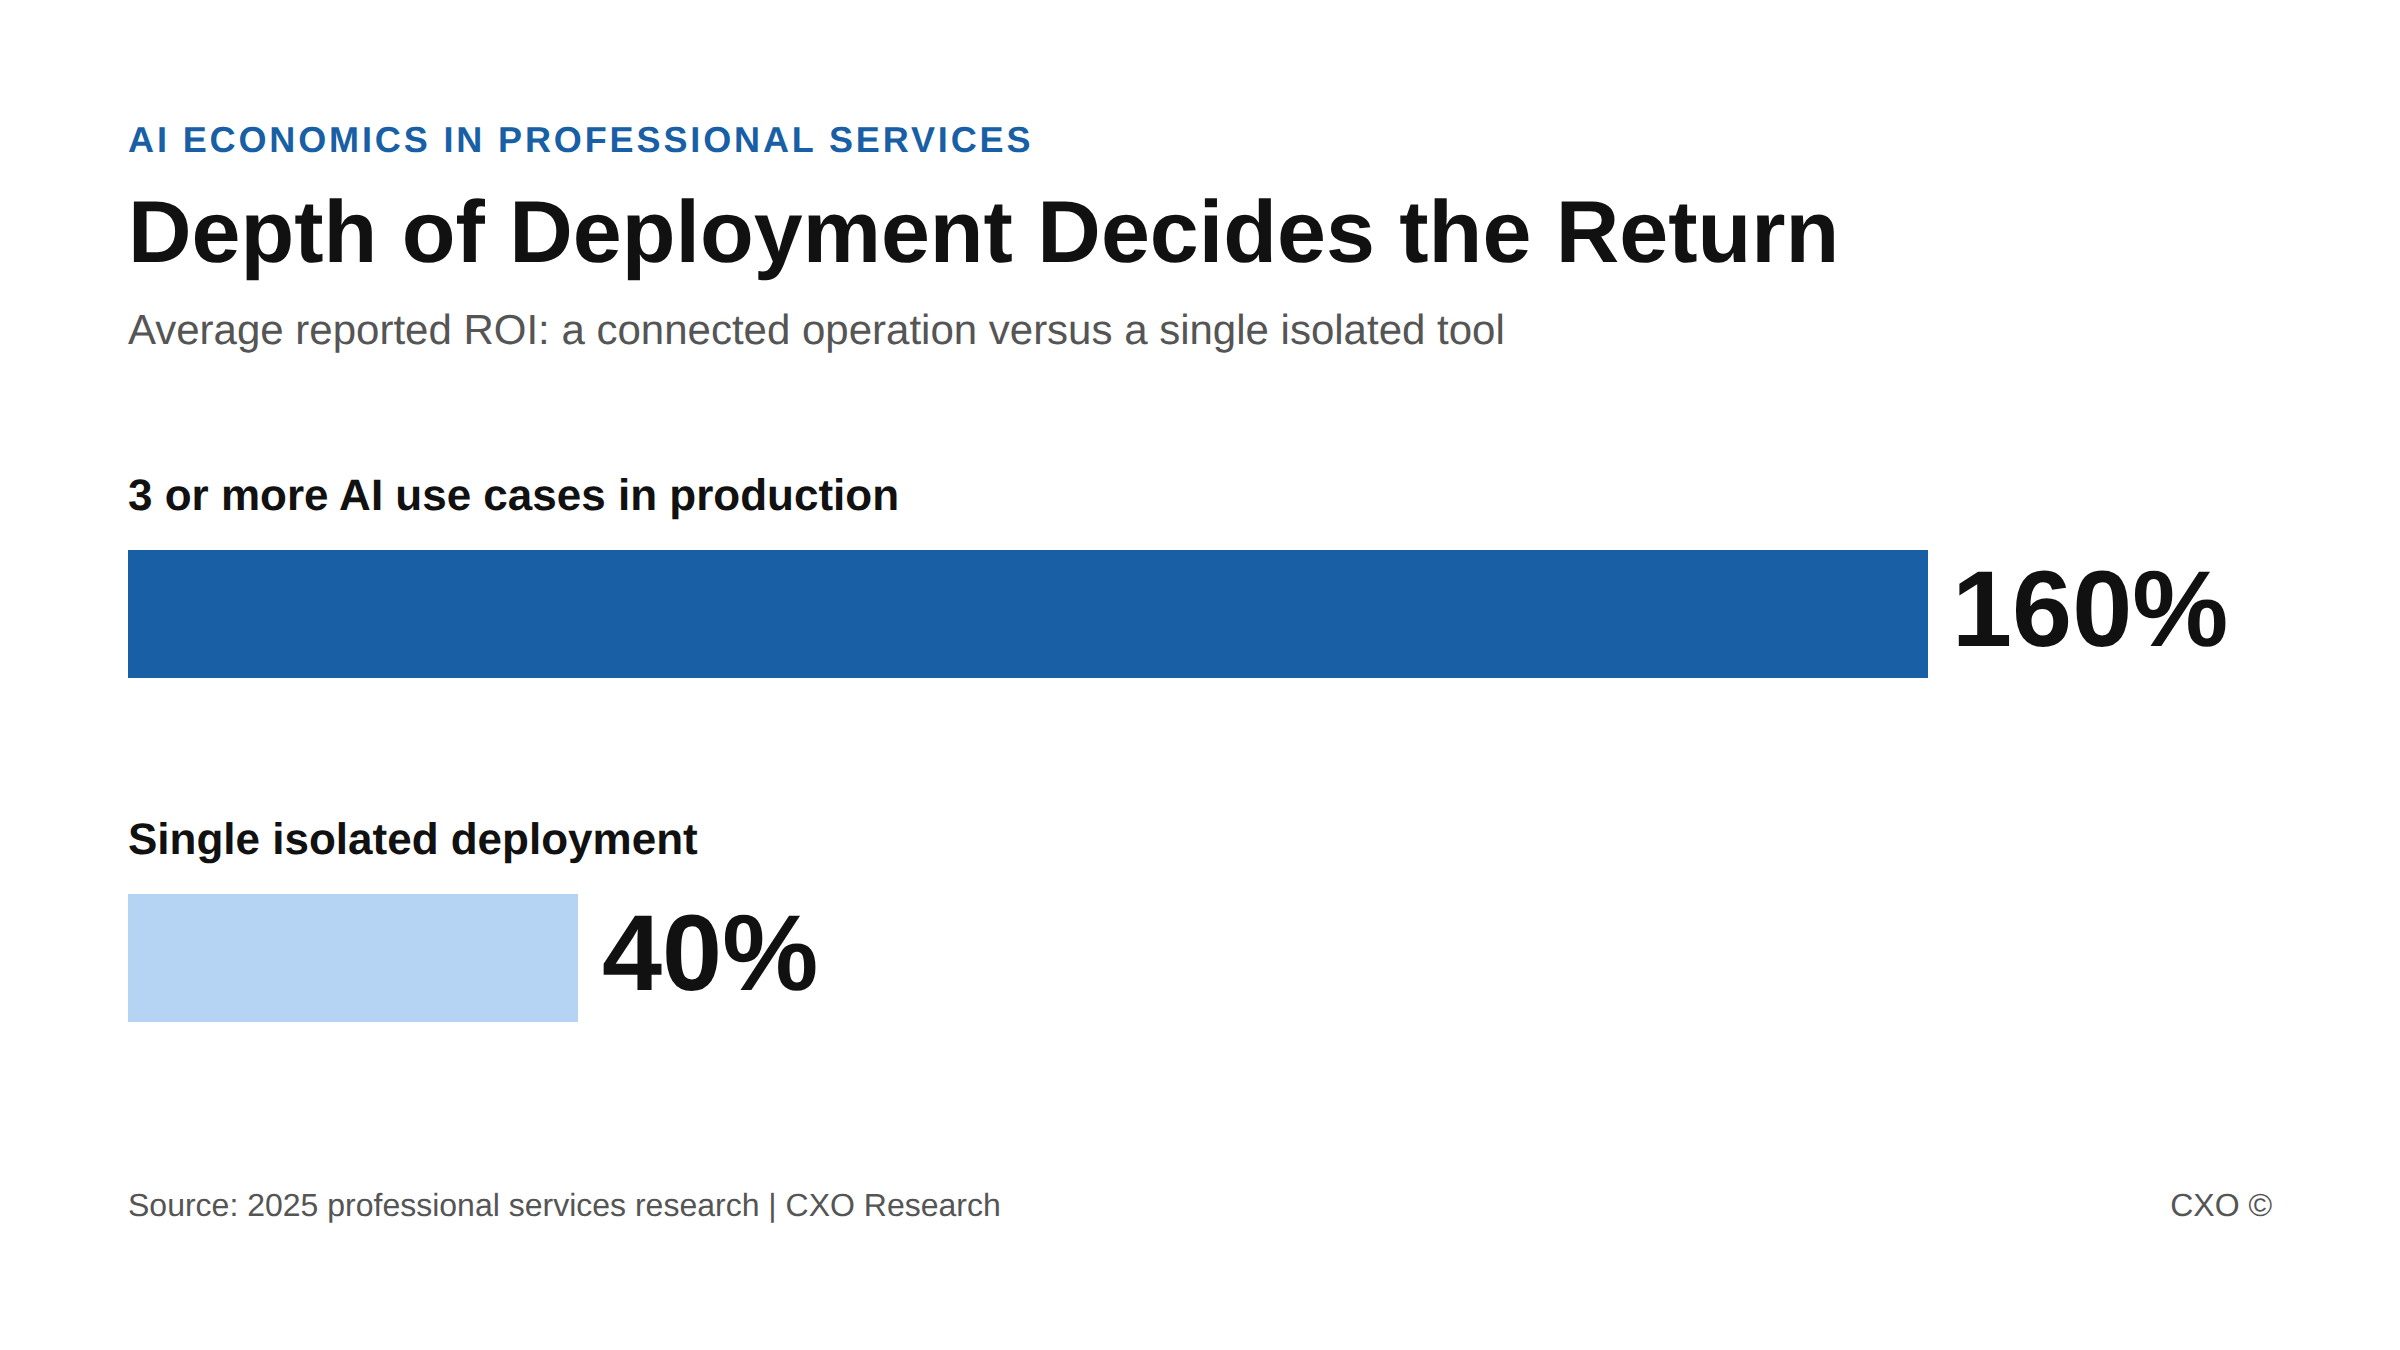
Bar chart showing 160% average ROI for firms with three or more AI use cases in production versus 40% for a single deployment

AI Is Not Killing the Billable Hour. It Is Exposing That You Were Never Selling Hours.

AI is not killing the billable hour. It is exposing that firms were pricing the input, not the outcome. Why margin now moves to the firms that redesign delivery before they touch the rate sheet.
View Insight
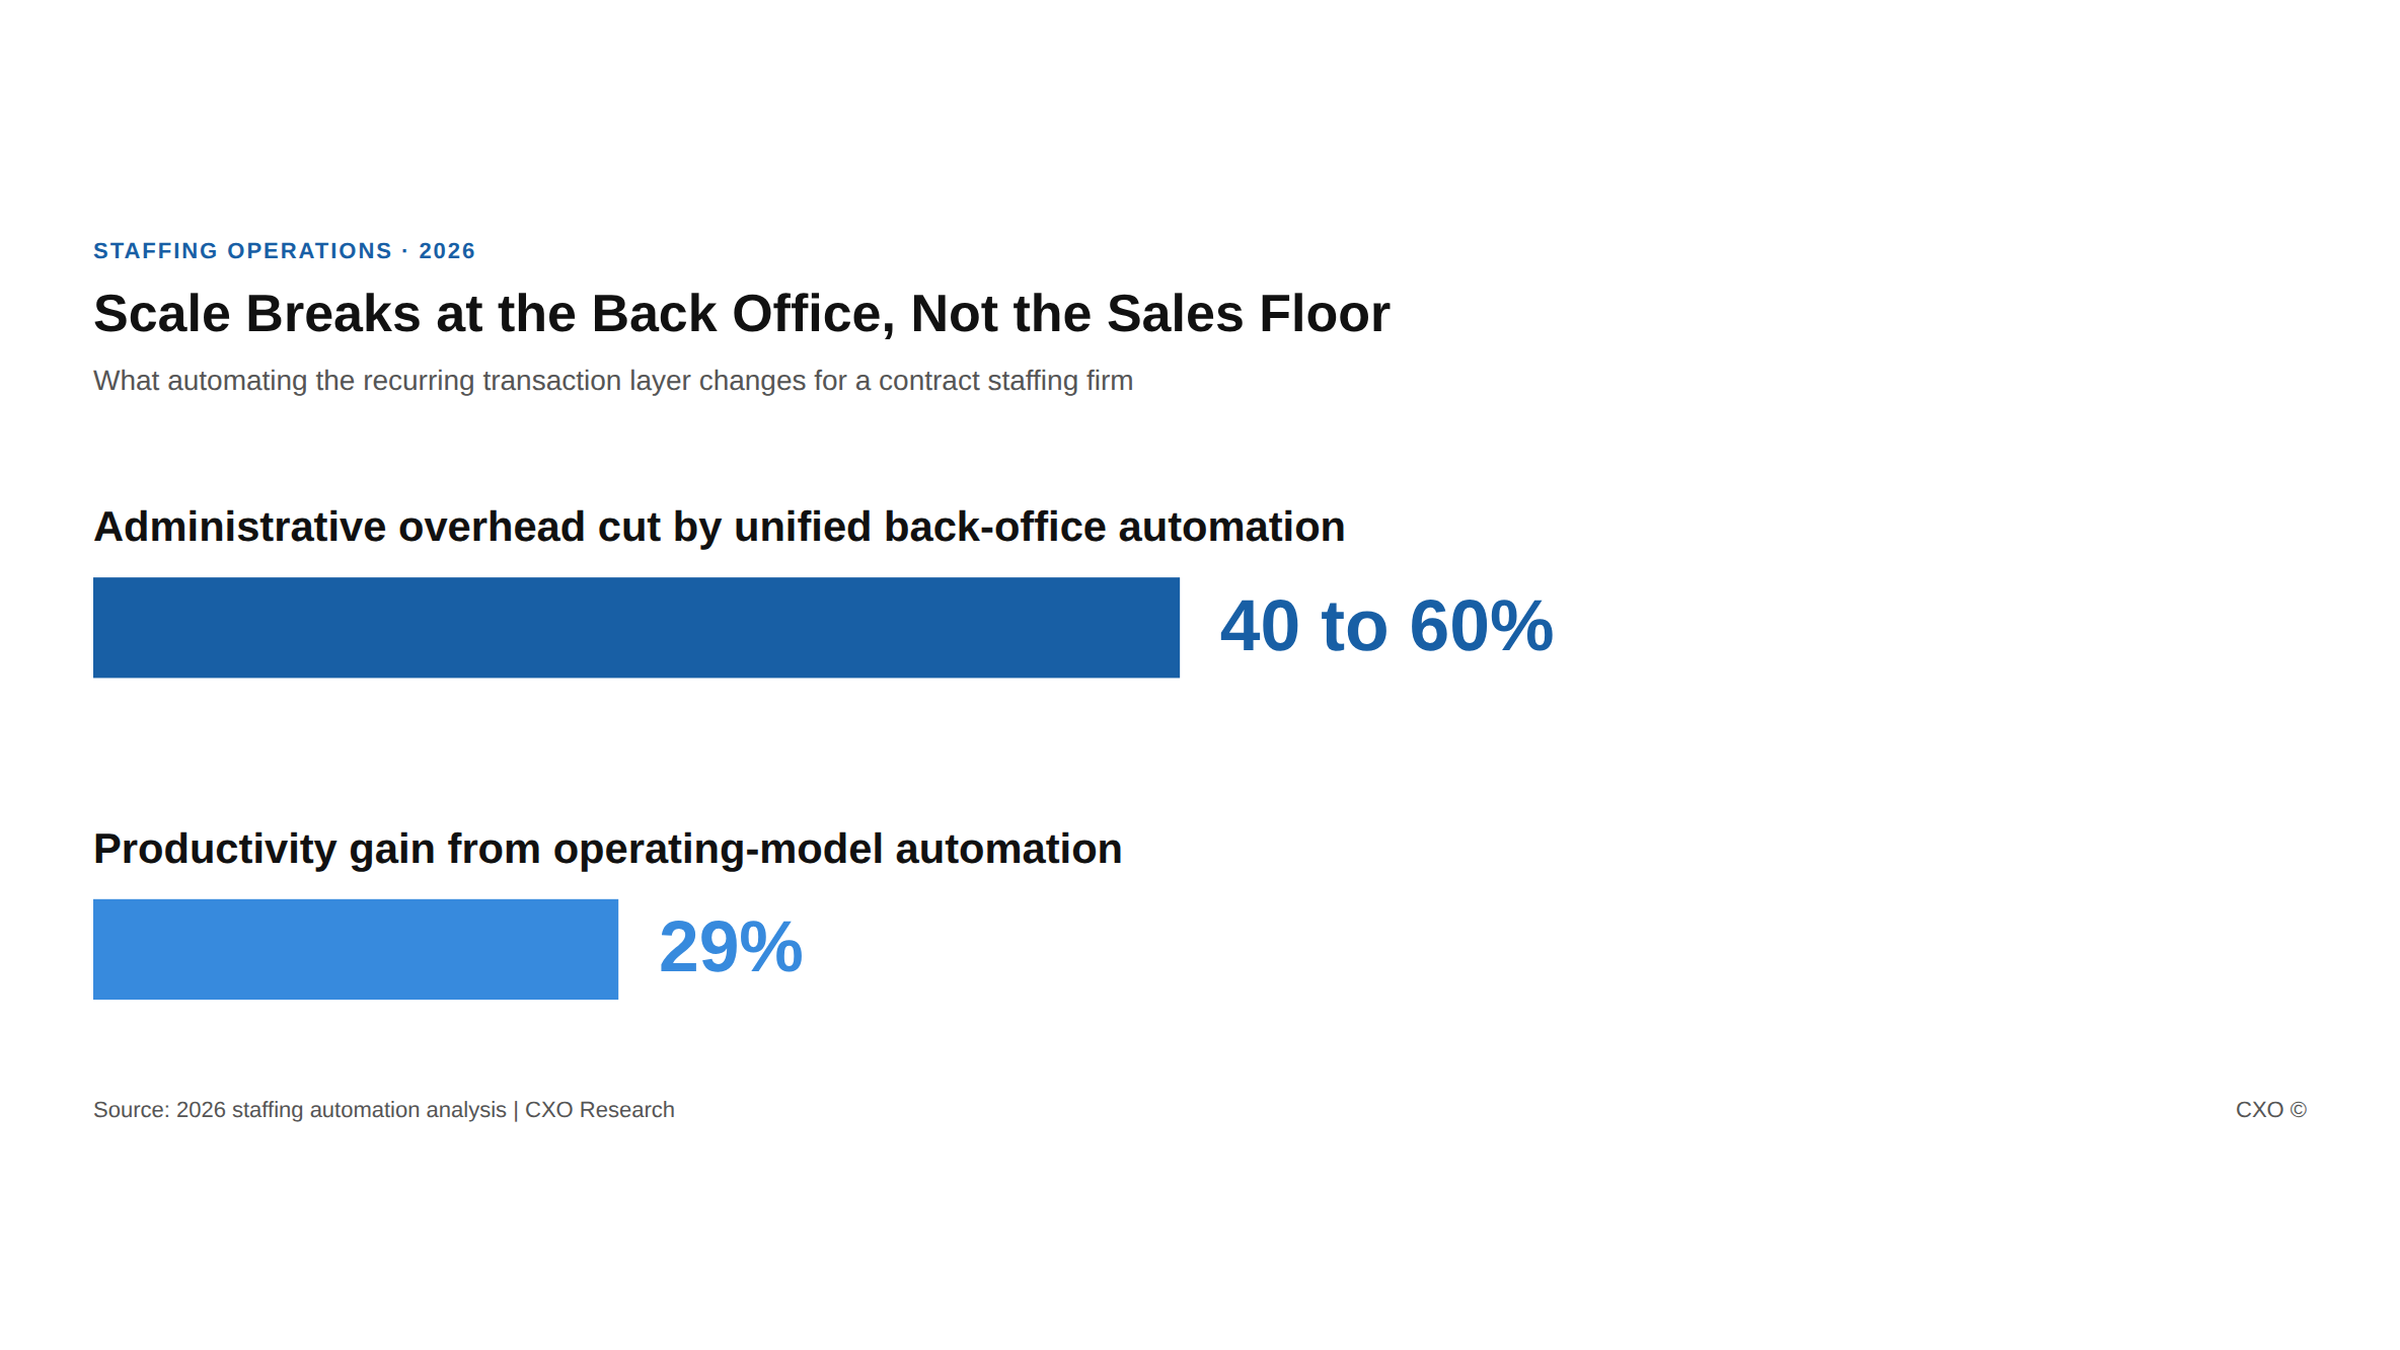
Bar chart showing back-office automation cuts staffing administrative overhead 40 to 60 percent and lifts productivity 29 percent

Contract Staffing Firms Hit a Capacity Wall at Scale. The Ones That Broke Through Automated the Back Office, Not the Sales Floor.

Contract staffing growth multiplies back-office transactions until admin drag caps the firm. See how automating the recurring transaction layer breaks the capacity wall.
View Insight
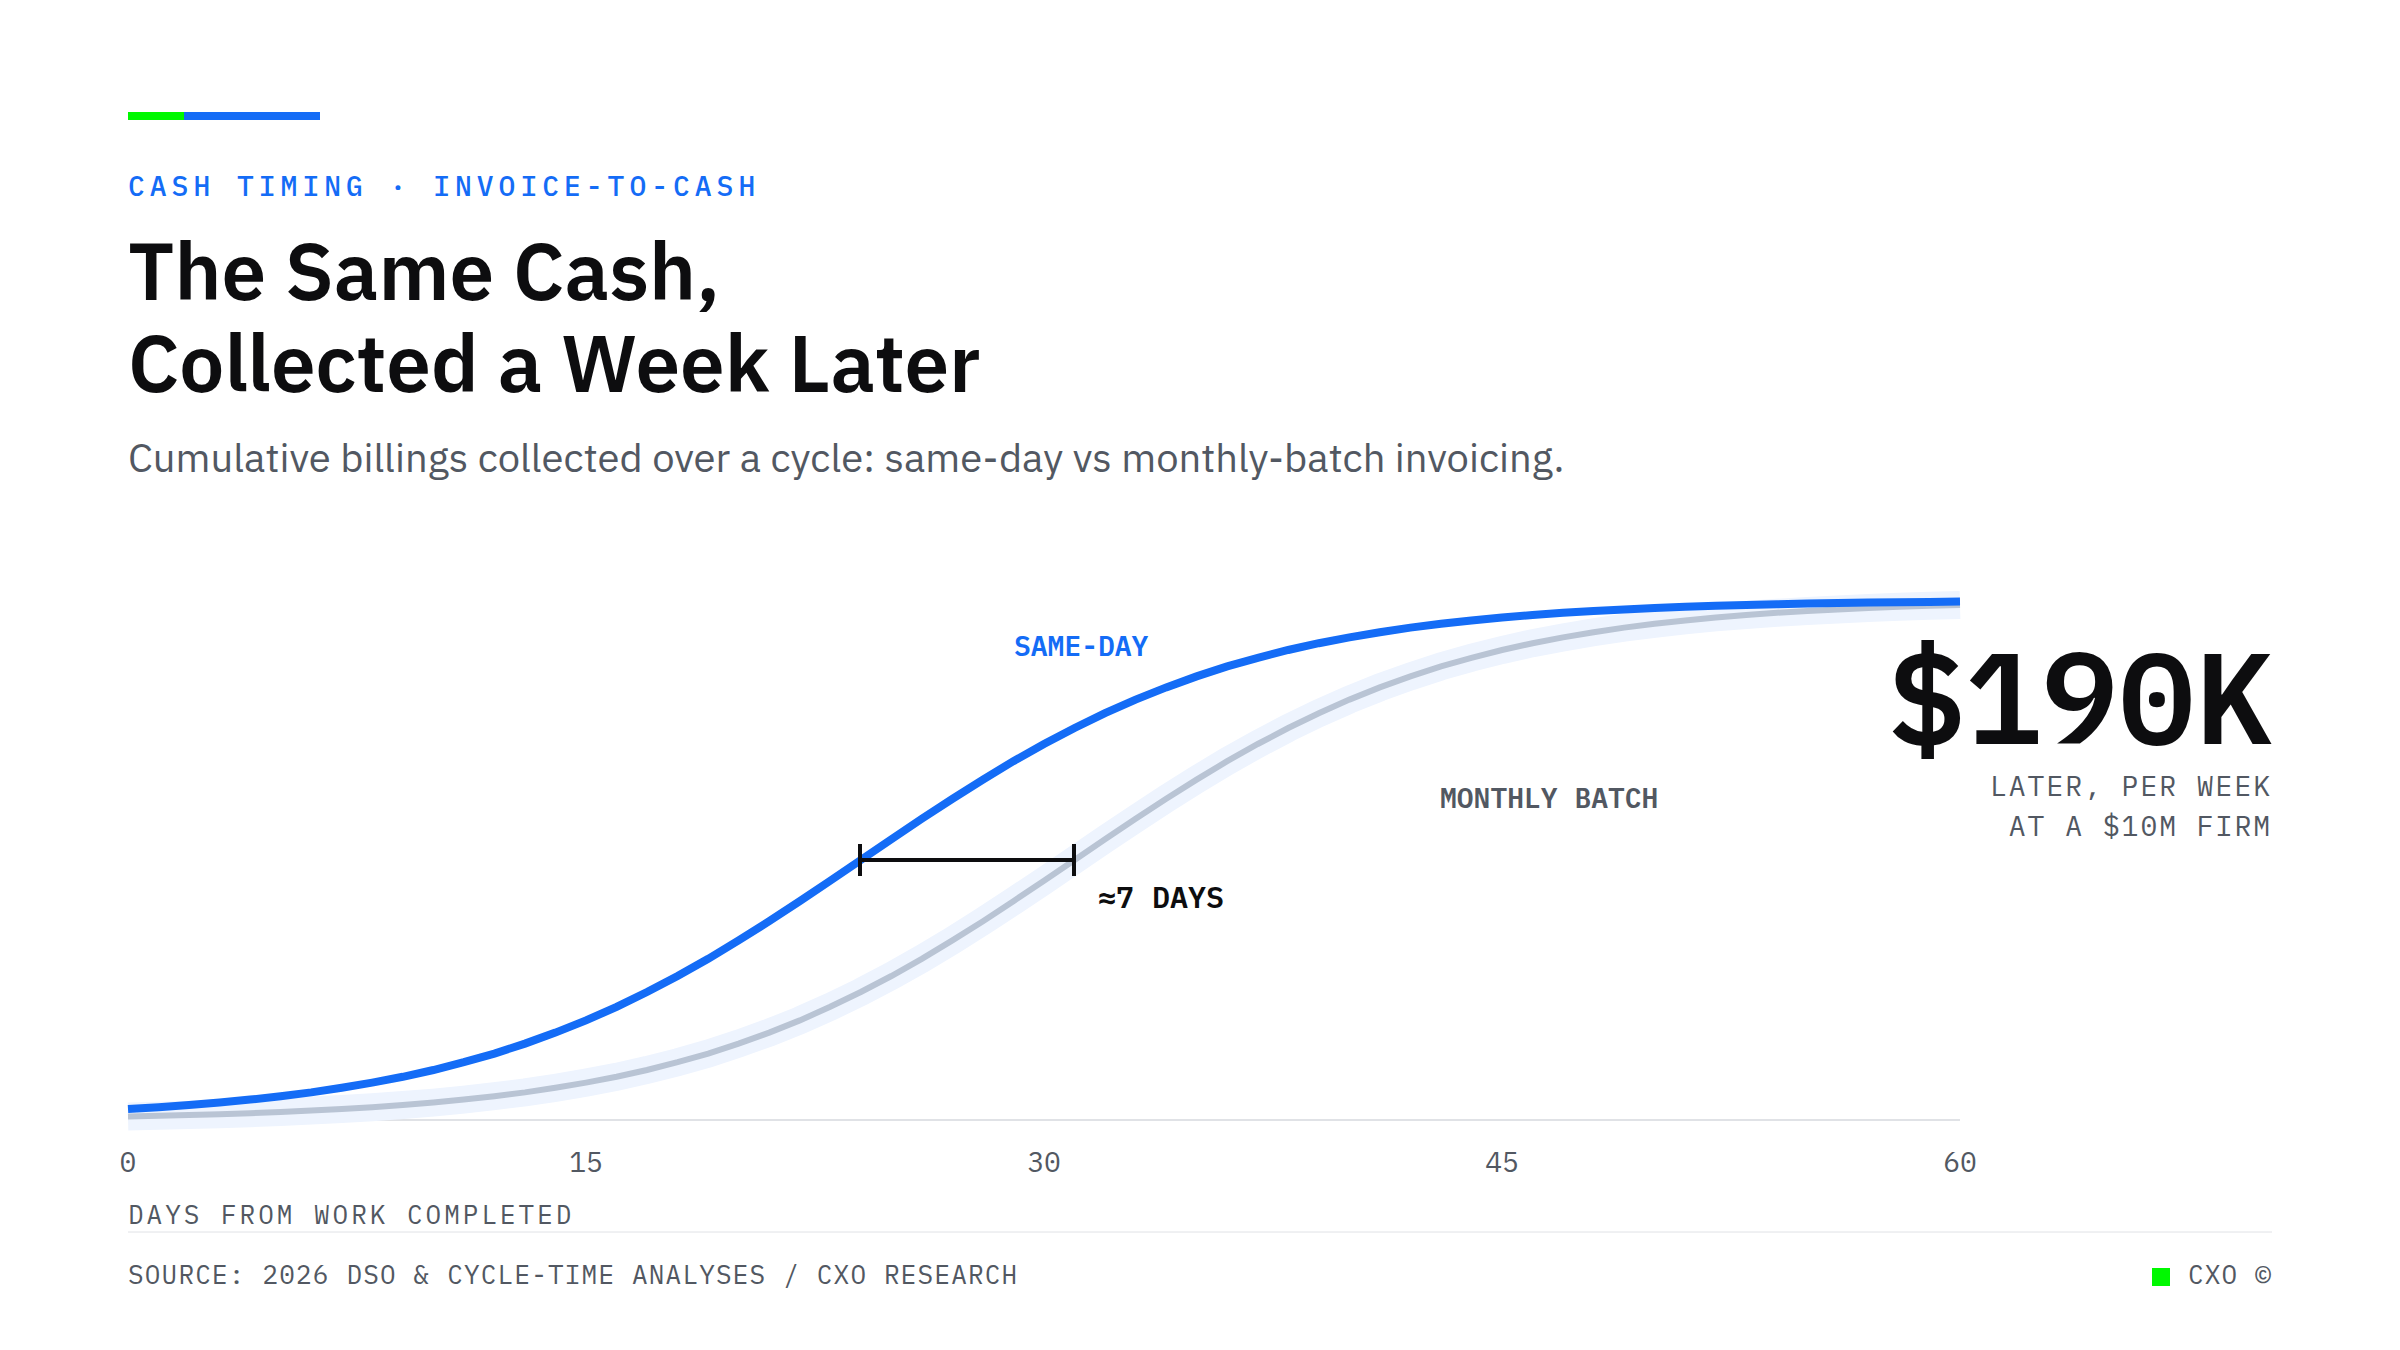
Bar chart showing annual revenue at risk from billing realization gaps at $3M, $5M, and $10M professional services firms

Firms Collect Roughly the Same Per Hour Whether They Discount or Hold Firm. The Leak Is Downstream.

Professional services firms debate rate strategy while losing 12% of revenue downstream. The fix isn't a rate card conversation - it's a collections process.
View Insight
Split bar showing 37 percent of professional services time is billable and 63 percent non-billable, with utilization rising from 66 percent to 75 percent and roughly $1.04M recoverable at a 30-person firm

Your Partners Bill 37% of Their Day. The Other 63% Is Where Your Margin Is Hiding.

Professional services firms bill about 37% of available time while roughly 14 non-billable hours a week per person quietly erode margin. Here is where the money hides and how to reclaim it without hiring.
View Insight
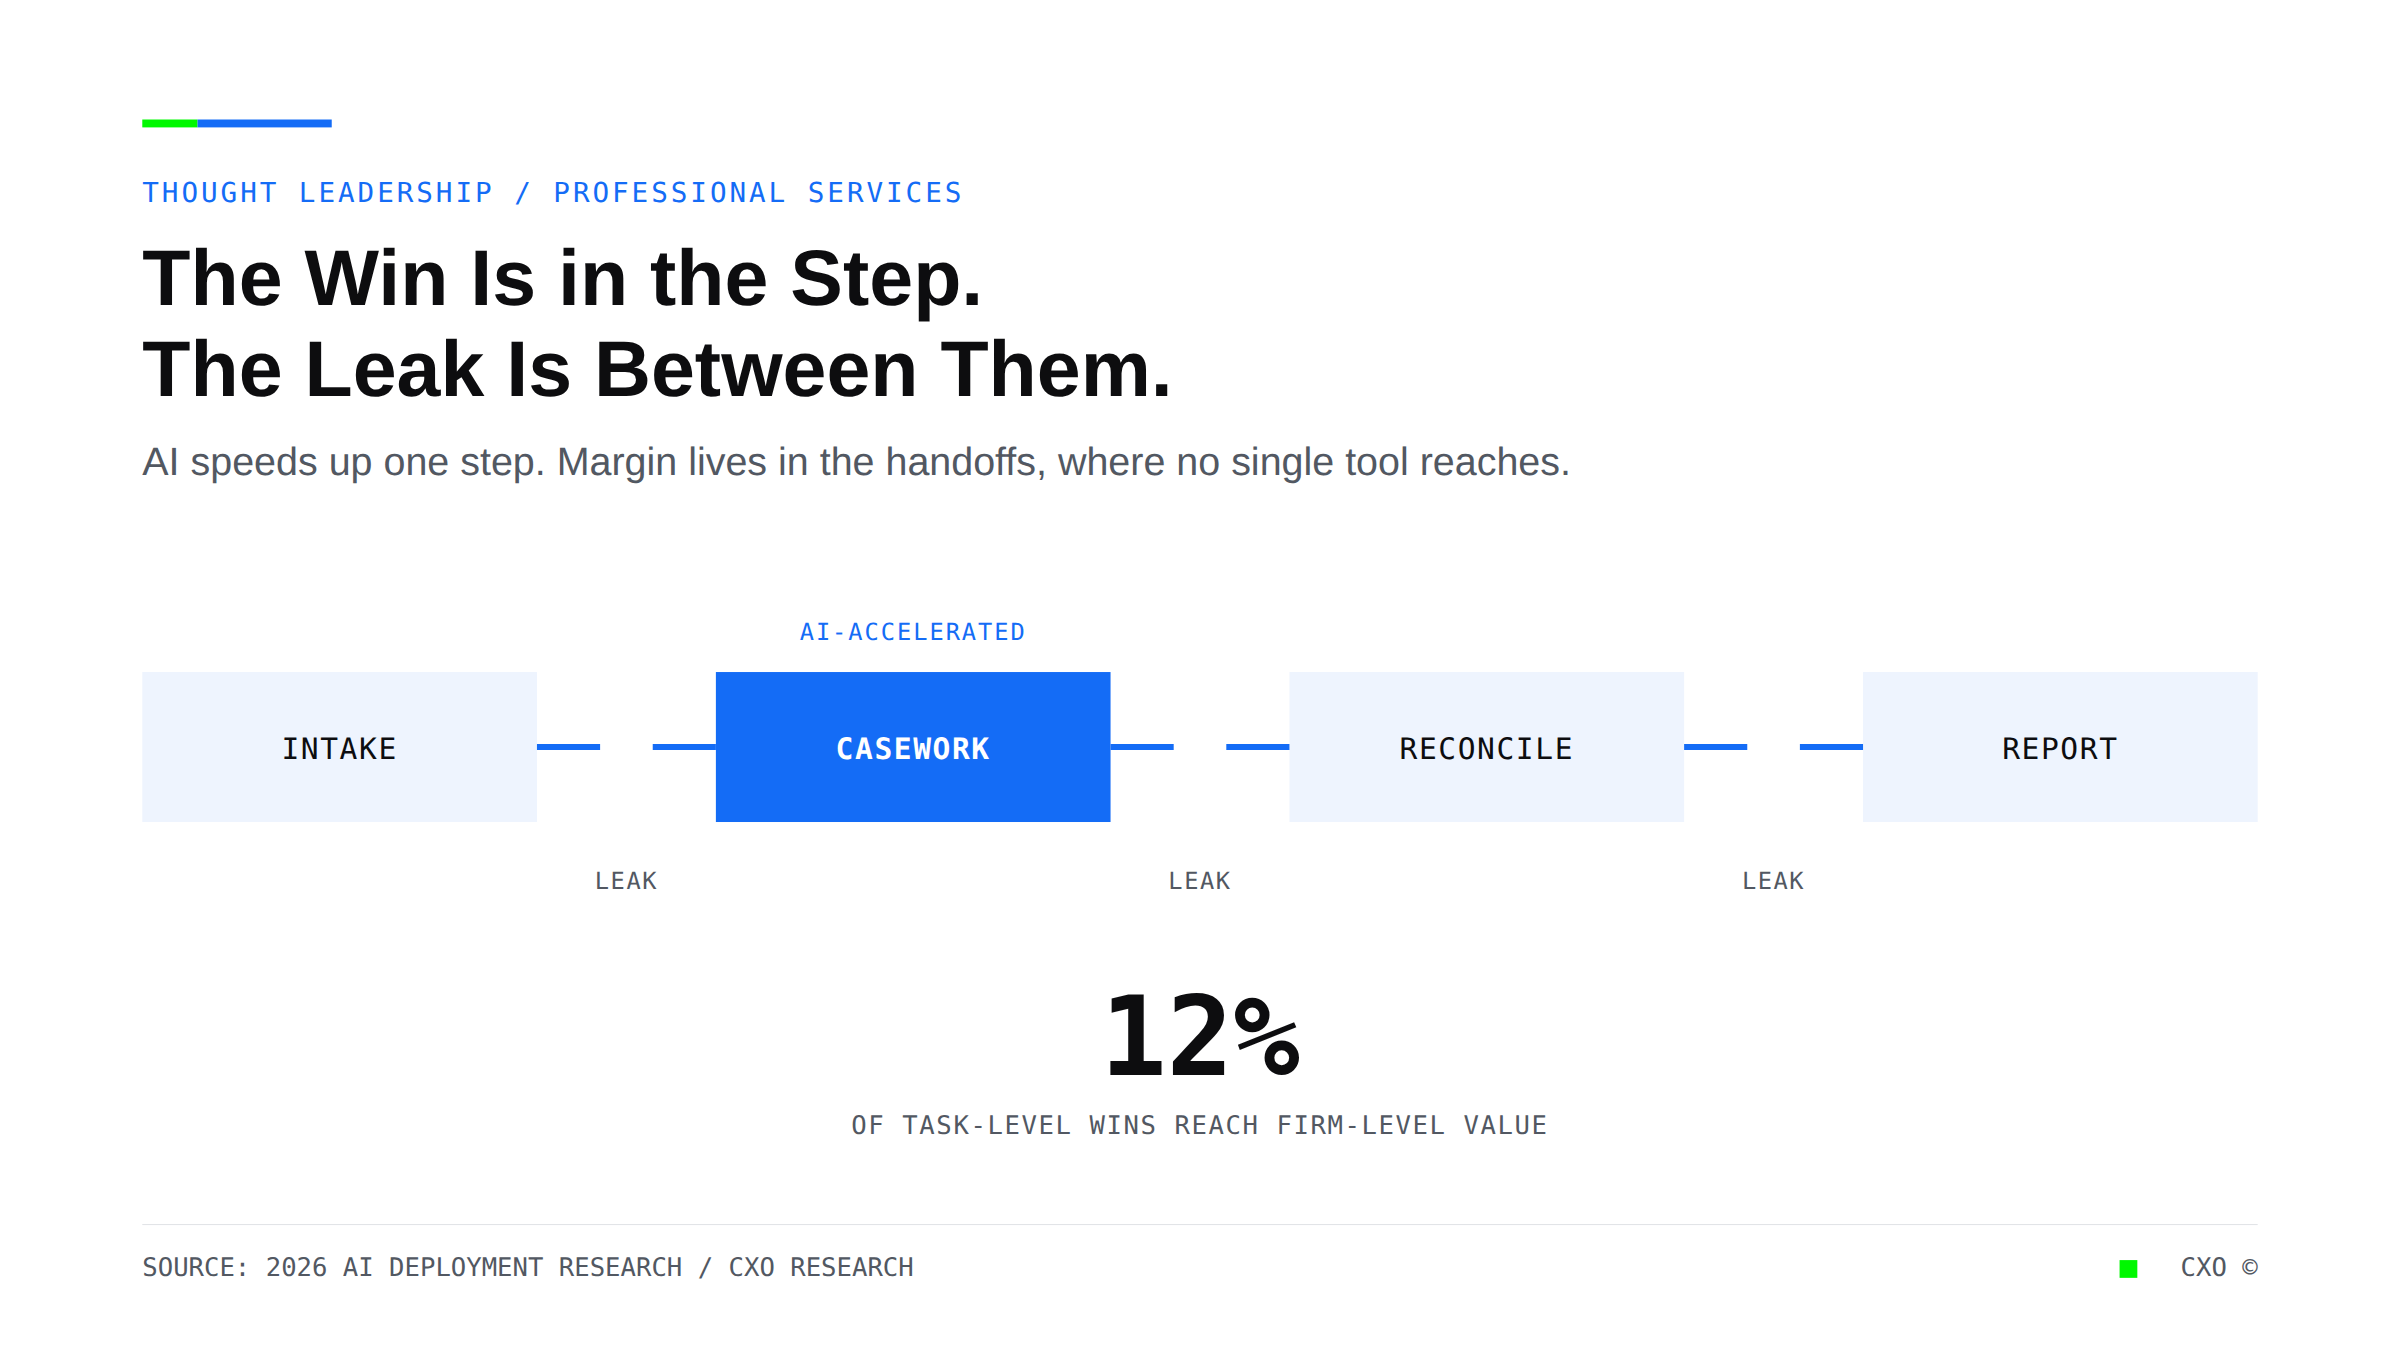
Waterfall chart showing $510,000 in annual revenue lost by a $3M professional services firm through billing write-offs, invoice disputes, and uncollected AR due to process failures.

The Billing System Is Not Broken. The Process Around It Is.

The average professional services firm leaks 8–12% of annual revenue - not from bad clients, but from broken billing processes. Here is what it costs and how to fix it.
View Insight

Ready to put agentic AI to work?

See where automation can take the manual, repetitive work off your team. Book a discovery call and we'll map the highest-impact processes in your operation.

Book a discovery call