Tag

agentic workflow automation

18 insights

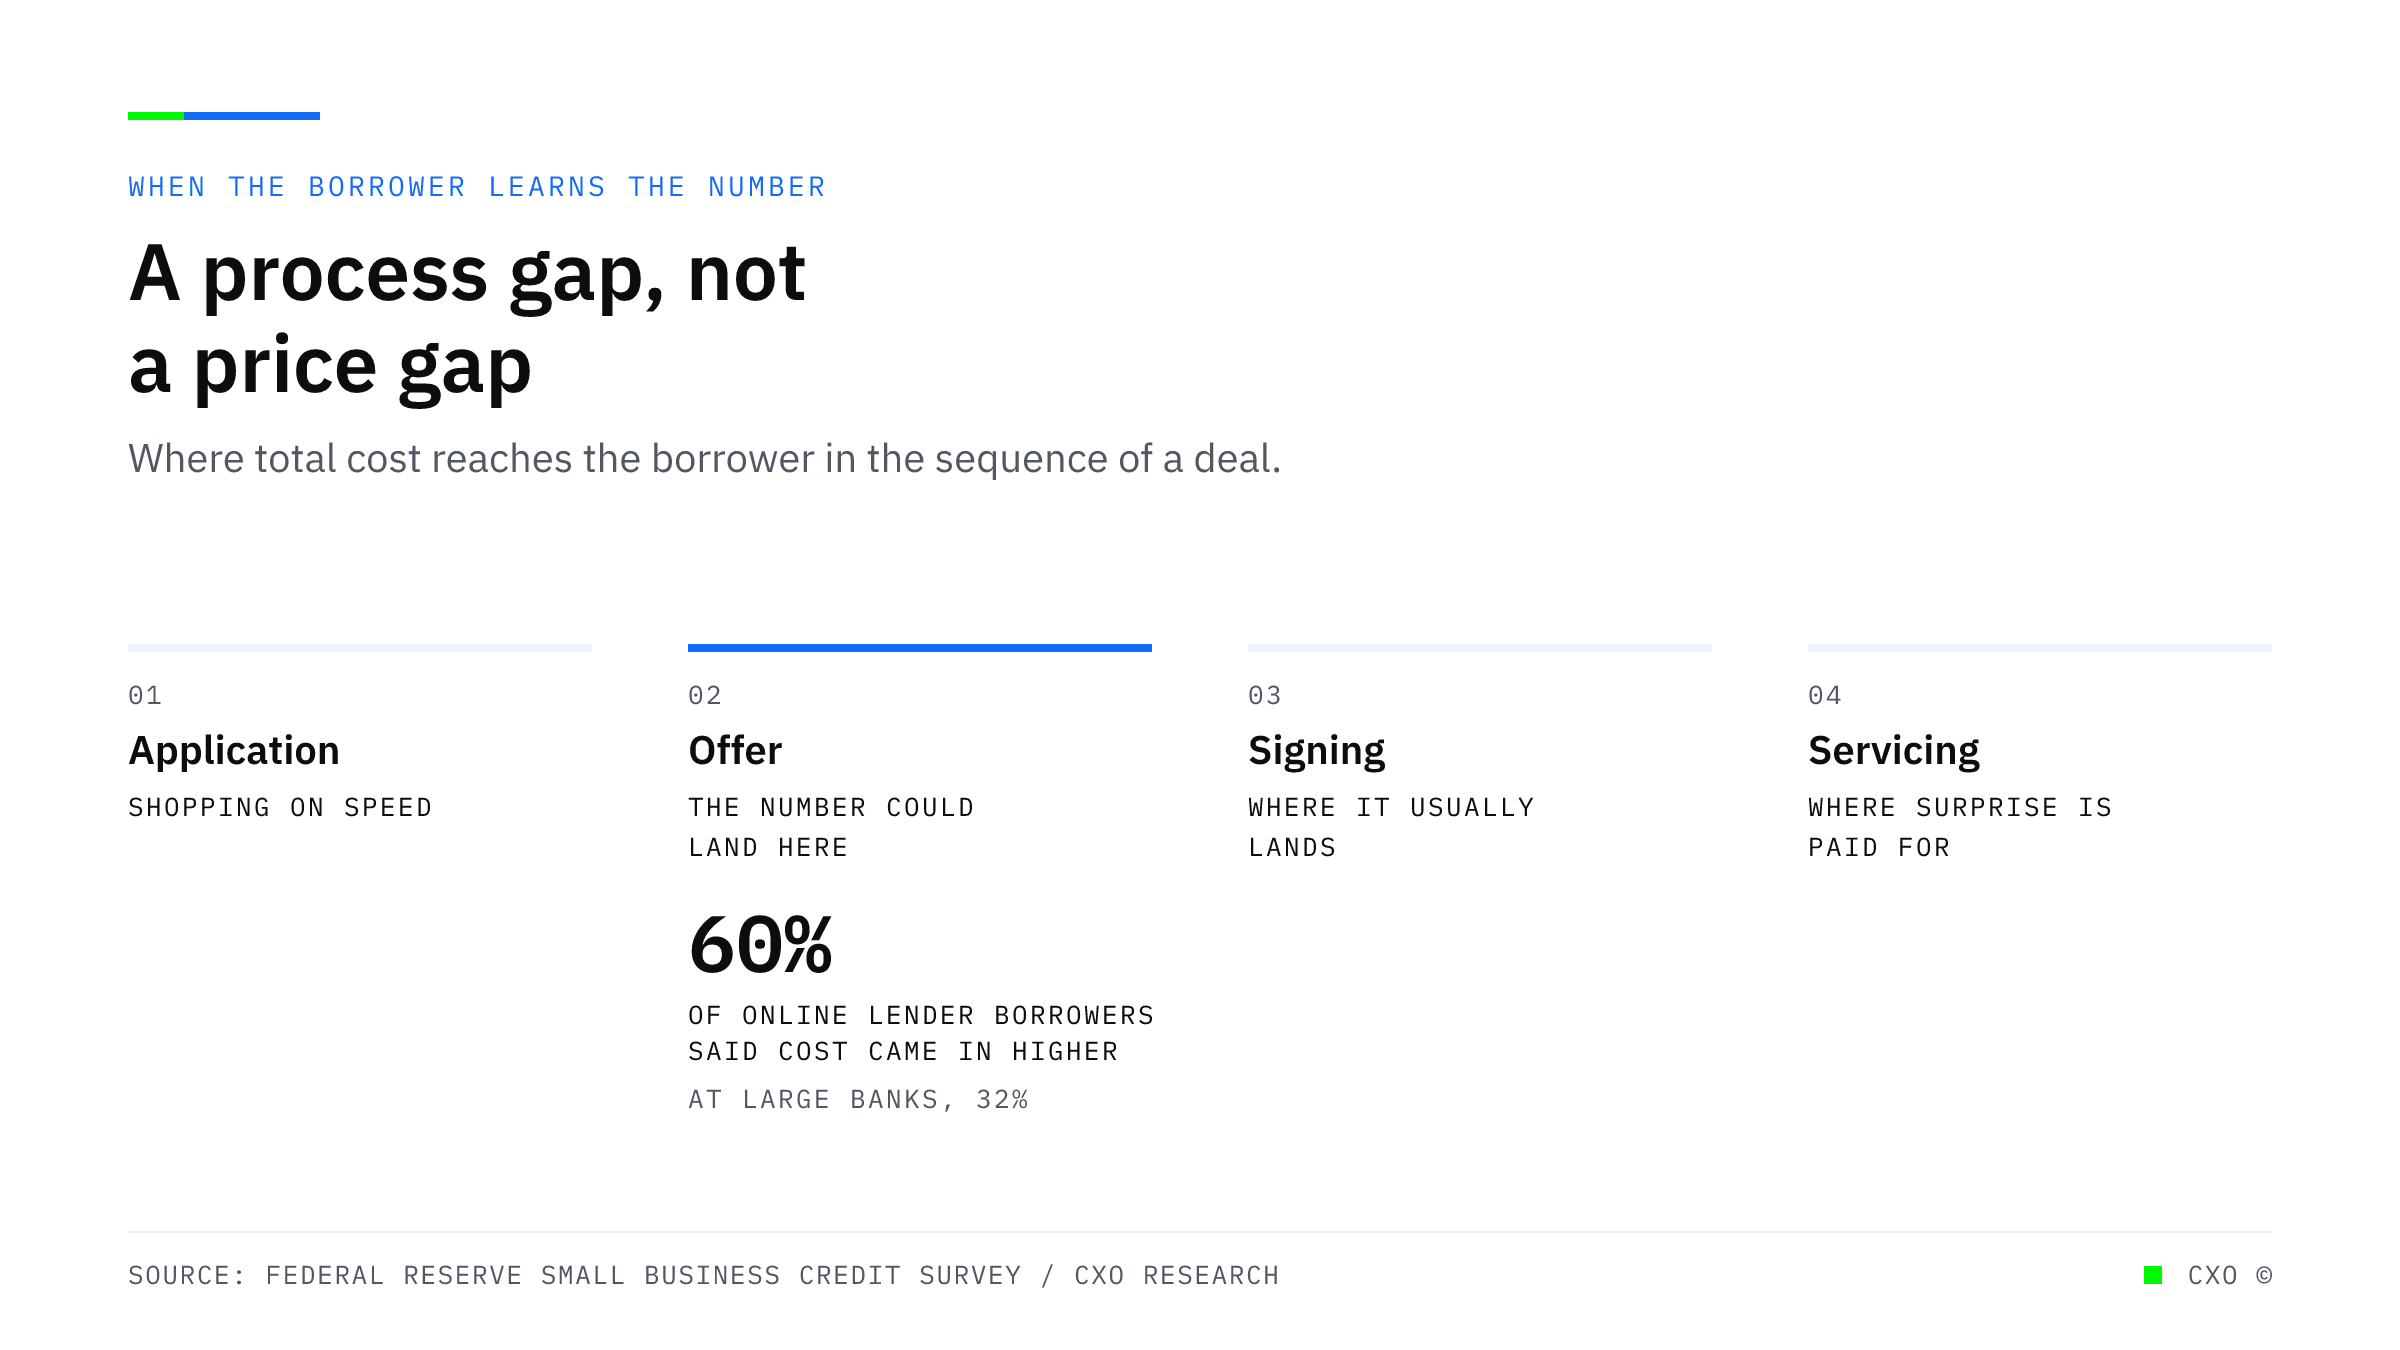
A labelled diagram of four stages in a borrower's path, marking the offer as the point where the total cost could be disclosed, against 60 percent of online lender borrowers reporting costs higher than expected and 32 percent at large banks.

Sixty Percent of Your Borrowers Were Surprised by the Cost. At Banks It Is Thirty-Two.

The same borrowers, the same market, a 28 point gap in whether the cost landed as expected. That difference is produced by process, which means it can be closed without touching price.
View Insight
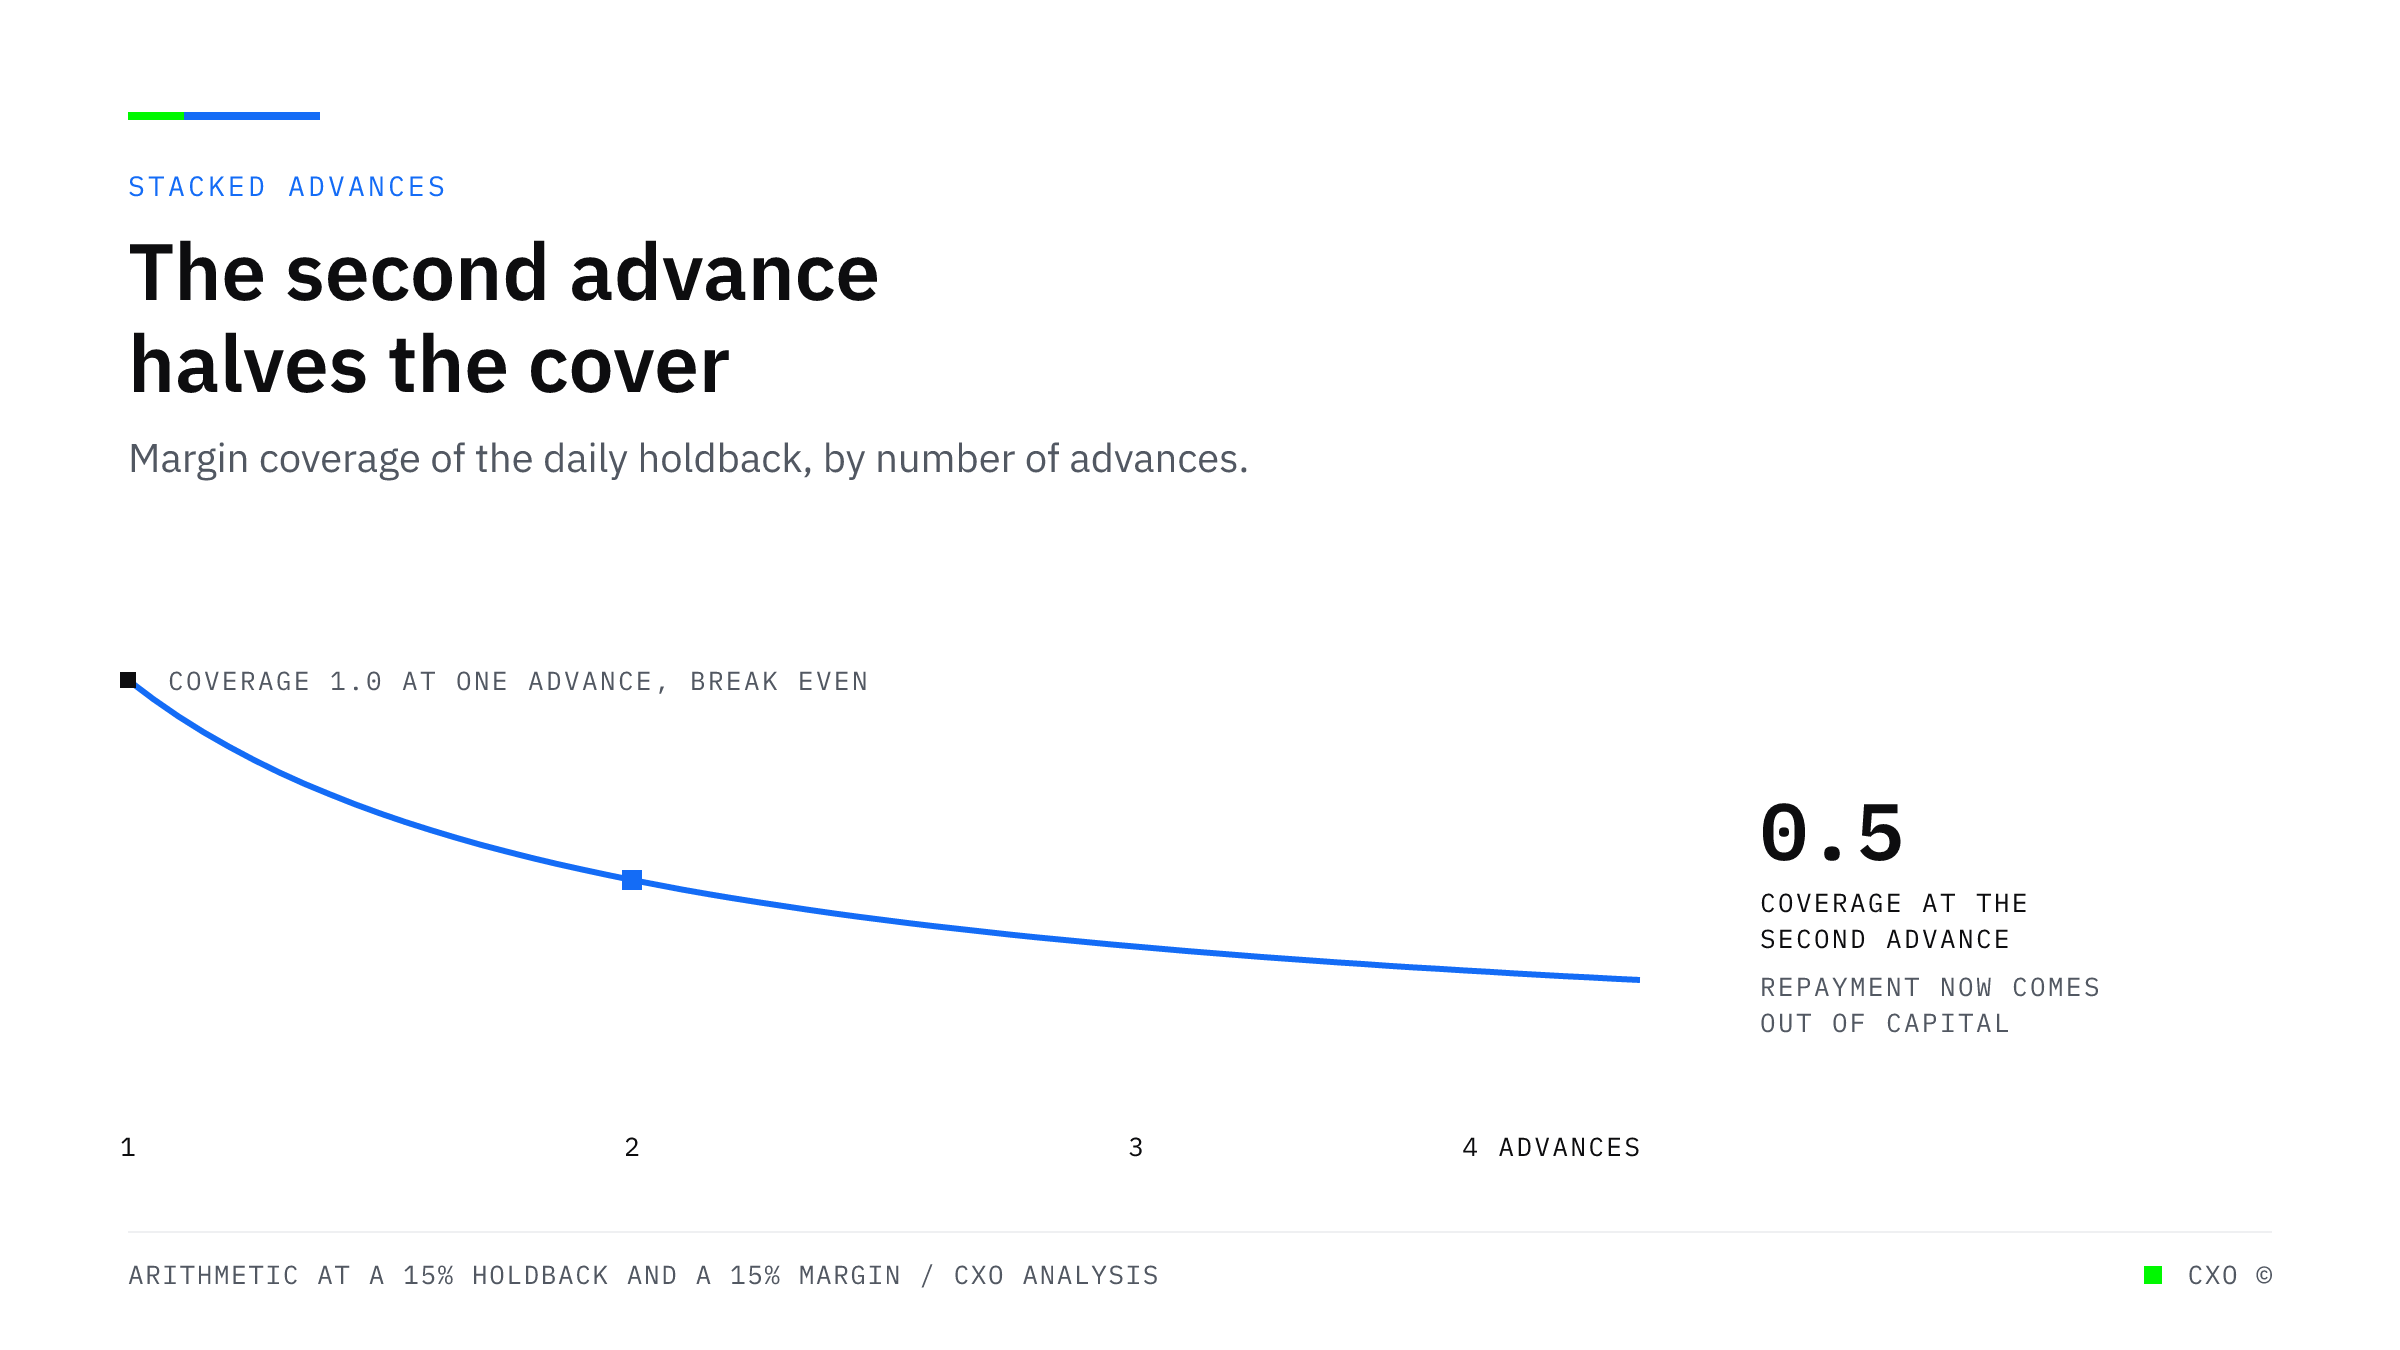
A falling curve showing how a merchant's margin coverage of their daily holdback collapses as advances stack, passing below the break-even threshold at the second advance.

Every Lender in a Stacked Position Underwrote It Correctly

One advance takes 10 to 20 percent of daily receipts. Two or more take 30 to 40. Each funder assessed the file in front of it, and the position that kills the merchant exists only across files.
View Insight
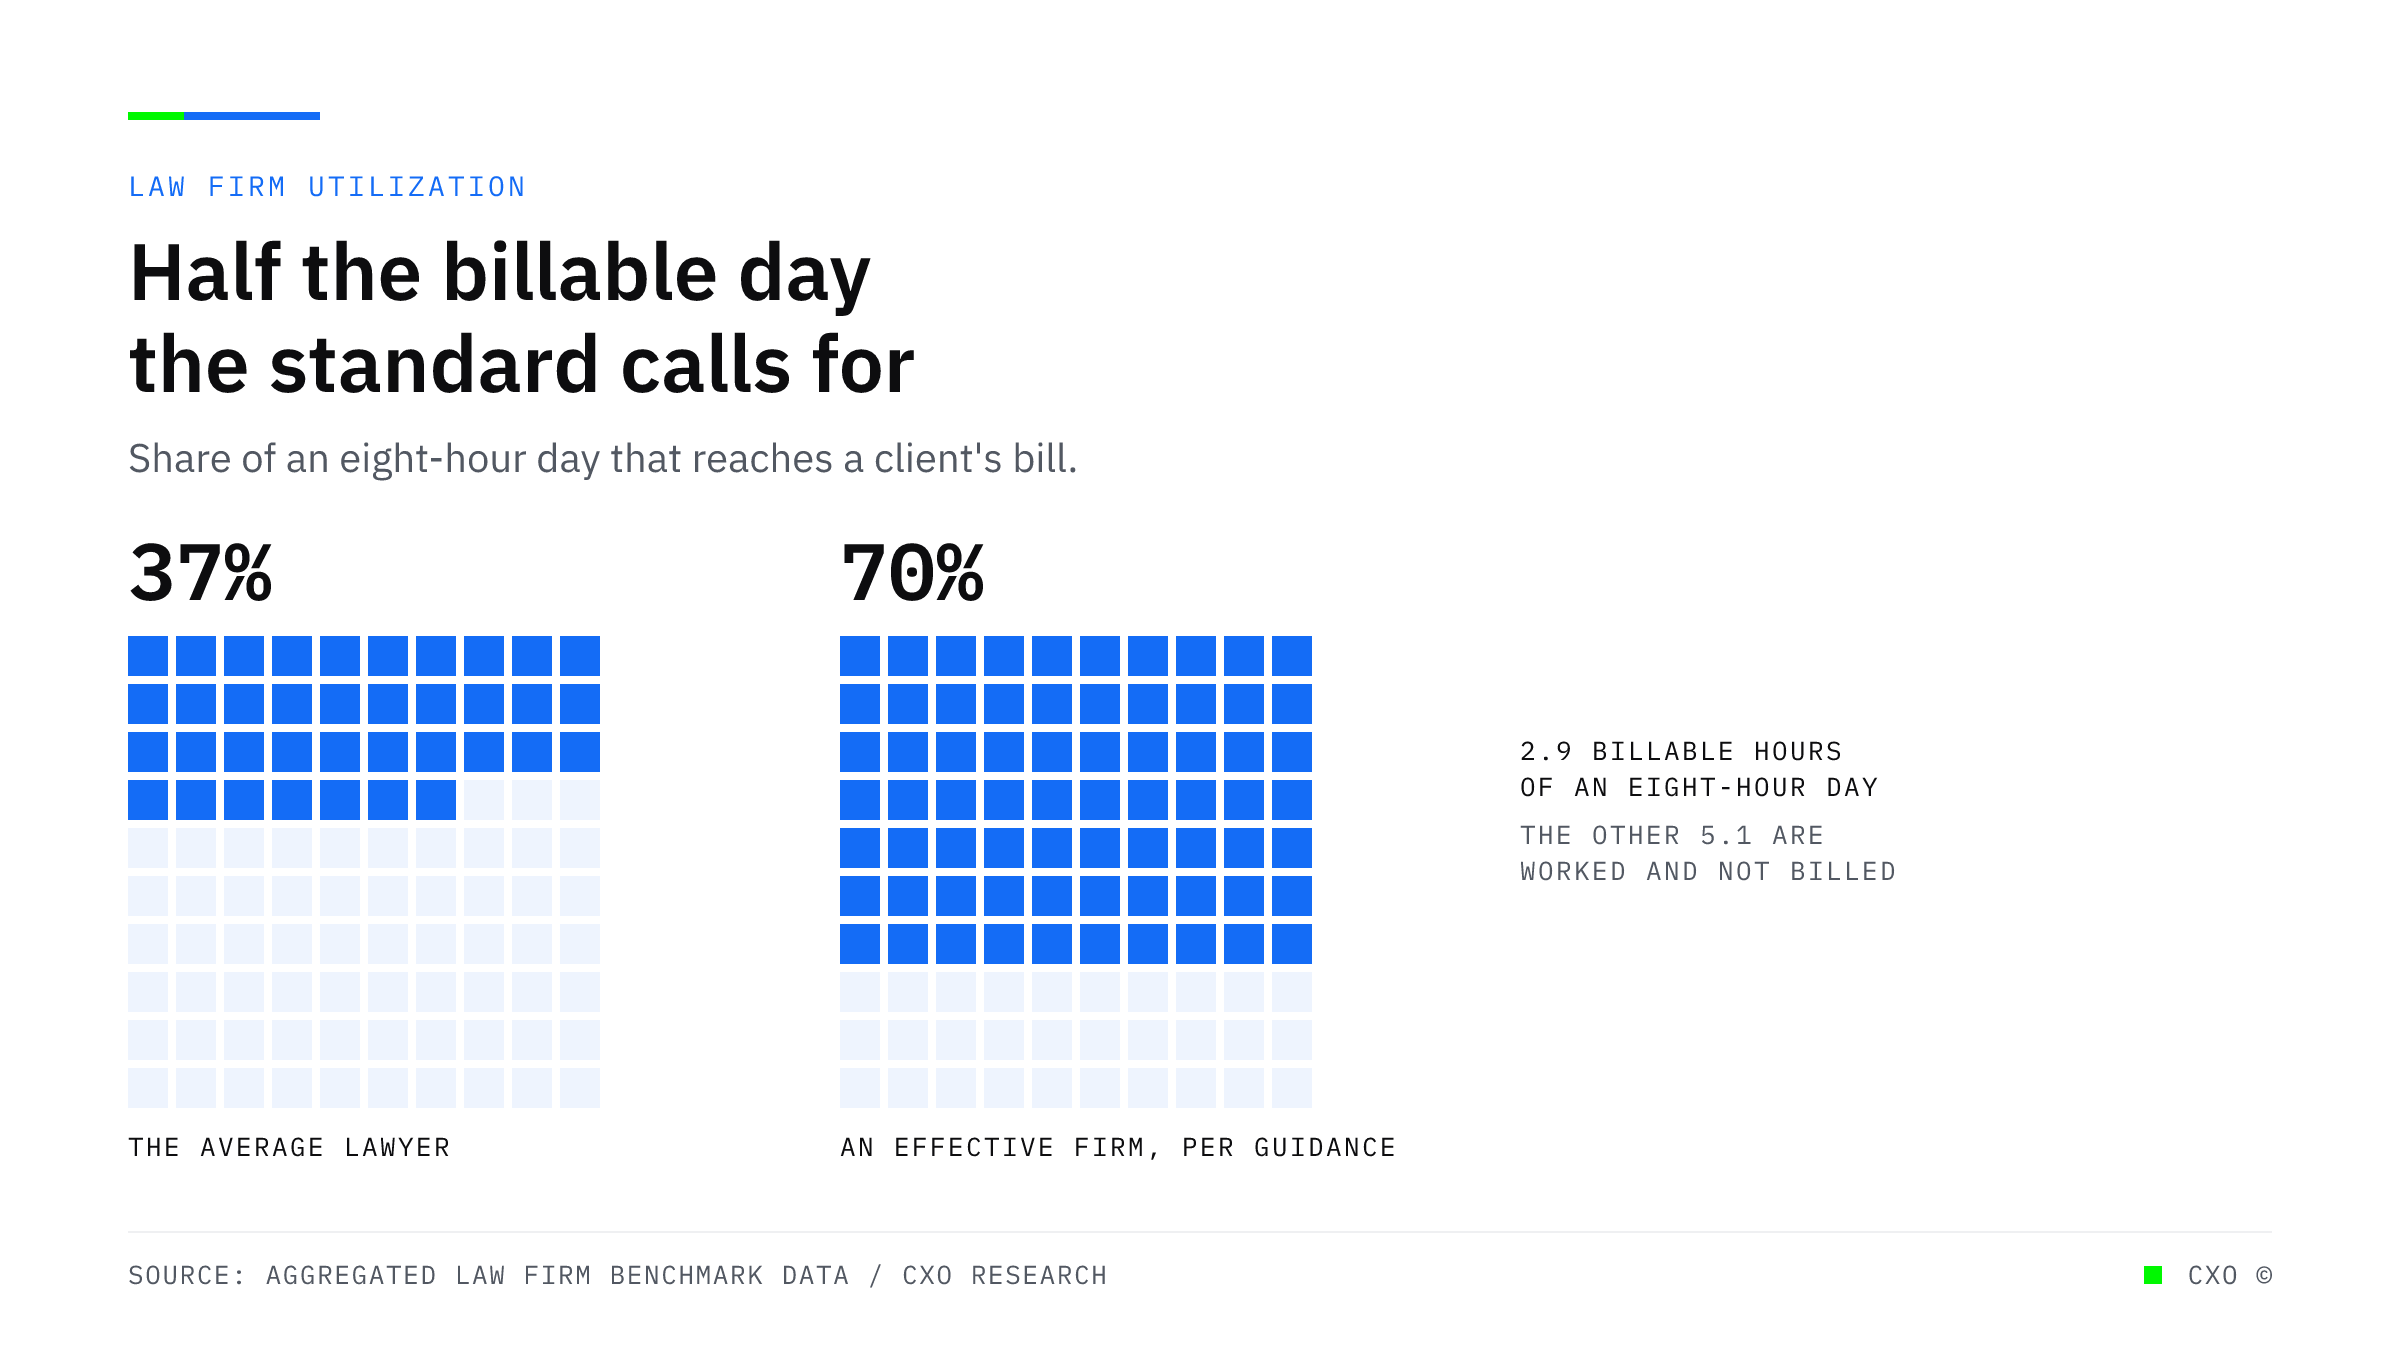
Two grids of 100 squares comparing the average lawyer's utilization rate of 37 percent against the 70 percent minimum the profession's own guidance sets for an effective firm.

The Average Lawyer Bills 2.9 Hours of an Eight-Hour Day

Utilization across law firms averages 37 percent against a 70 percent benchmark for an effective firm. It climbs with headcount, which tells you exactly what the constraint is.
View Insight
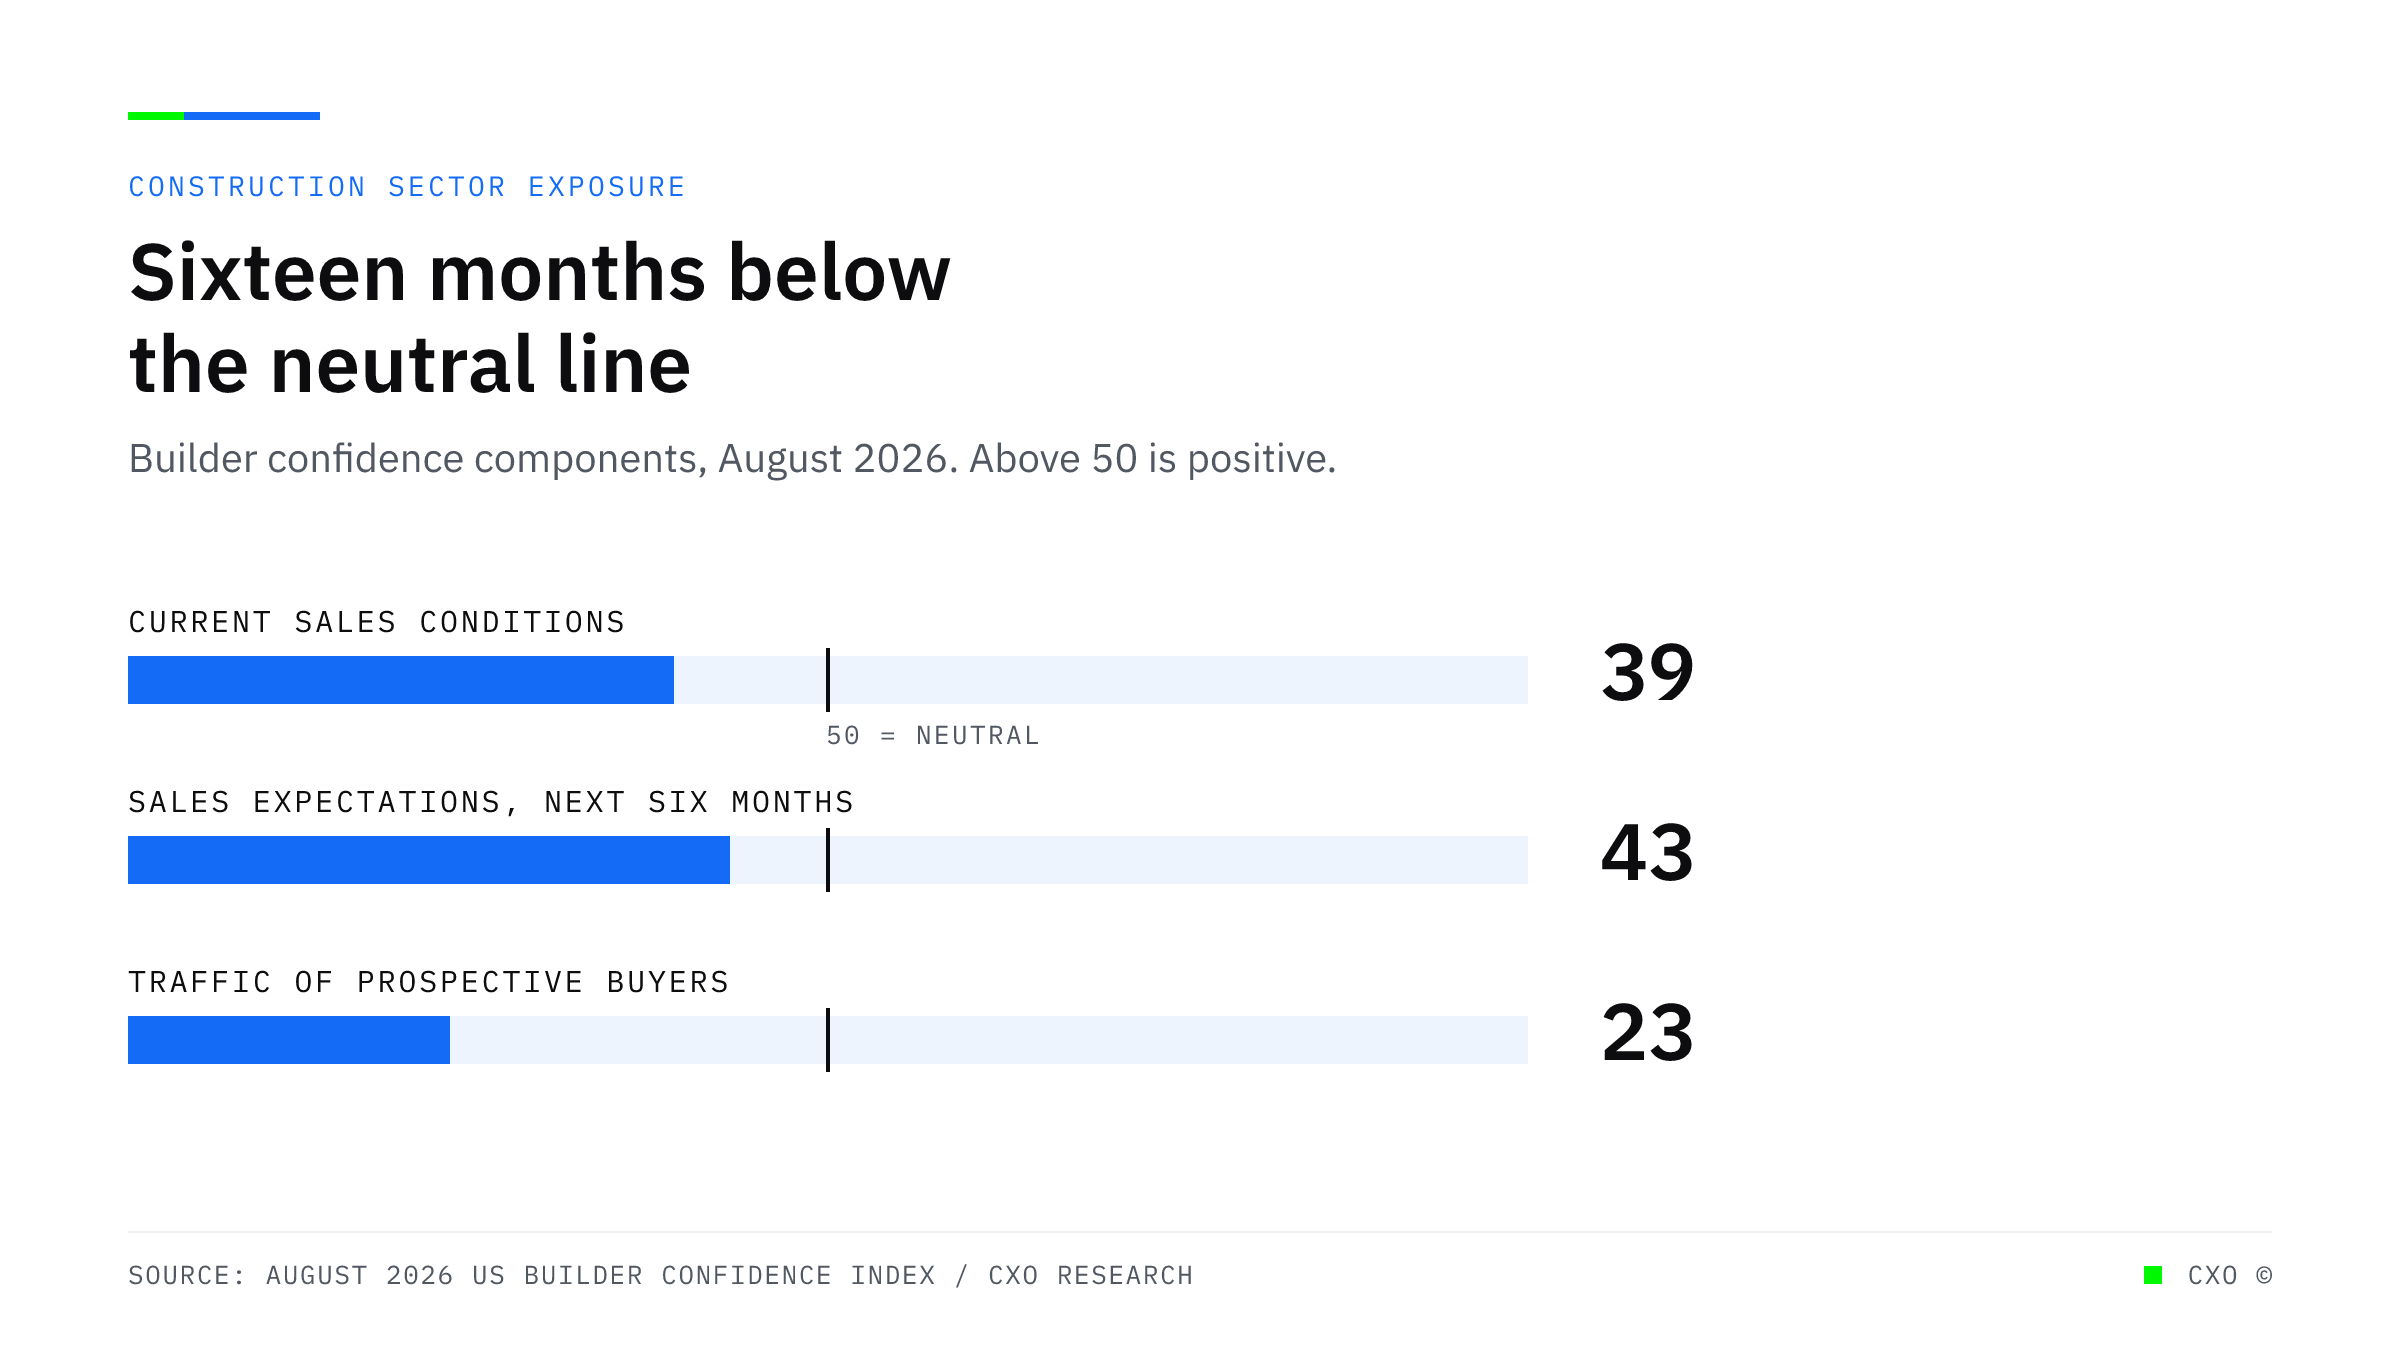
Three bullet bars showing builder confidence components against the neutral reading of 50: current sales conditions at 39, sales expectations at 43, and prospective buyer traffic at 23.

Housing Starts Fell 12.4 Percent. That Reaches a Lending Book Through Files That Look Unrelated.

July housing starts fell 12.4 percent on the month and 13.5 percent on the year, with builder confidence at 35 for a sixteenth straight month. Sector exposure arrives as many separate problems.
View Insight
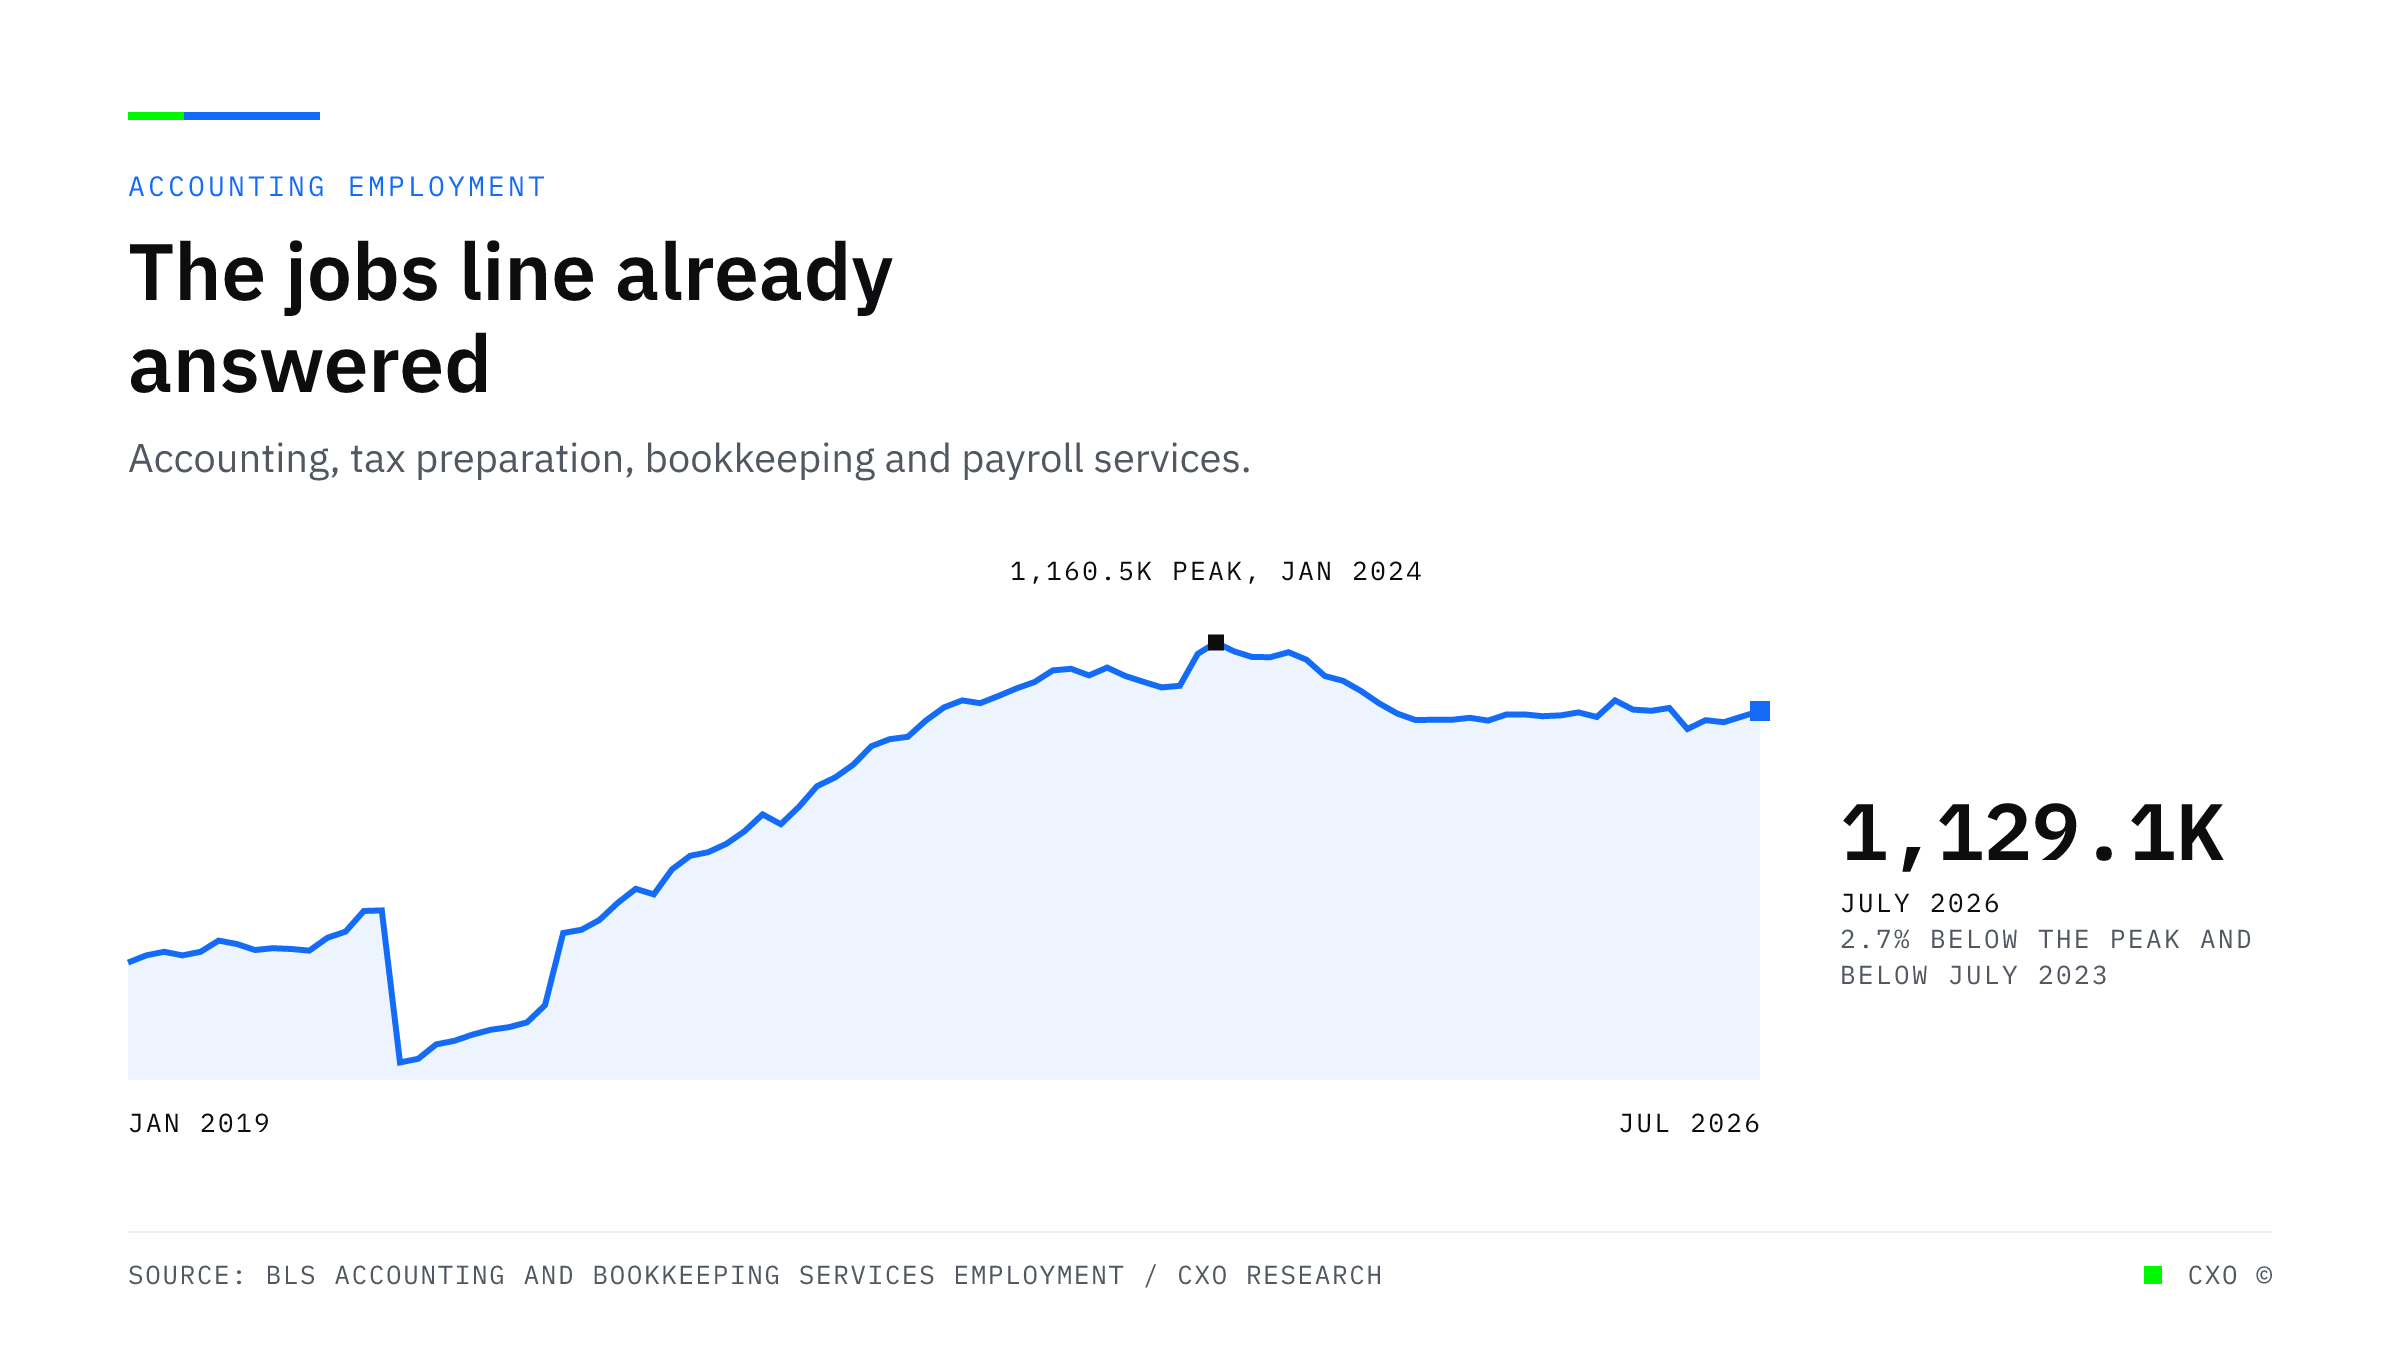
A line chart of monthly employment in accounting, tax preparation, bookkeeping and payroll services, peaking at 1,160,500 in January 2024 and standing at 1,129,100 in July 2026.

The Pipeline Is Refilling at the Front. Your Capacity Problem Is at the Back.

Accounting enrollment rose 8.9 percent to 205,180, a third straight increase. Graduates fell 6.6 percent and new CPA exam candidates dropped from 42,626 to 28,082 over the same stretch.
View Insight
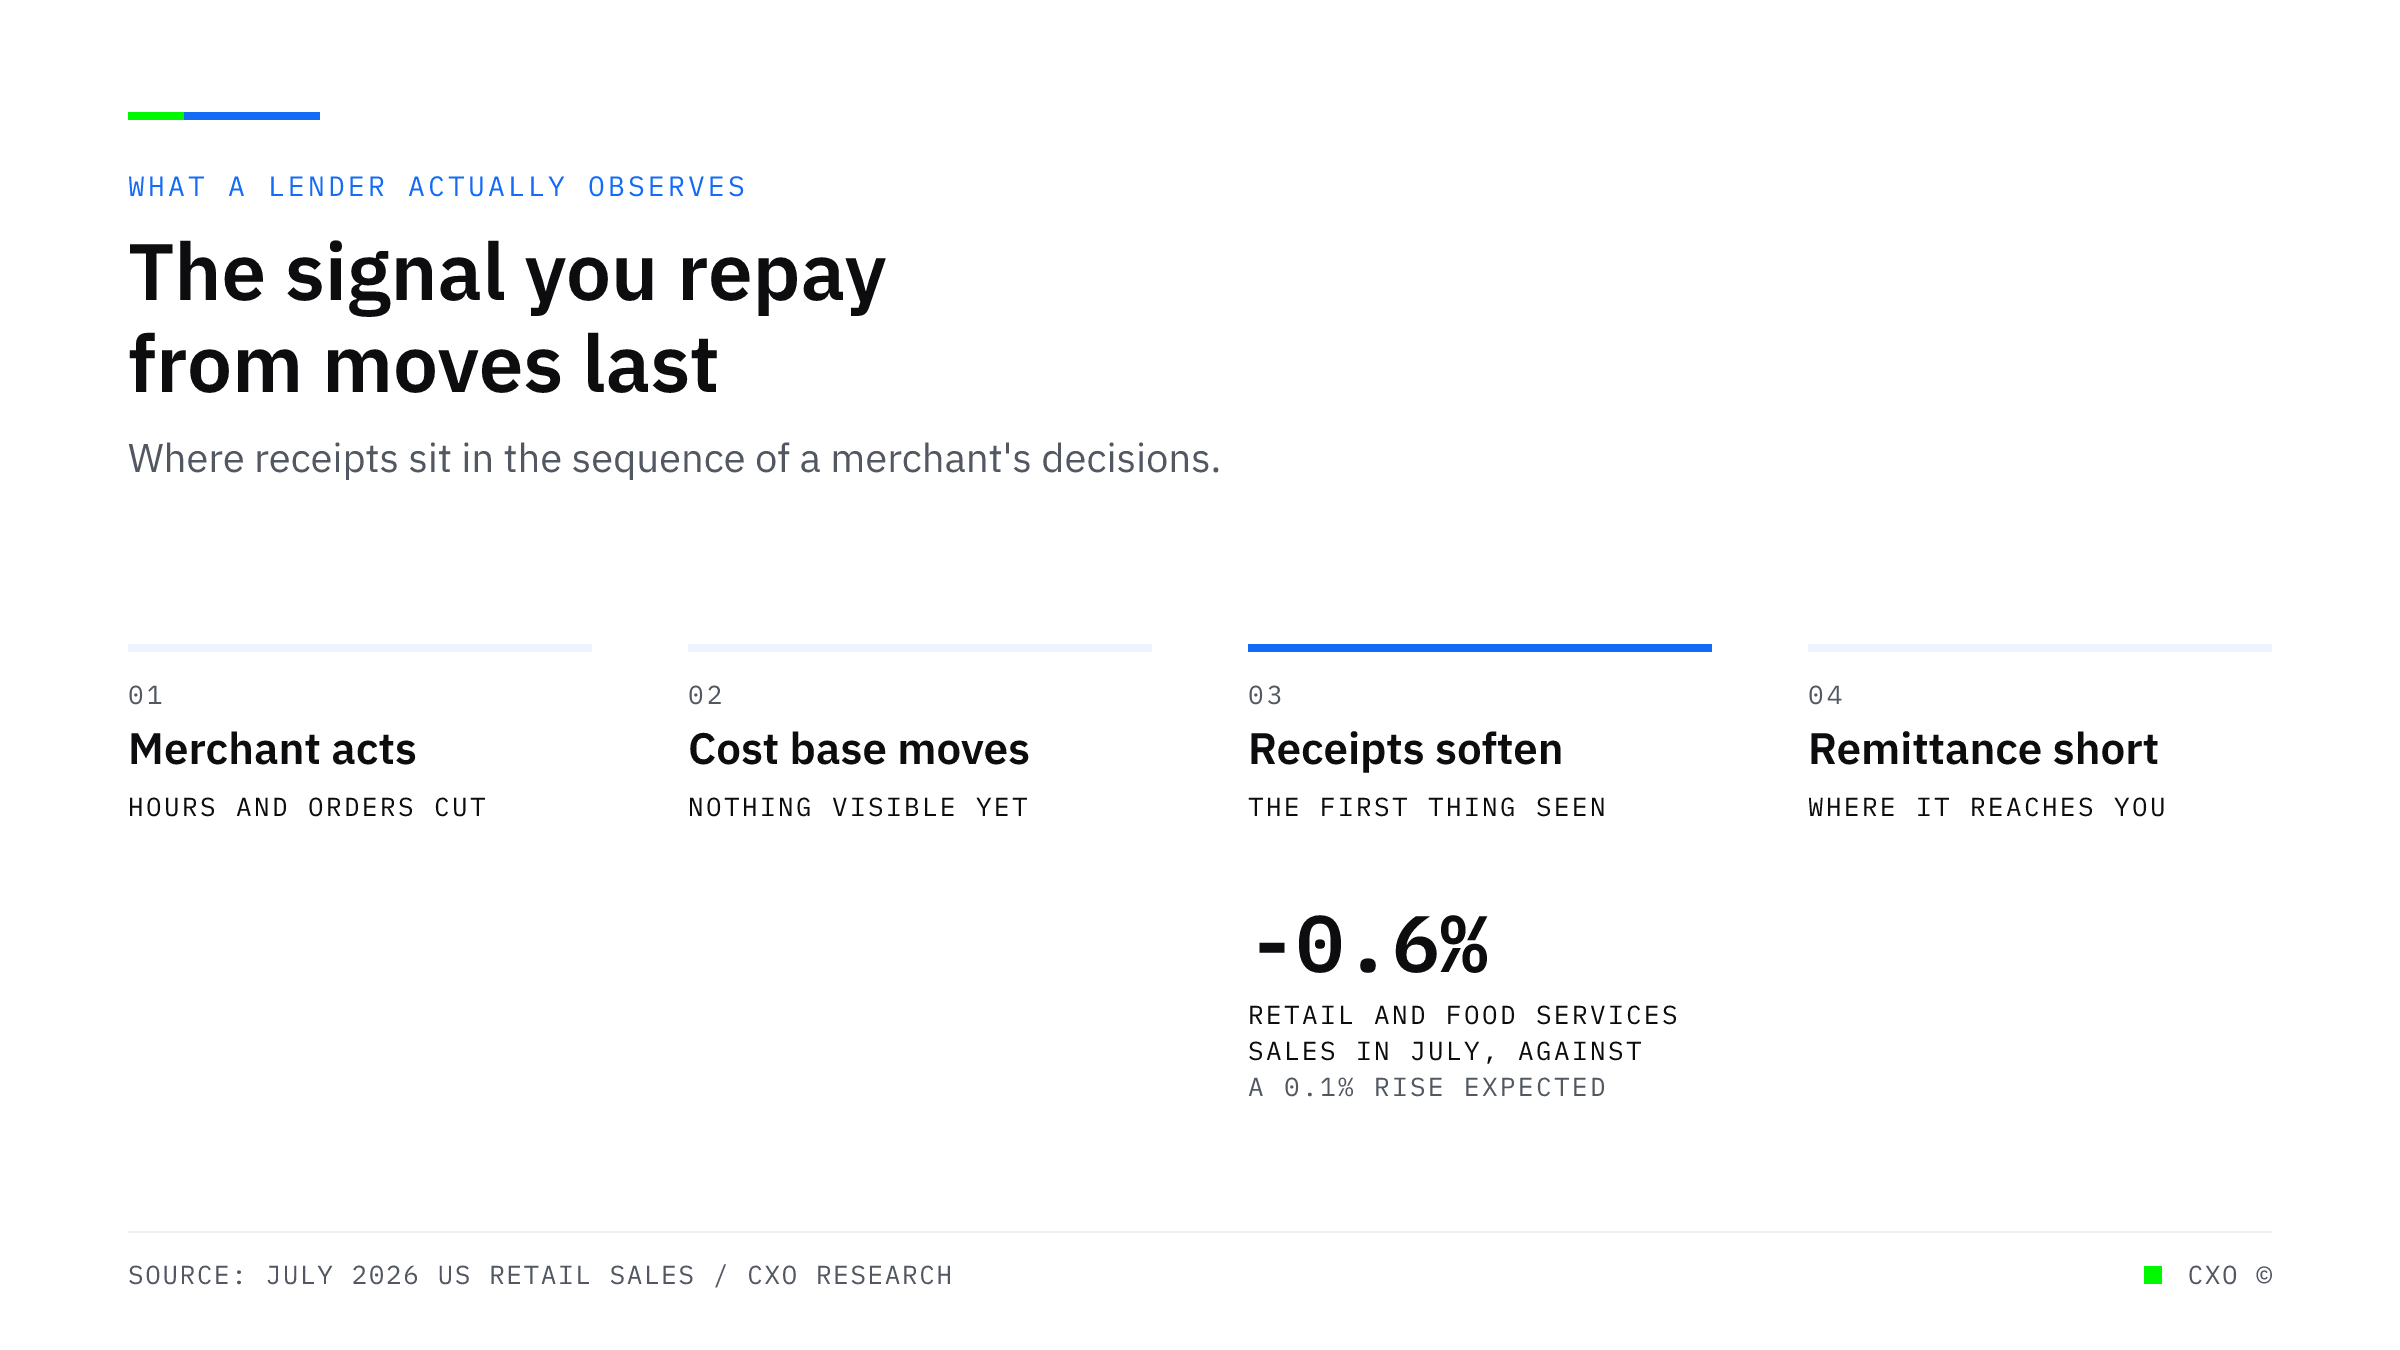
A labelled diagram of four stages showing that a merchant cuts hours and delays orders before anything changes in receipts, that July retail and food services sales fell 0.6 percent against an expected rise, and that remittance performance is where a lender finally sees it.

The Signal You Repay From Is the Last One to Move

July retail sales fell 0.6 percent against an expected rise, and categories ranged from minus 2.2 to plus 1.9 in the same month. Receipts are both the slowest signal a lender has and the least specific.
View Insight
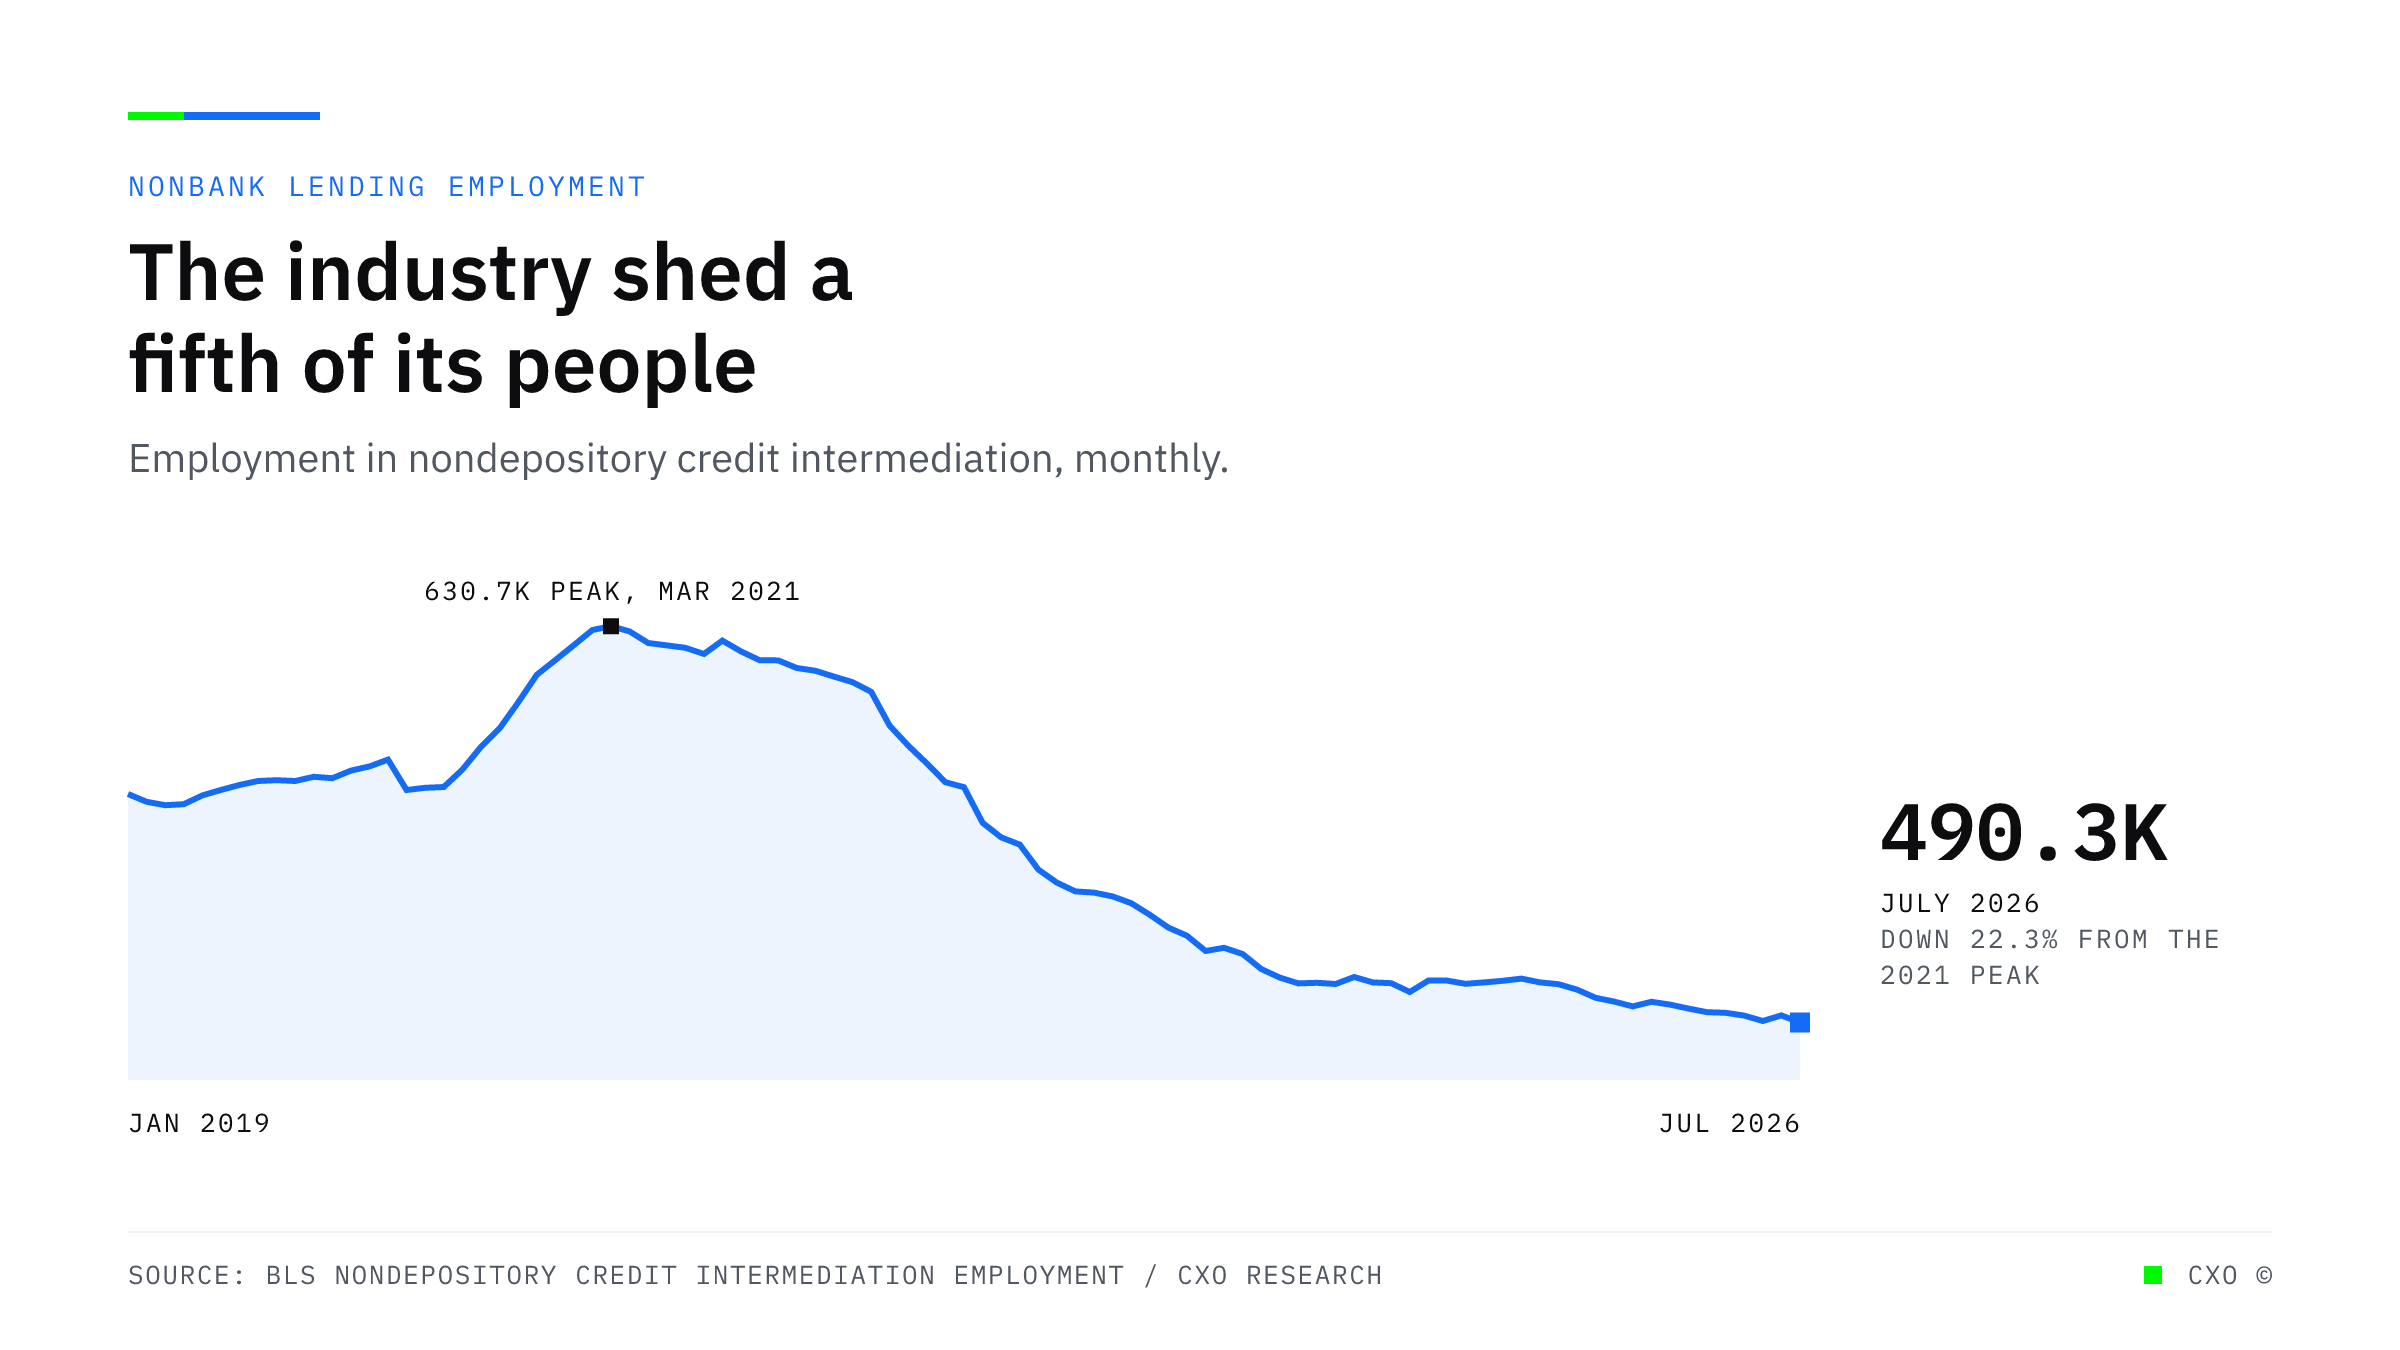
A curve of monthly employment in nondepository credit intermediation, peaking at 630,700 in March 2021 and falling steadily to 490,300 in July 2026, a decline of 22.3 percent.

The Industry Has 140,000 Fewer People Than in 2021 and a Larger Share of the Applications

Employment in nondepository credit intermediation has fallen 22.3 percent from its 2021 peak and is still declining, while the share of small business applicants going to online lenders rose to 29 percent.
View Insight
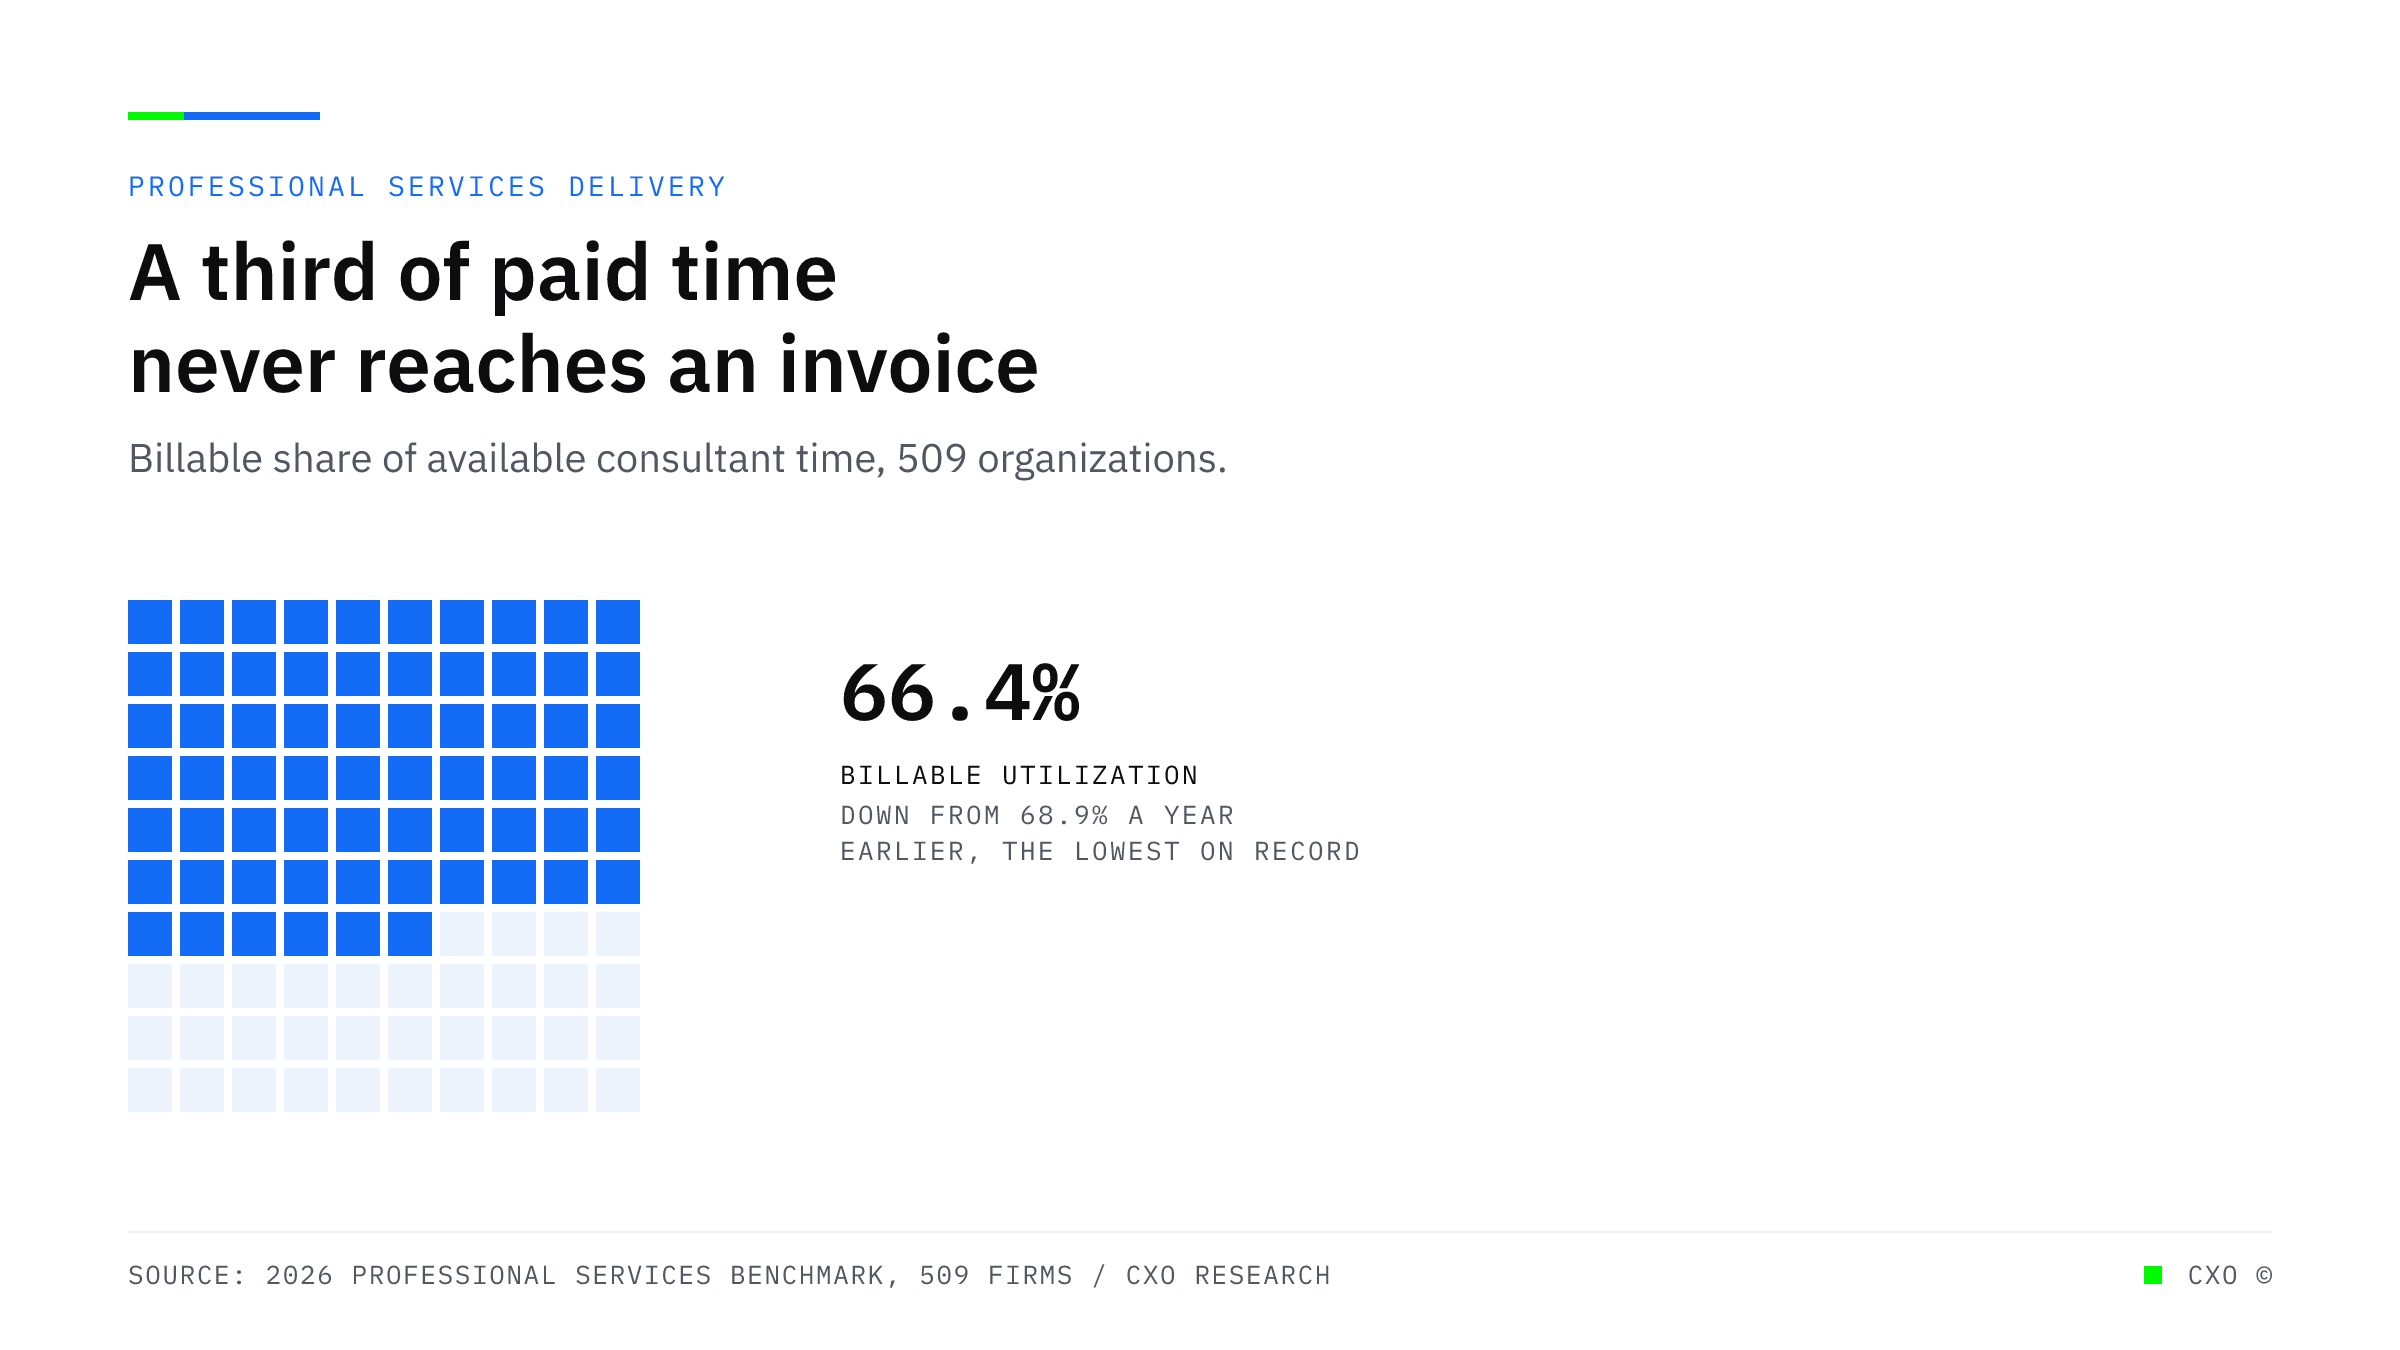
A grid of 100 squares with 66 filled in blue, showing that 66.4 percent of available consultant time is billable across 509 professional services organizations, the lowest level recorded.

Billable Utilization Hit a Record Low in the Same Year AI Use Rose Forty Percent

Across 509 professional services organizations, billable utilization fell to 66.4 percent, the lowest on record, while revenue growth improved and generative AI reached 27.1 percent of projects.
View Insight
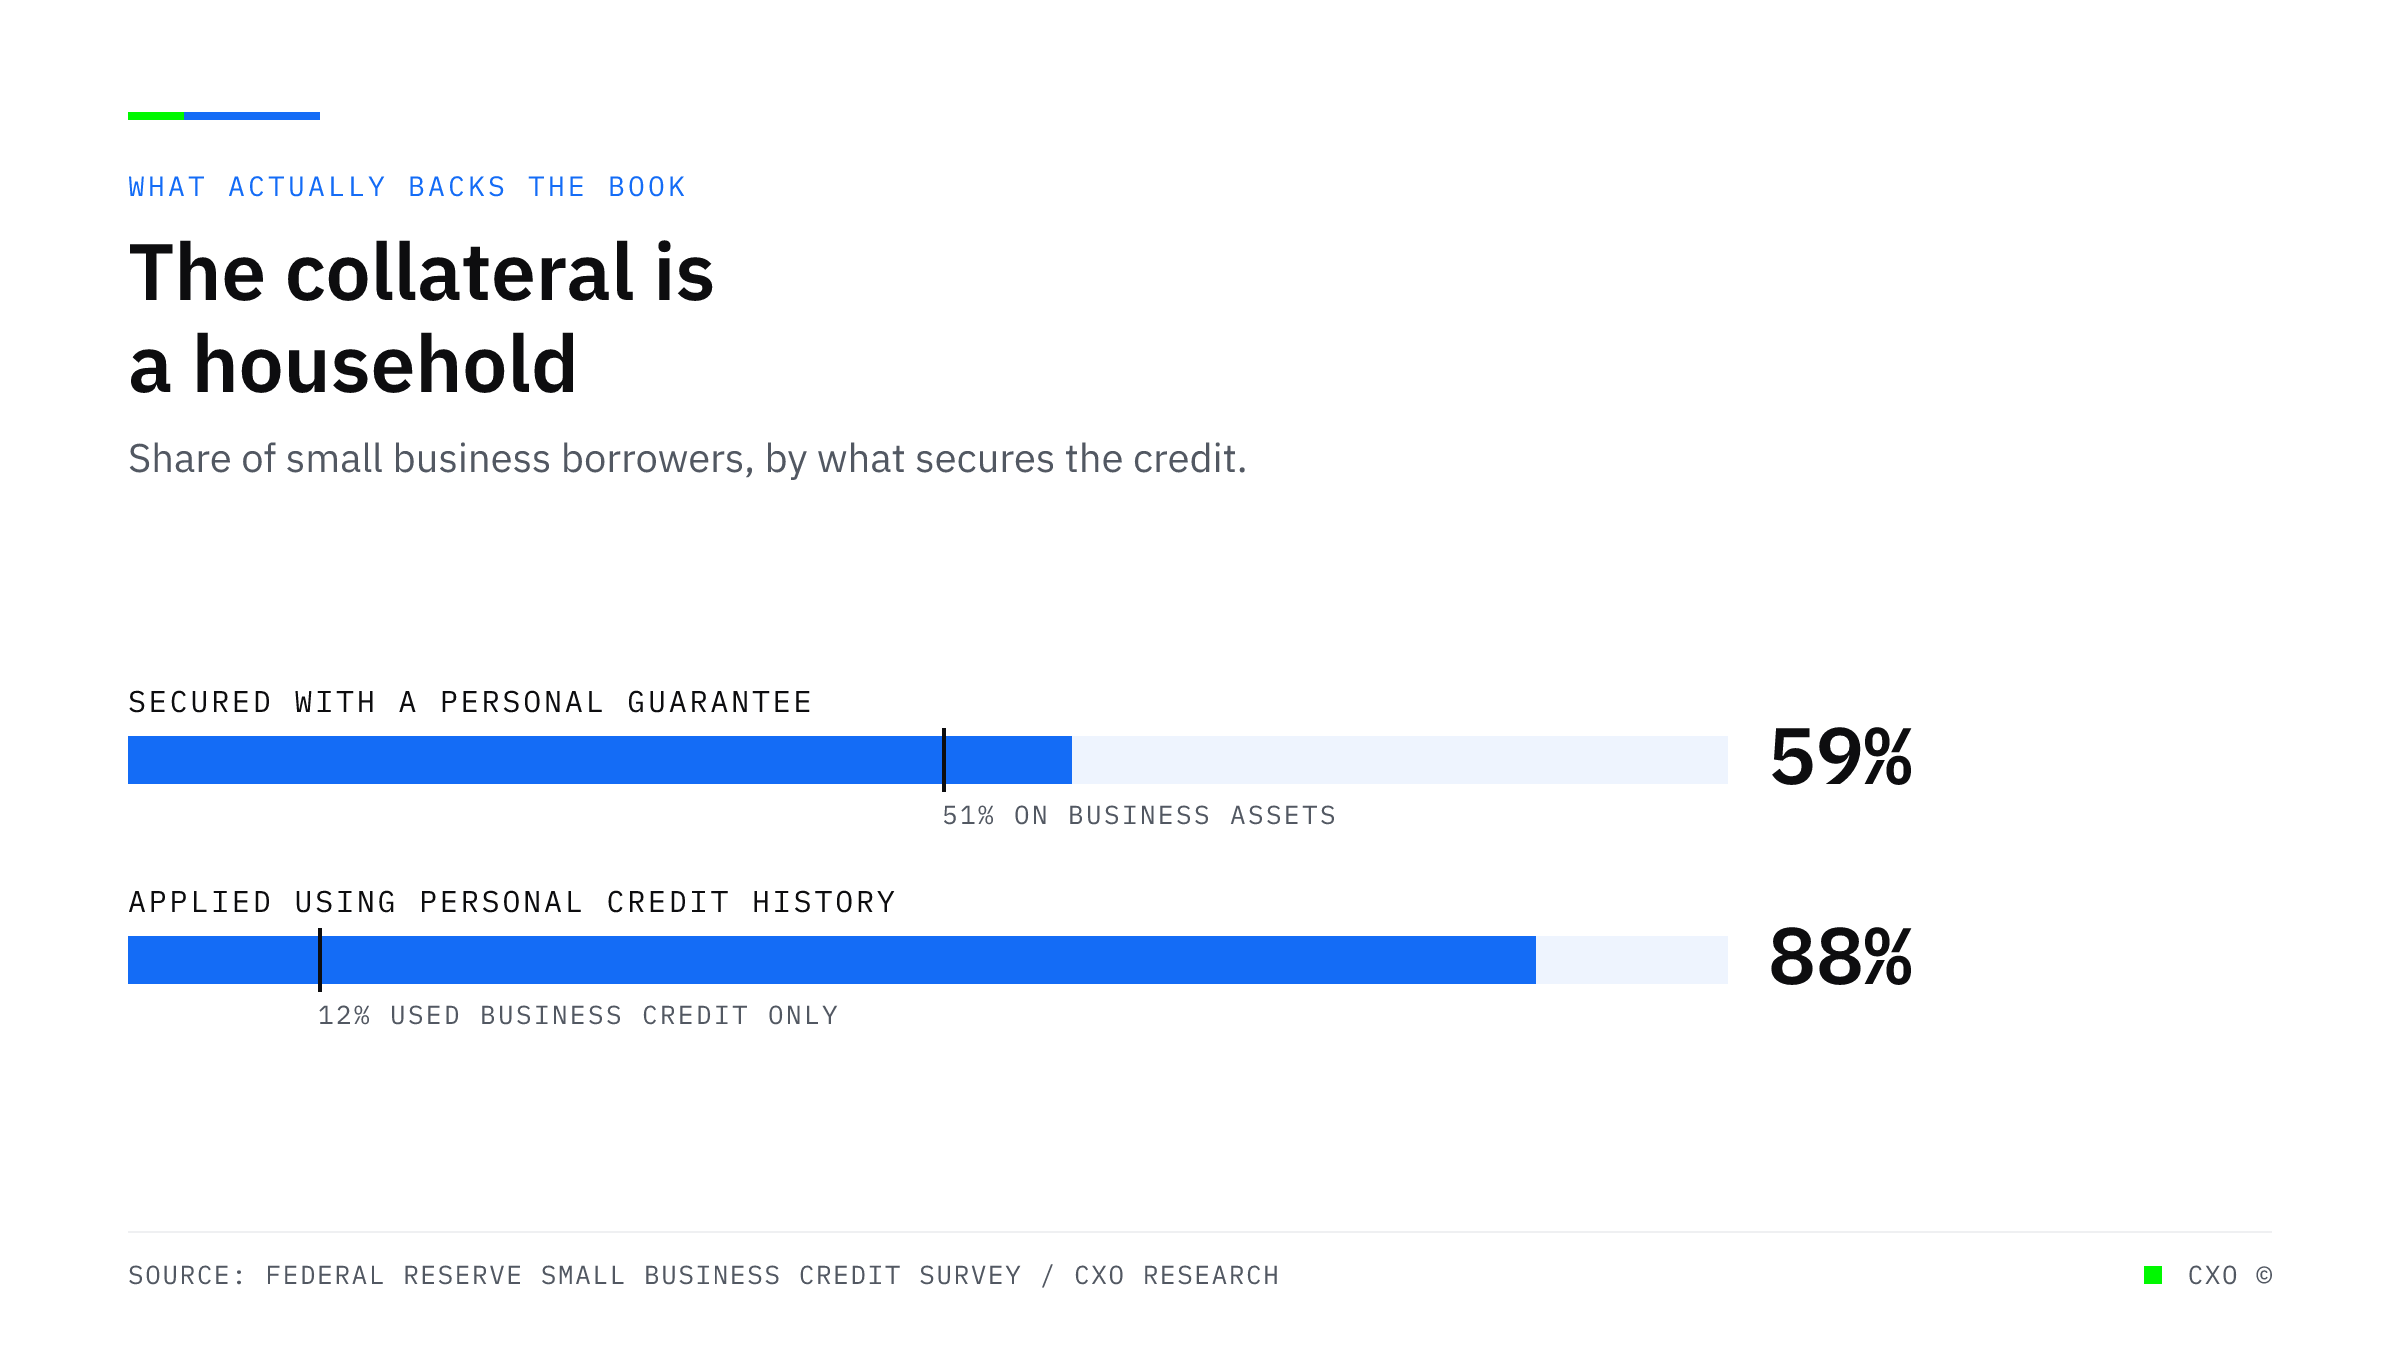
Two bullet bars showing that 59 percent of small business debt holders secured their debt with a personal guarantee against 51 percent using business assets, and that 88 percent of owners applied using personal credit history against 12 percent who used business credit only.

Fifty-Nine Percent of Small Business Debt Is Secured on a Household You Underwrite Once

Most small business debt is backed by a personal guarantee, which makes a household balance sheet the collateral. Merchants get monitored daily. Guarantors get looked at once, at origination.
View Insight
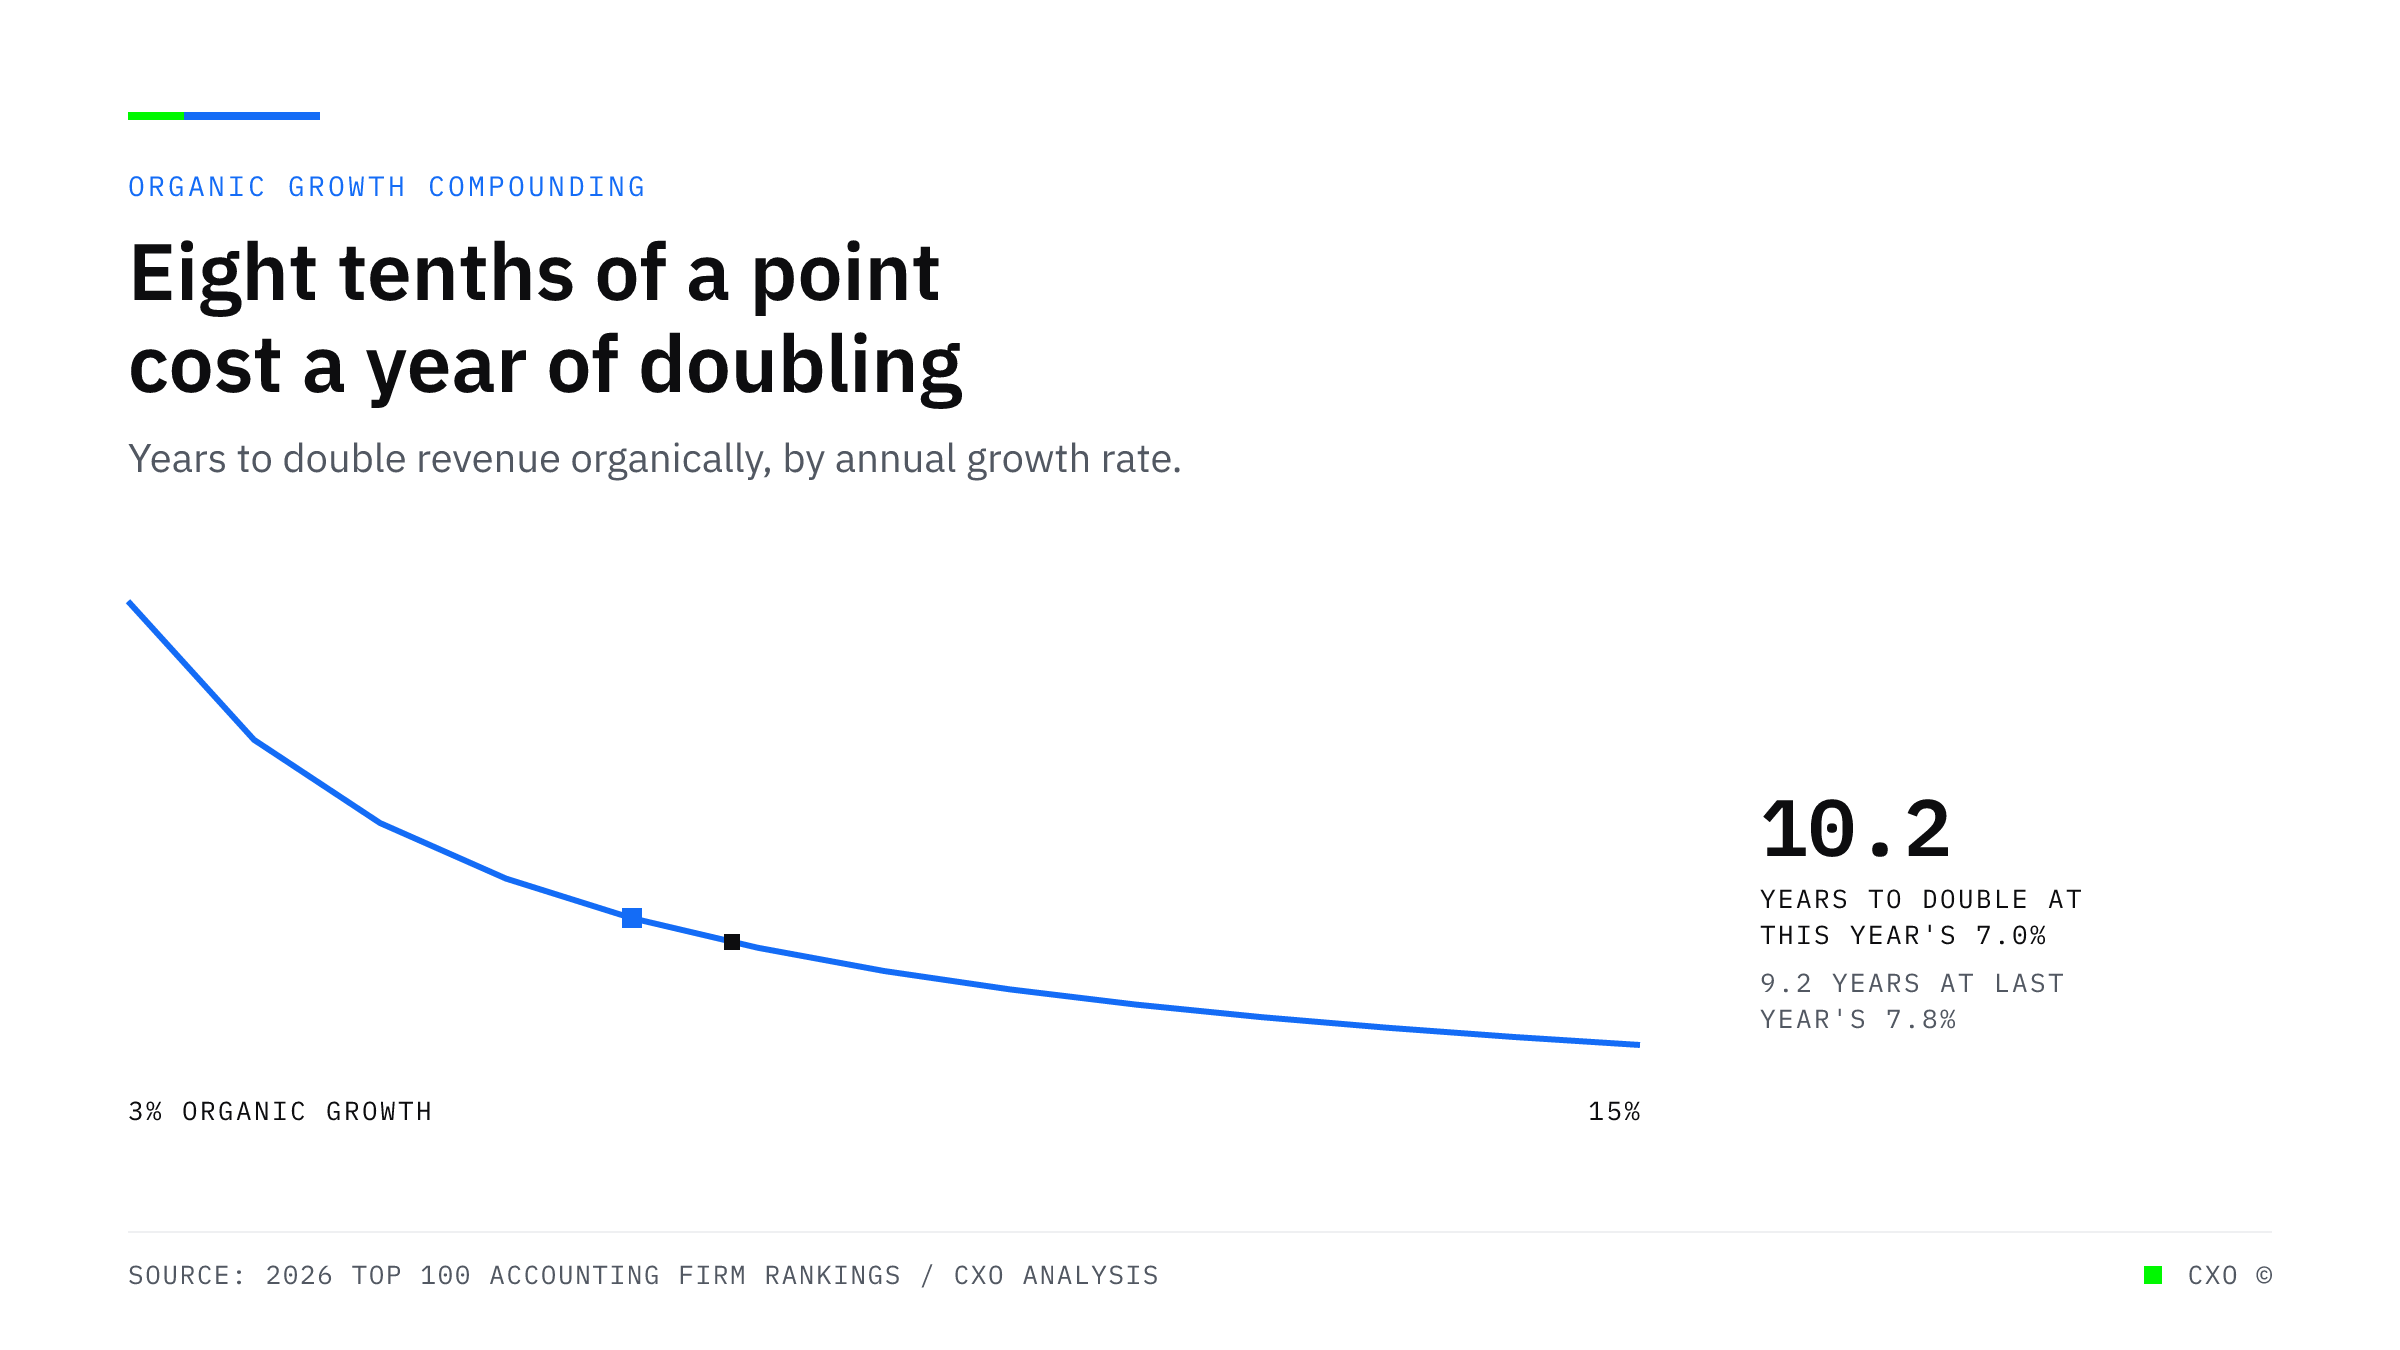
A rising curve showing how long it takes to double revenue at a given organic growth rate, marked at 7.0 percent where doubling takes 10.2 years, against 9.2 years at last year's 7.8 percent.

Top-100 Growth Rose to 12.8 Percent While Organic Growth Fell to 7

Total revenue growth at the top 100 accounting firms rose from 10.4 to 12.8 percent. Organic growth fell from 7.8 to 7.0. The entire acceleration was bought, and the benchmark moved with it.
View Insight
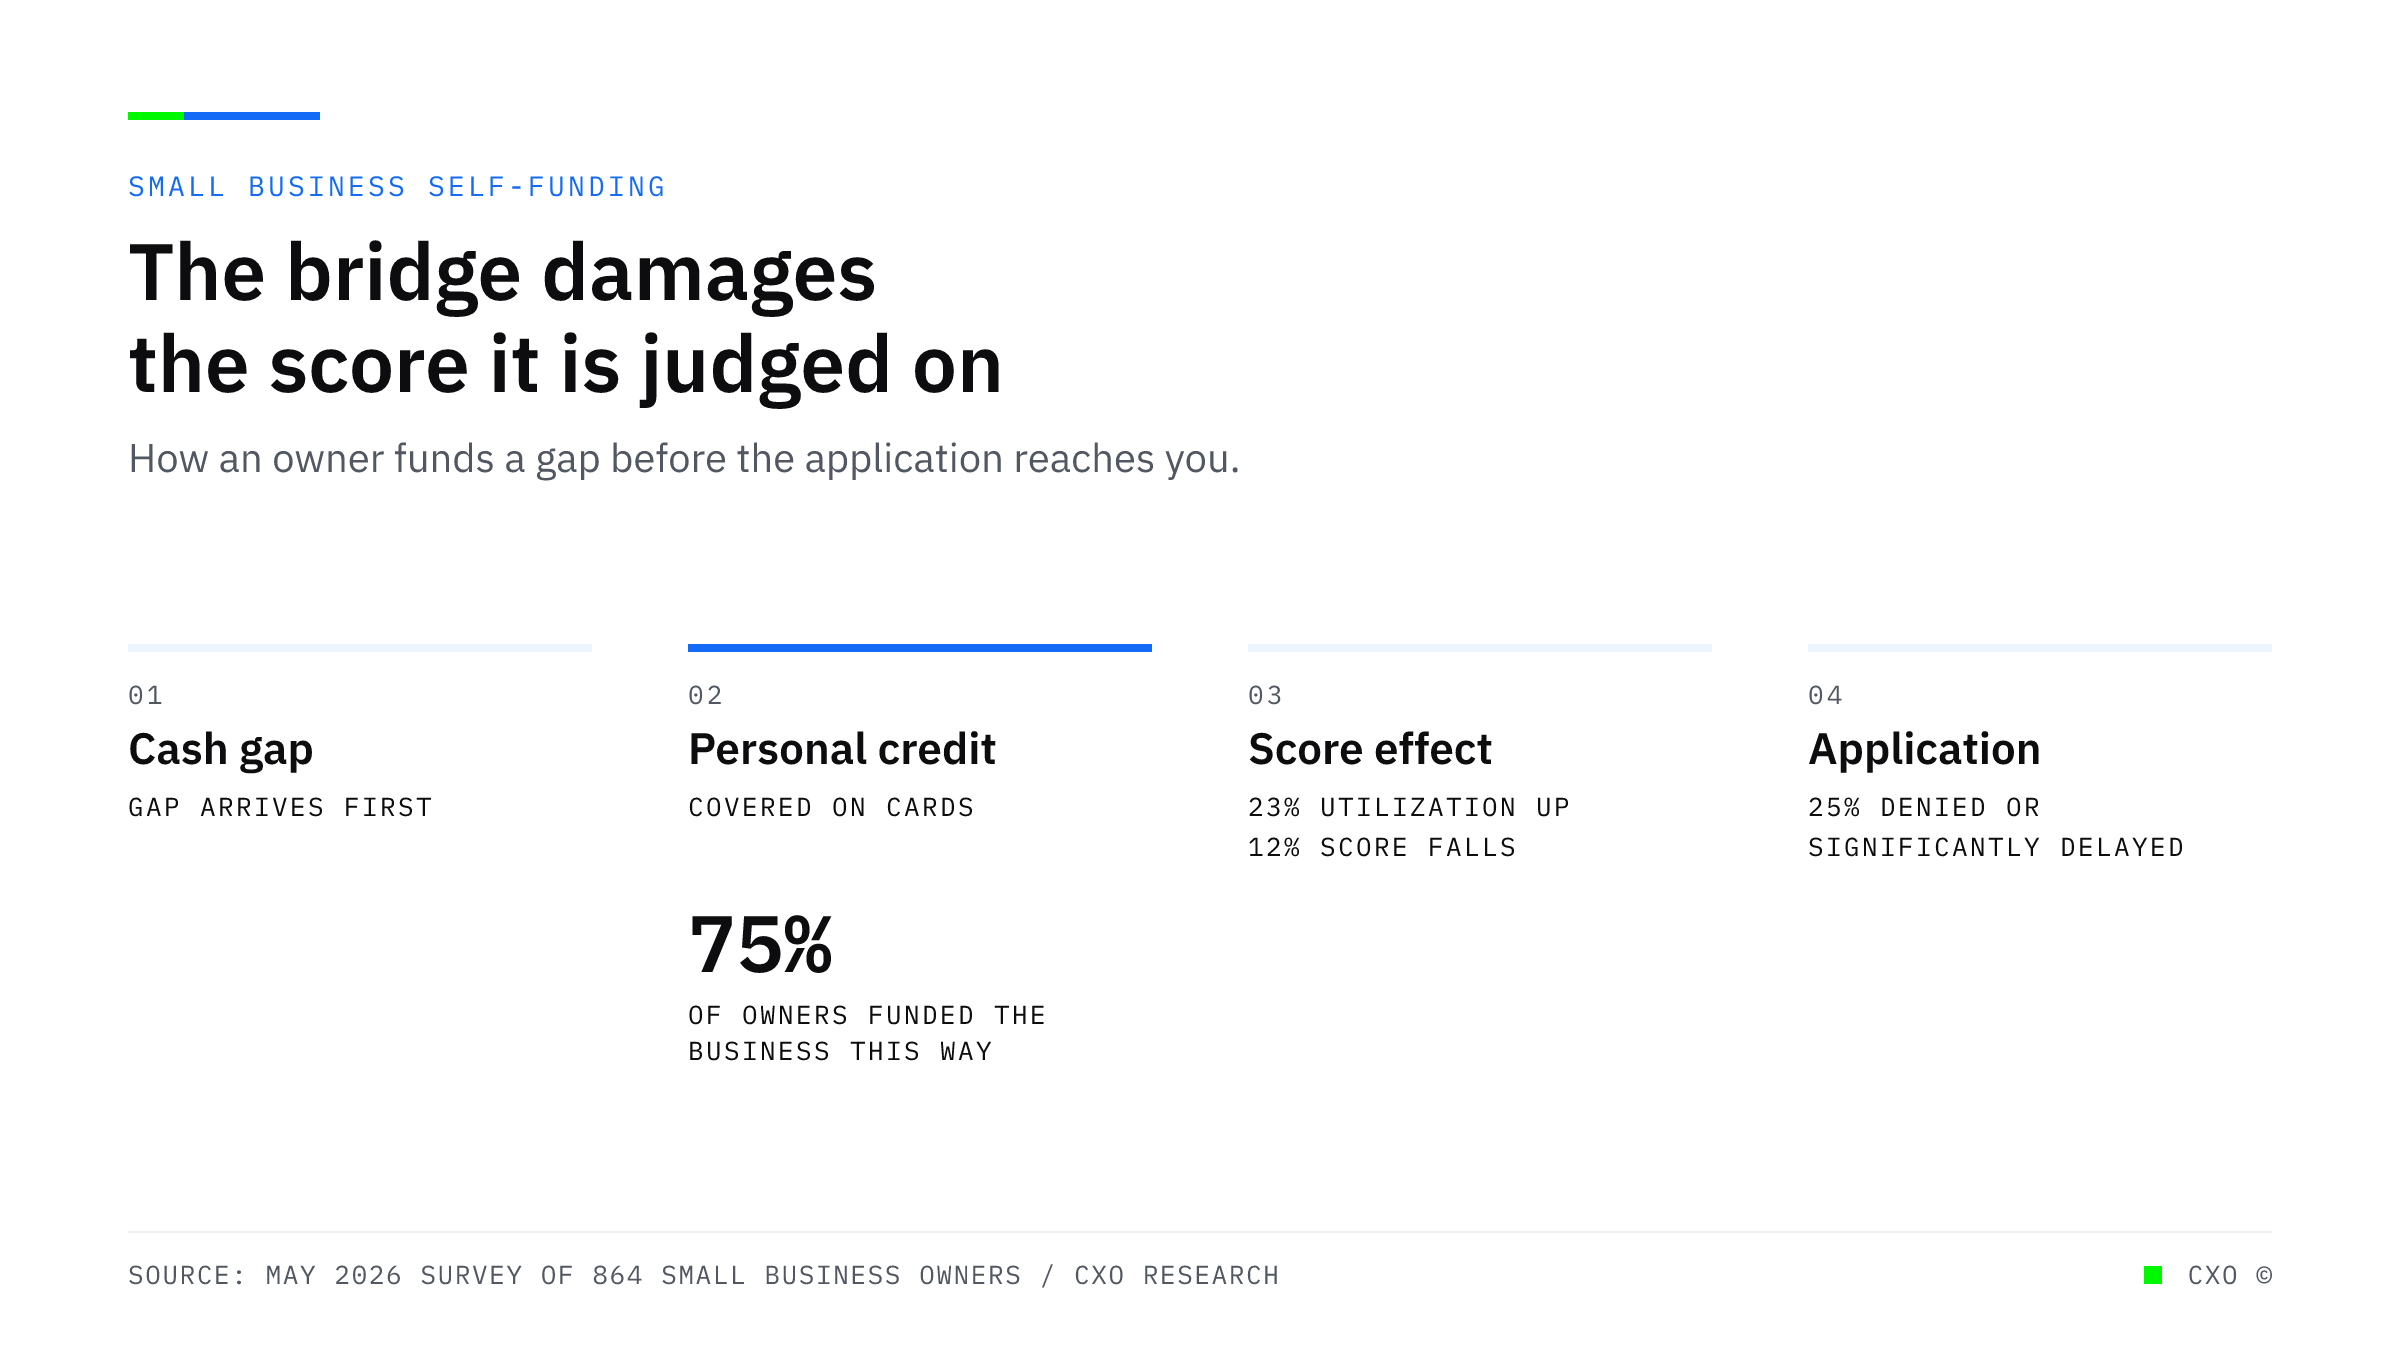
A labelled diagram of how a small business owner self-funds before applying: a cash gap appears, personal credit covers it for 75 percent of owners, utilization rises for 23 percent and personal credit scores fall for 12 percent, and 25 percent are then denied or significantly delayed on the business application that follows.

Three in Four Applicants Already Borrowed Before They Reached You. It Was on Personal Credit.

Revolving credit is growing at nearly twice the pace of everything else, and 75 percent of small business owners funded the business on personal credit in the past year, up from 49 percent in 2024.
View Insight
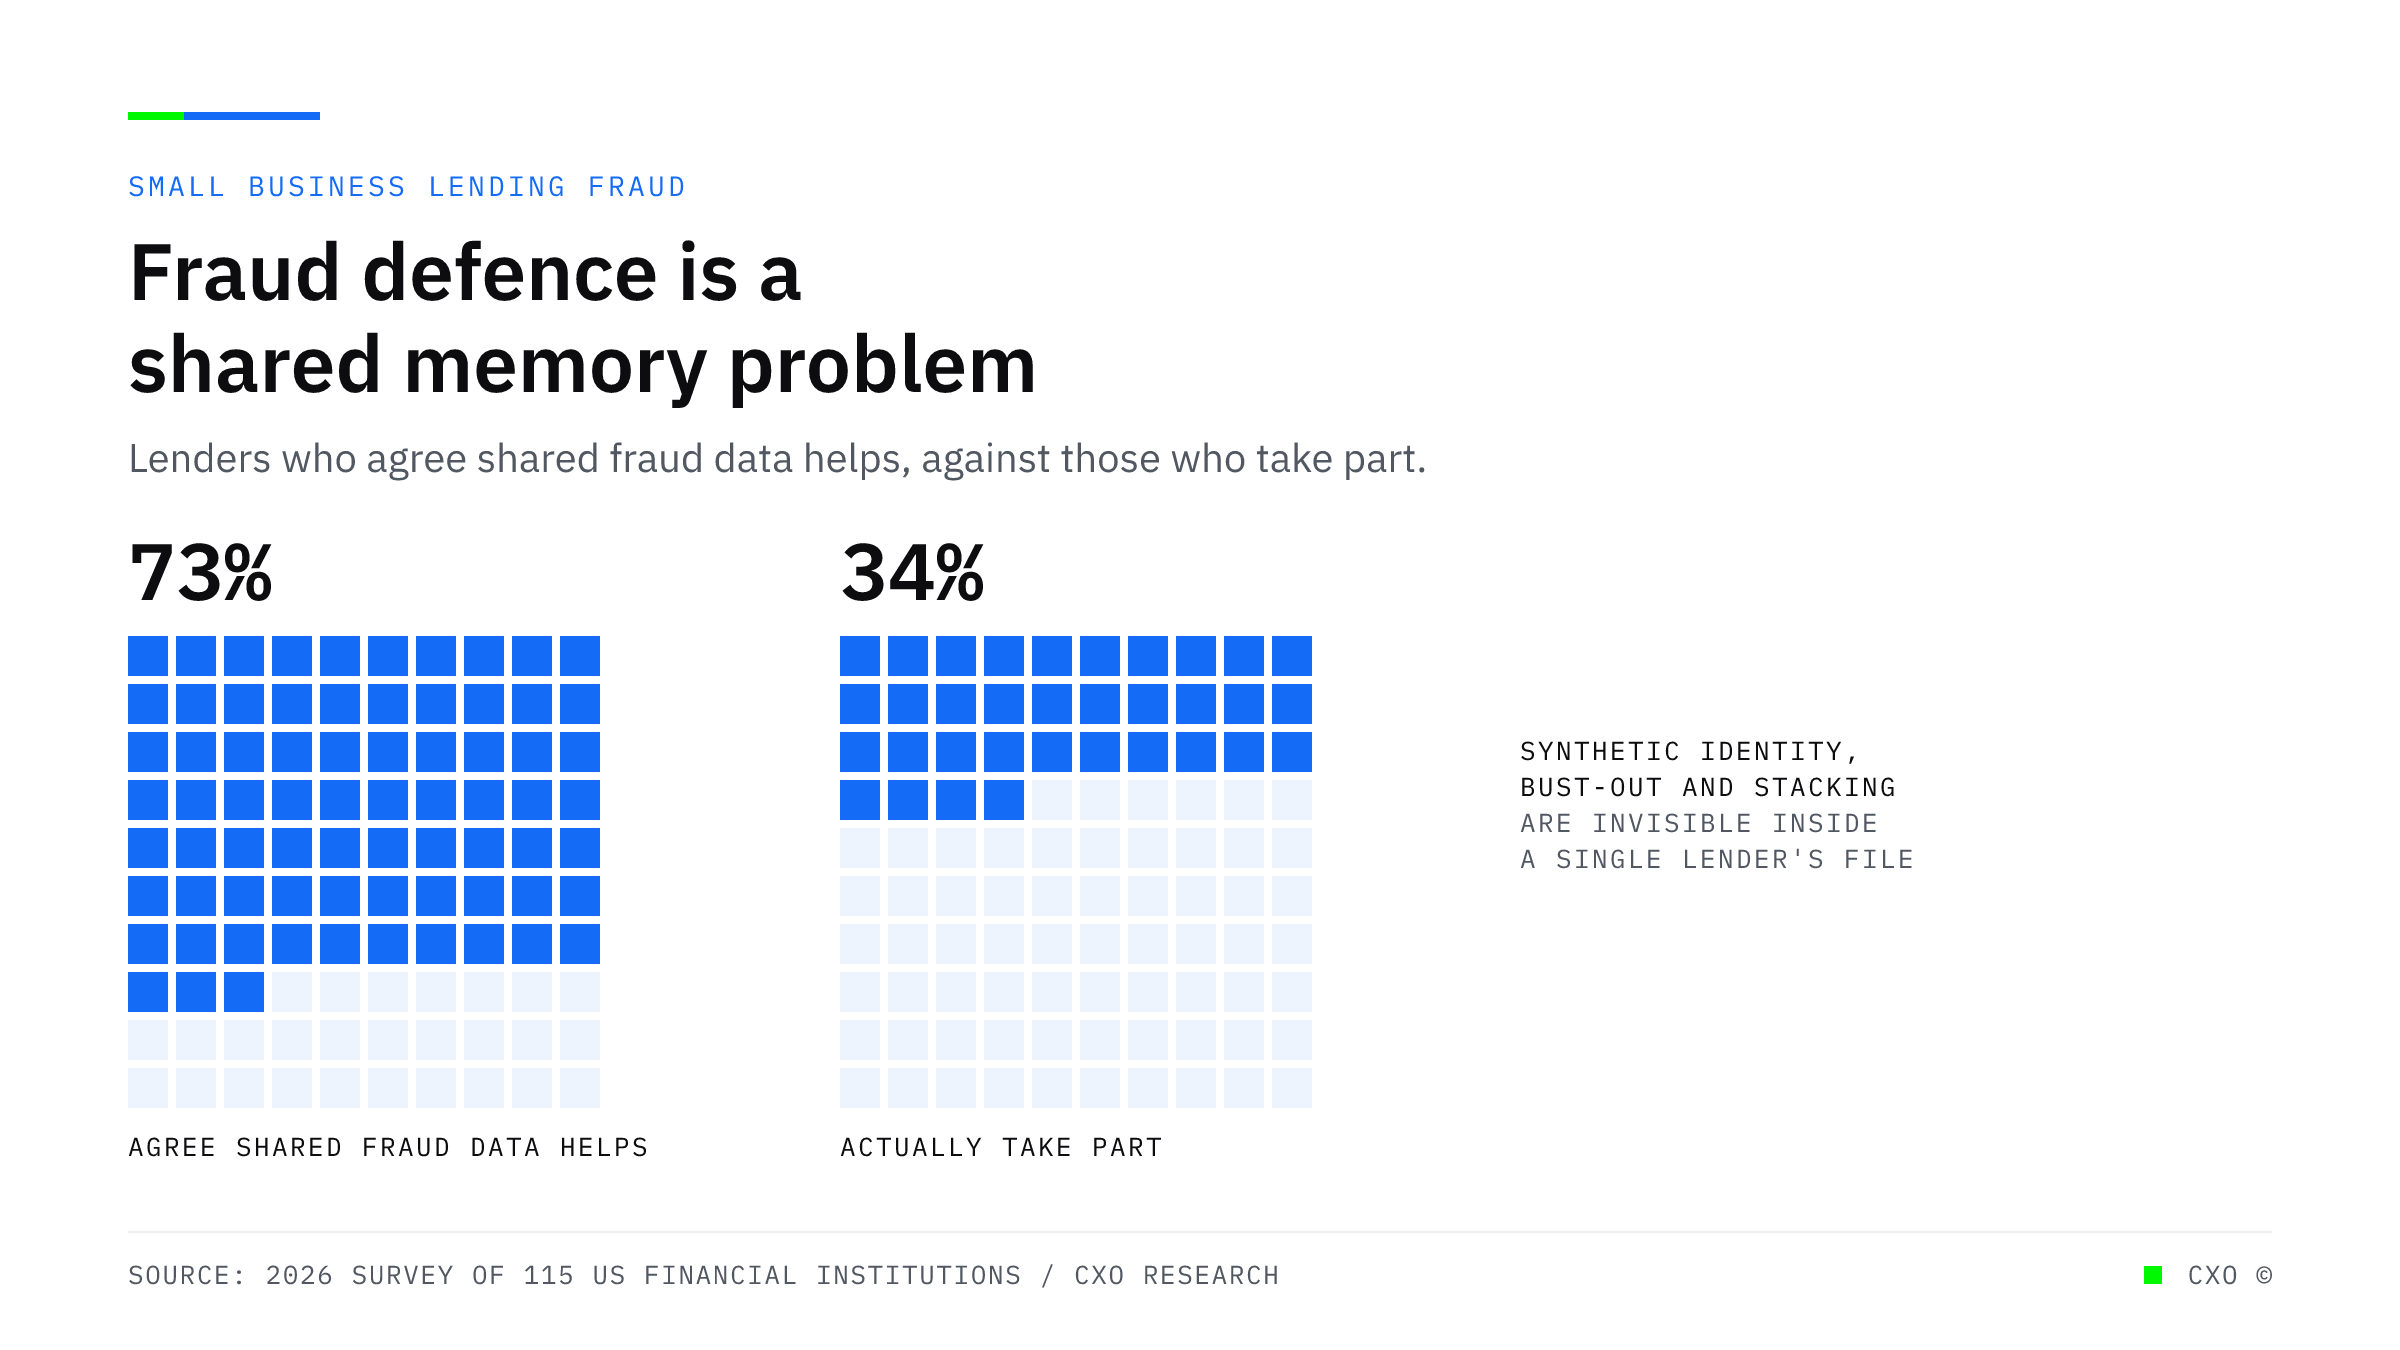
Two grids of 100 squares comparing lenders who agree that shared industry fraud data helps, at 73 percent, against the 34 percent who actually take part in it.

The Fraud Growing Fastest Is the Kind You Cannot See in Your Own File

Synthetic identity, bust-out and application stacking are the three fastest growing fraud types, and none of them are visible in one lender's own file. The defence is recall, not detection.
View Insight
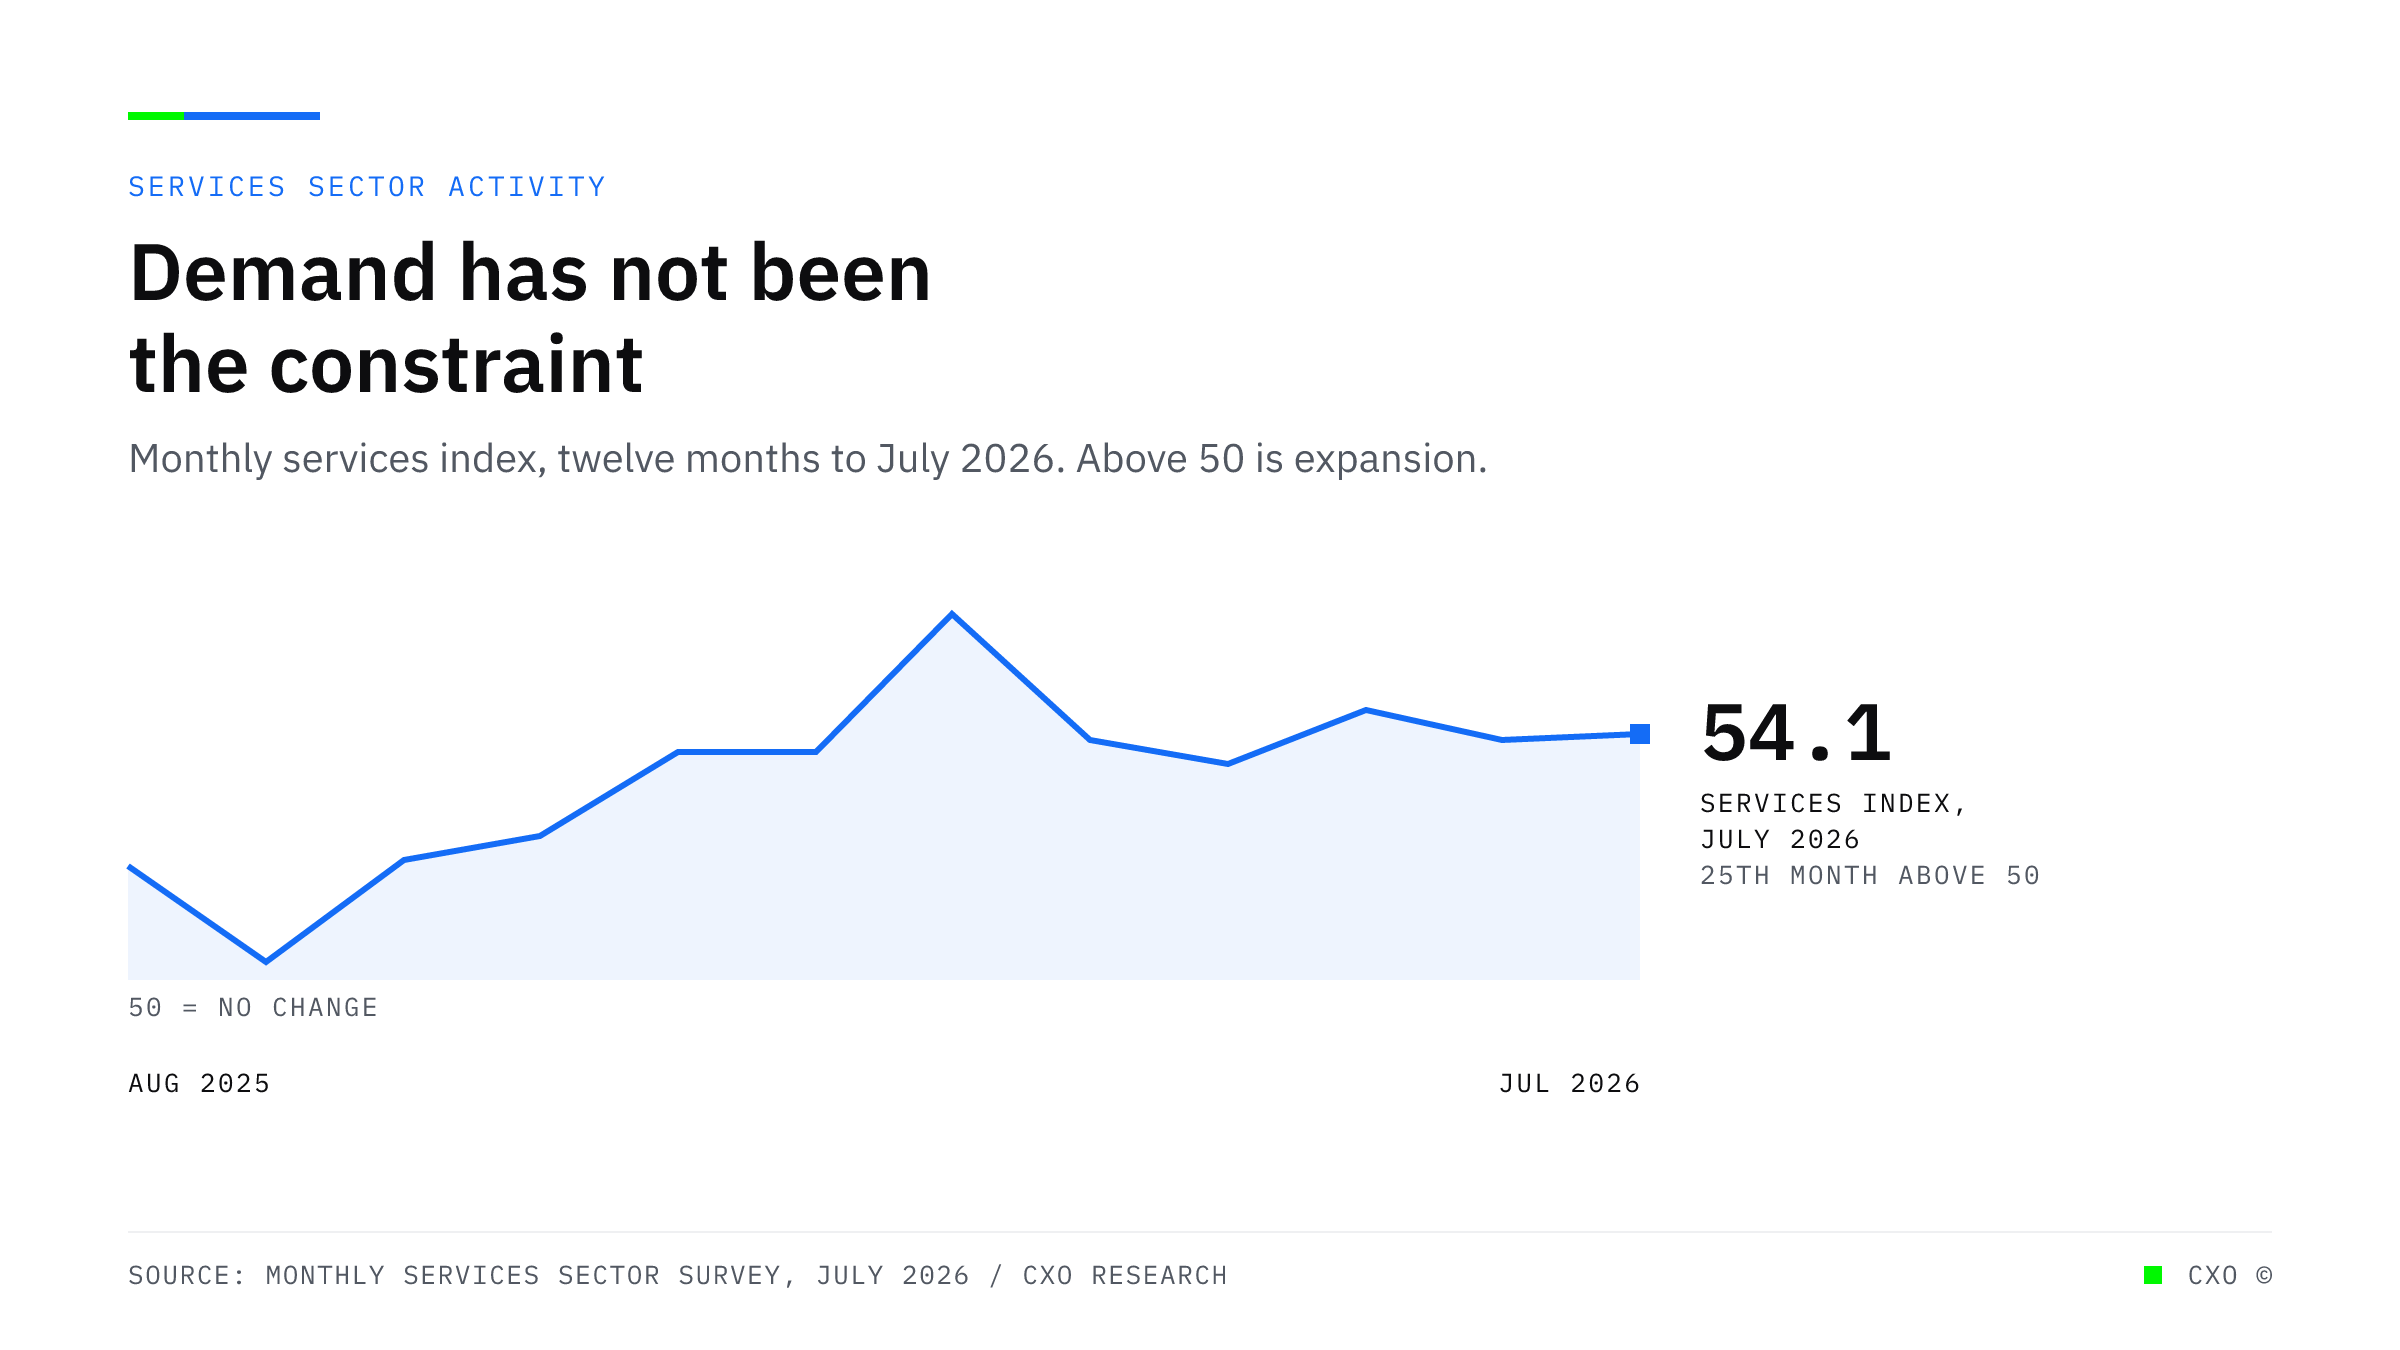
A line chart of the monthly services index across the twelve months to July 2026, holding above the 50 no-change line throughout and reading 54.1 in July, the twenty-fifth consecutive month of expansion.

Demand Has Not Been the Constraint for Twenty-Five Months. Delivery Capacity Has.

Services business activity jumped to 59.1 in July while the services employment index fell to 47.4. Demand keeps expanding and the payroll that delivers it keeps contracting.
View Insight
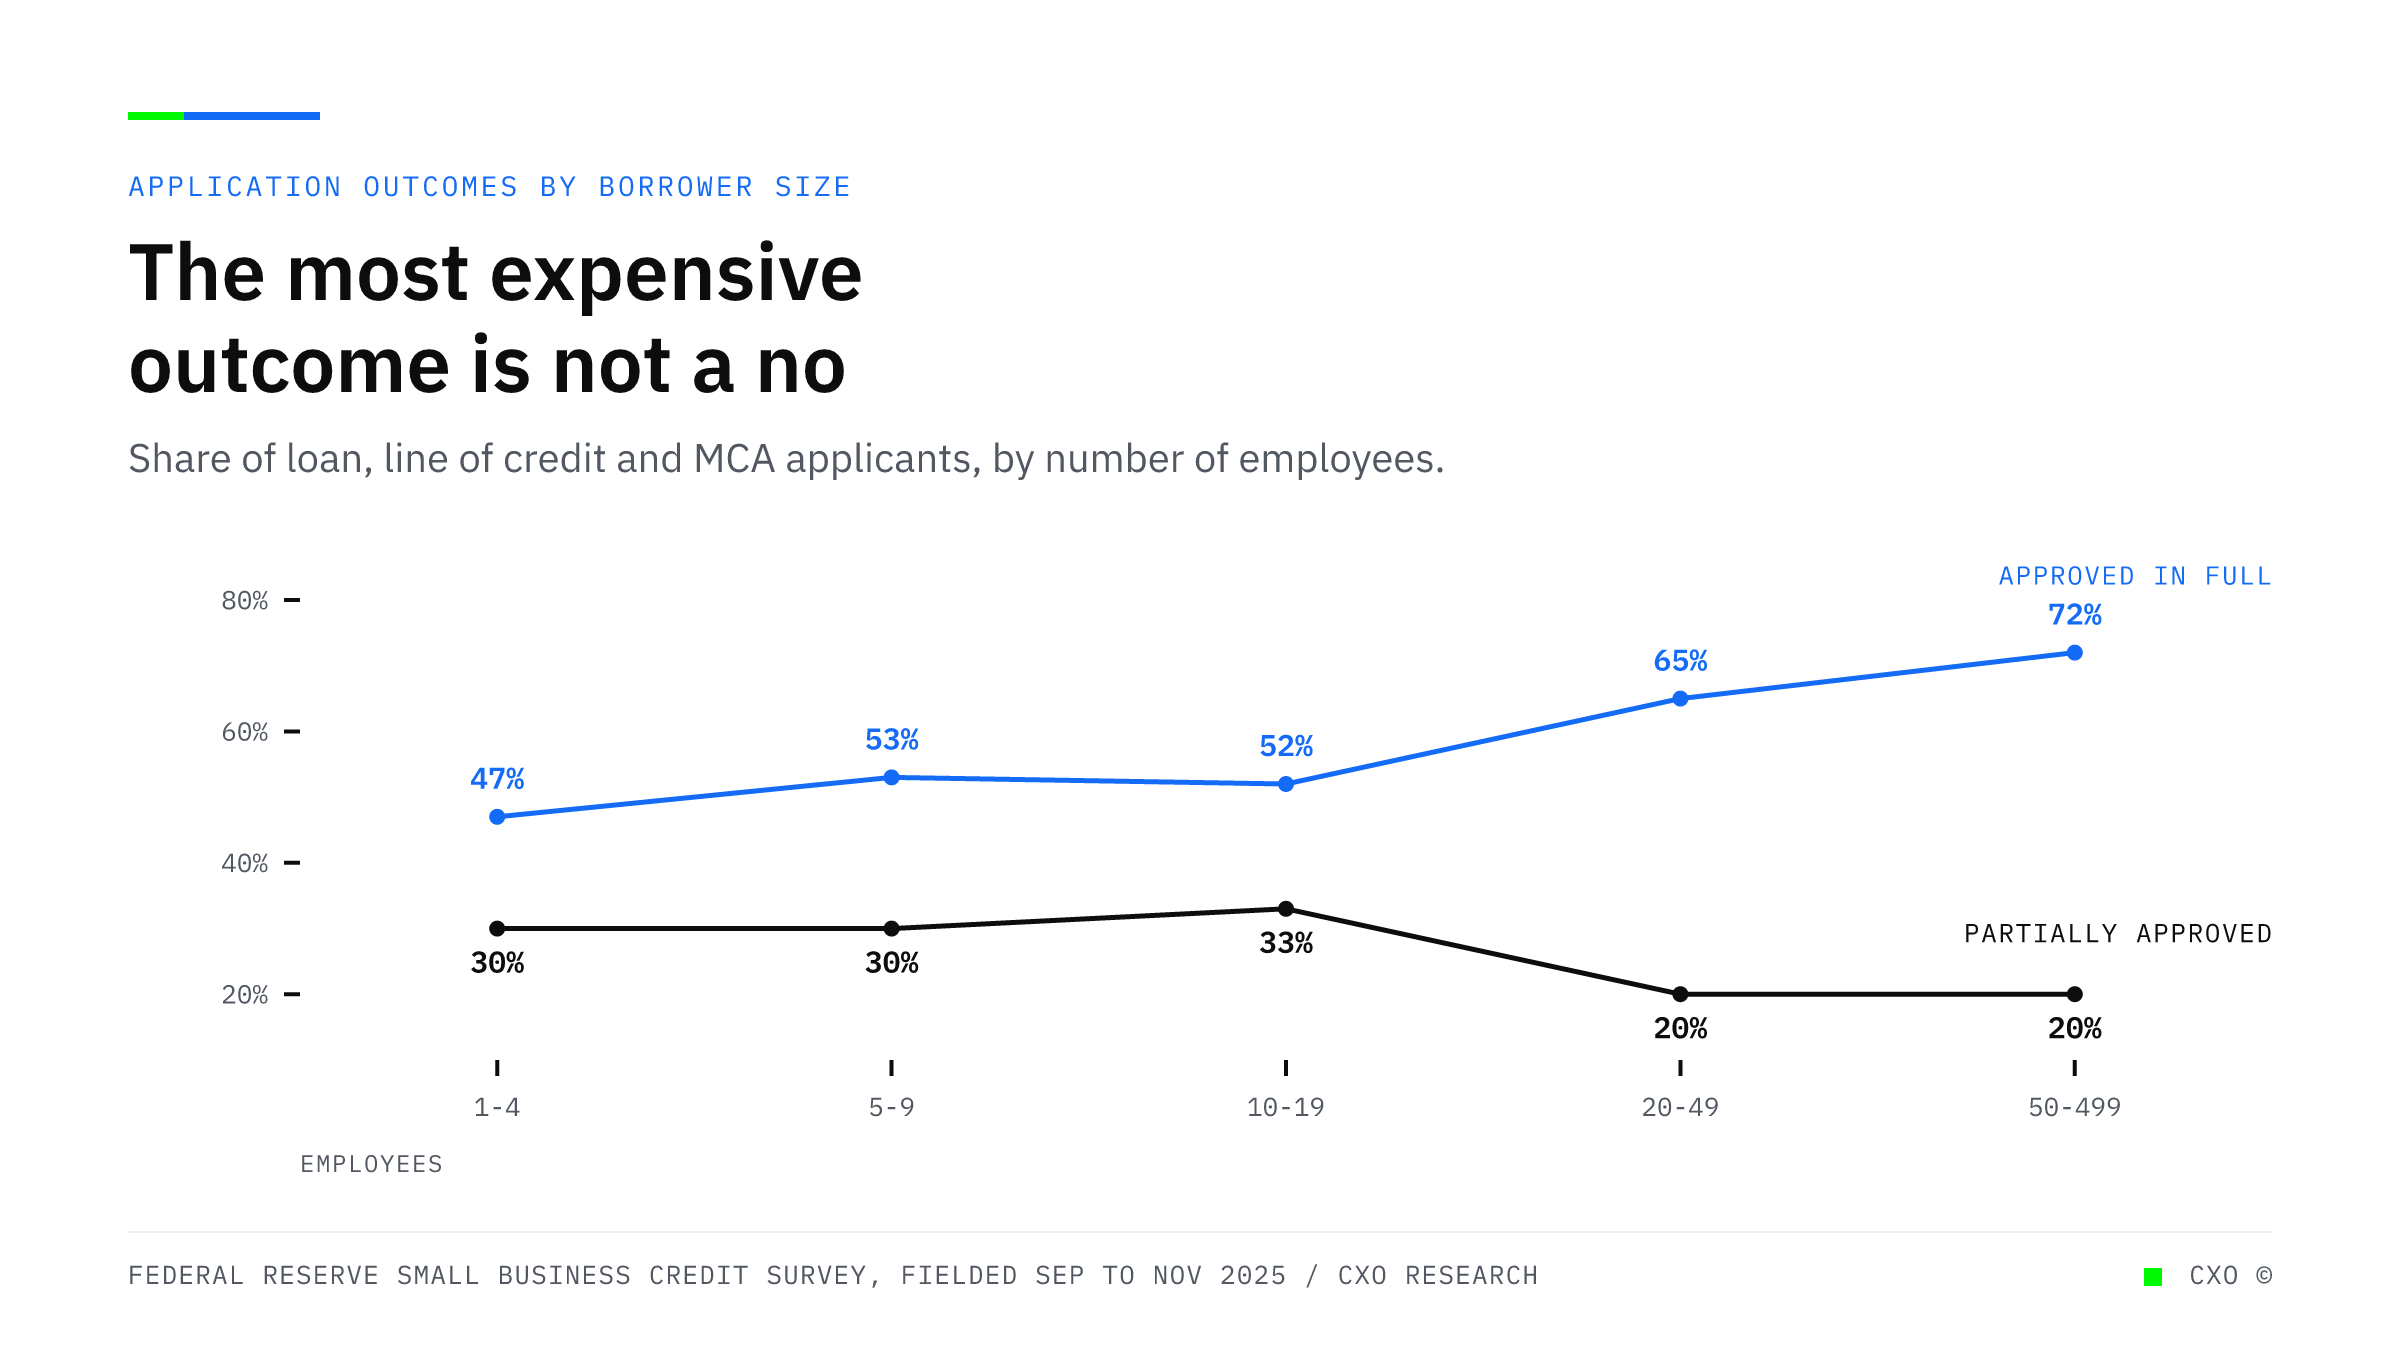
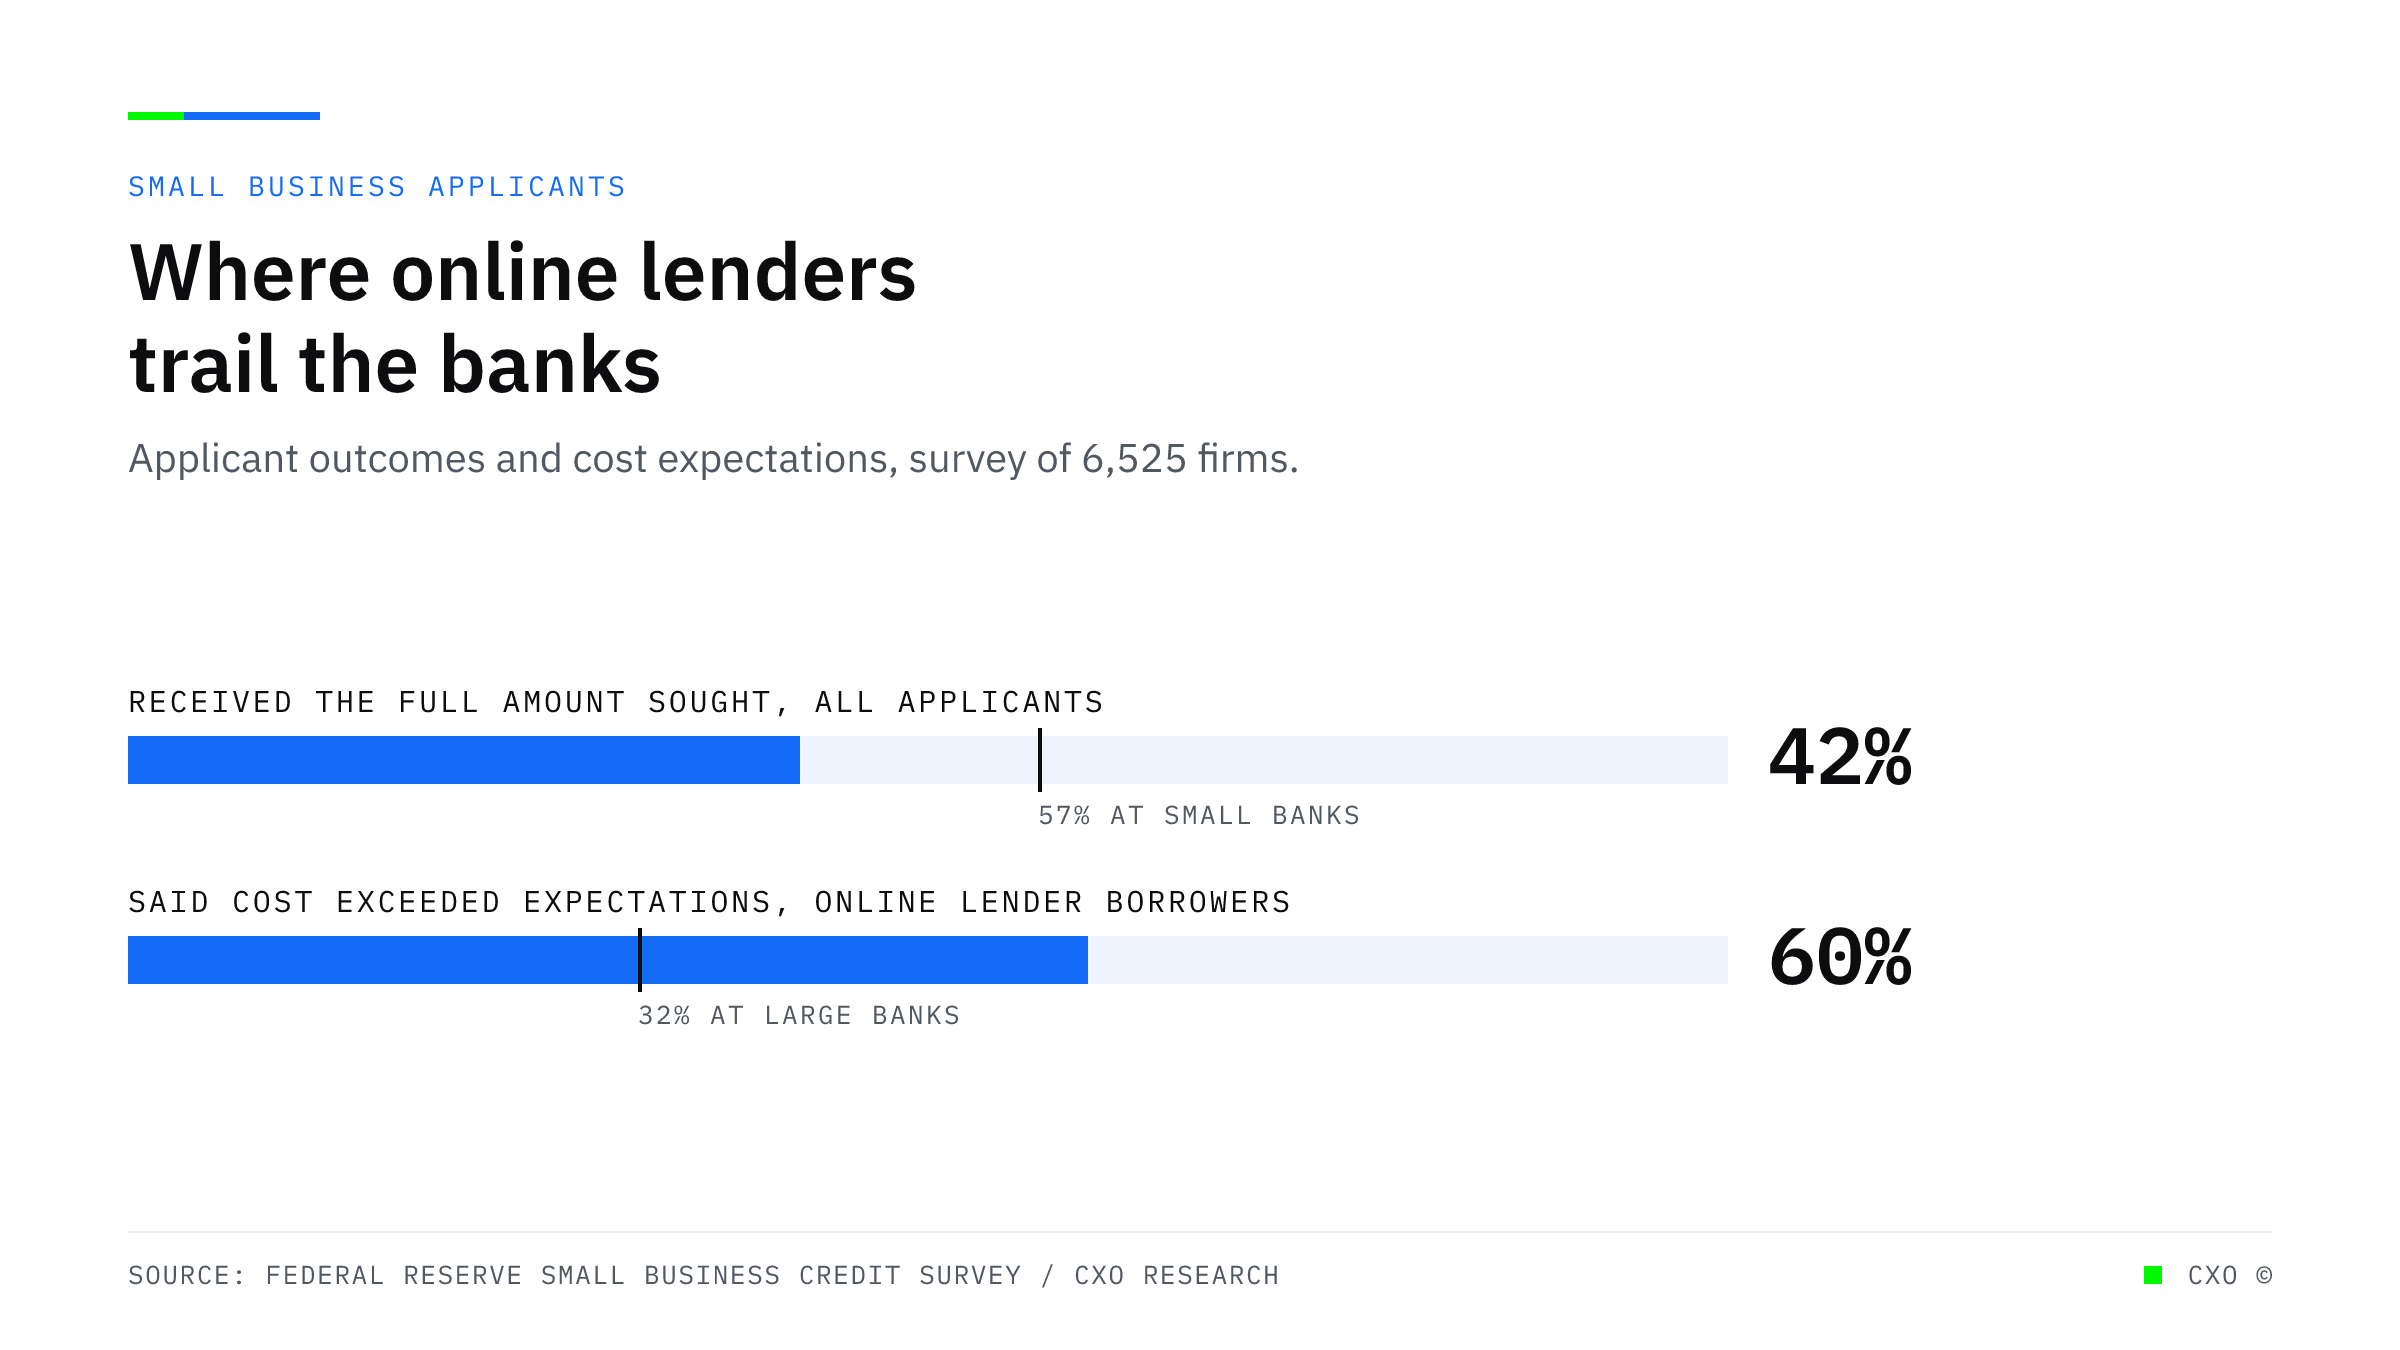
Two bullet bars comparing small business applicant outcomes against bank benchmarks: 42 percent received the full amount sought against 57 percent at small banks, and 60 percent of online lender borrowers said costs exceeded expectations against 32 percent at large banks.

Thirty-Six Percent of Applicants Got Part of What They Asked For. That Is Your Biggest Untouched Book.

Across small business applicants, 42 percent received the full amount sought and 36 percent received some or most. The partially funded group carries an unmet need, a completed file, and no owner.
View Insight
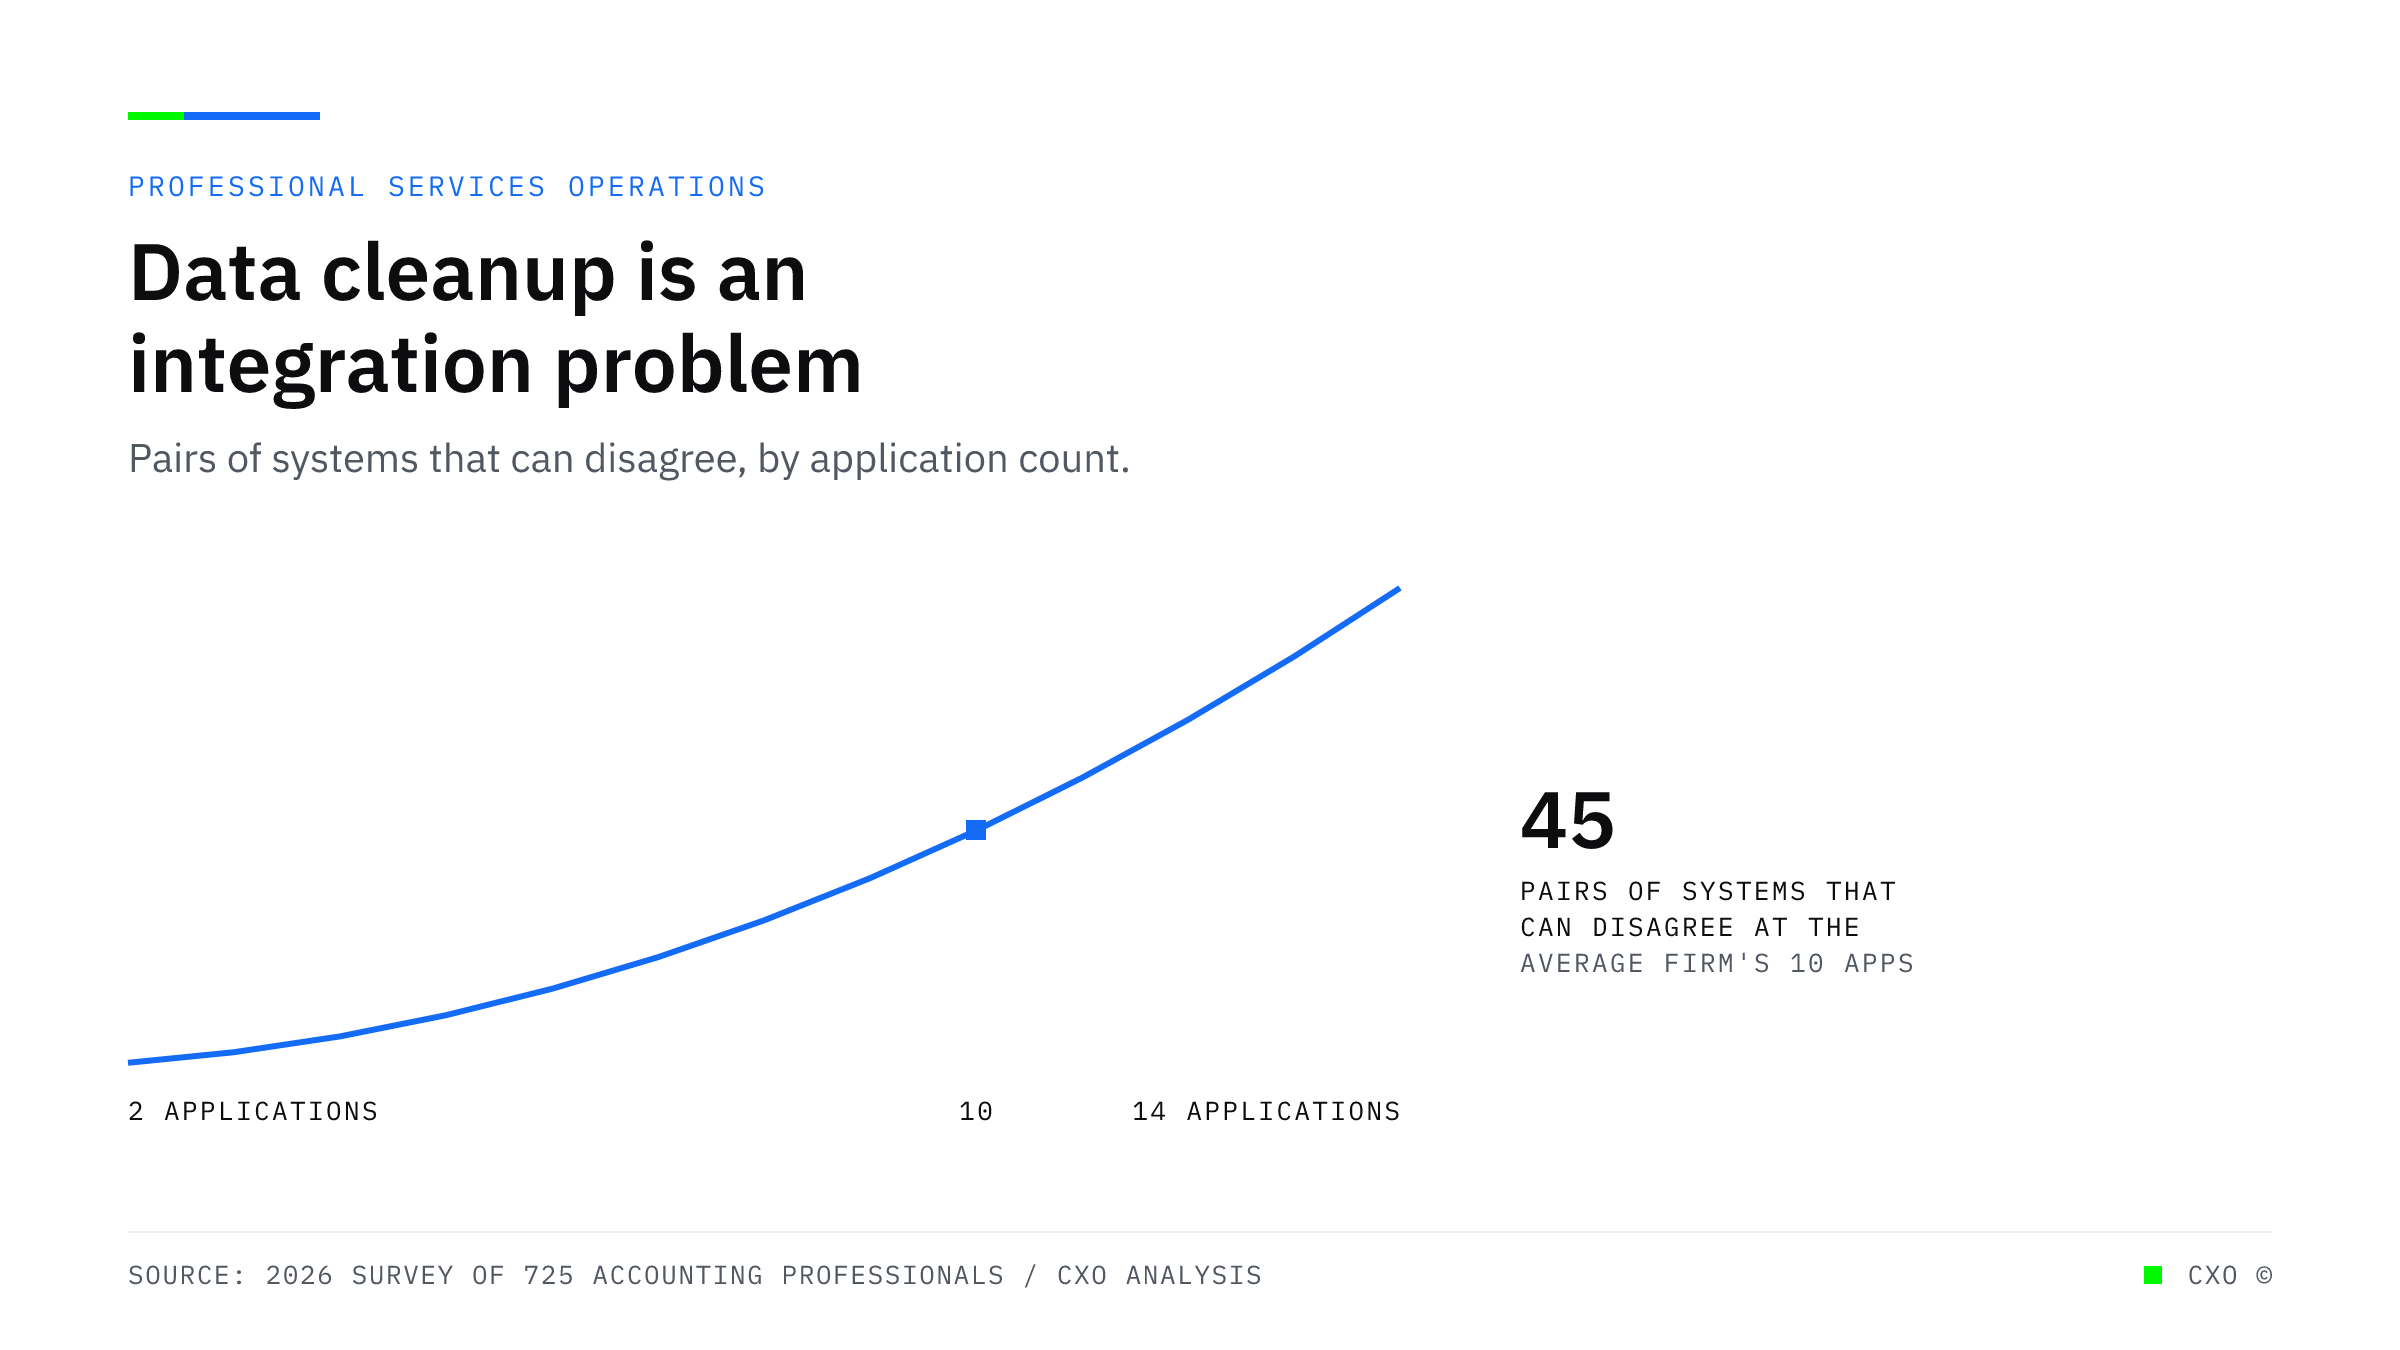
A rising curve showing that the number of system pairs that can disagree grows faster than the number of applications a firm runs, with the average firm's ten applications marked at 45 pairs.

The Top Barrier to Advisory Work Is Data Cleanup. That Is an Integration Problem.

Thirty percent of accounting professionals name manual data cleanup as the top barrier to advisory work, ahead of staffing. The average firm runs ten applications and loses five hours a week to re-entry.
View Insight
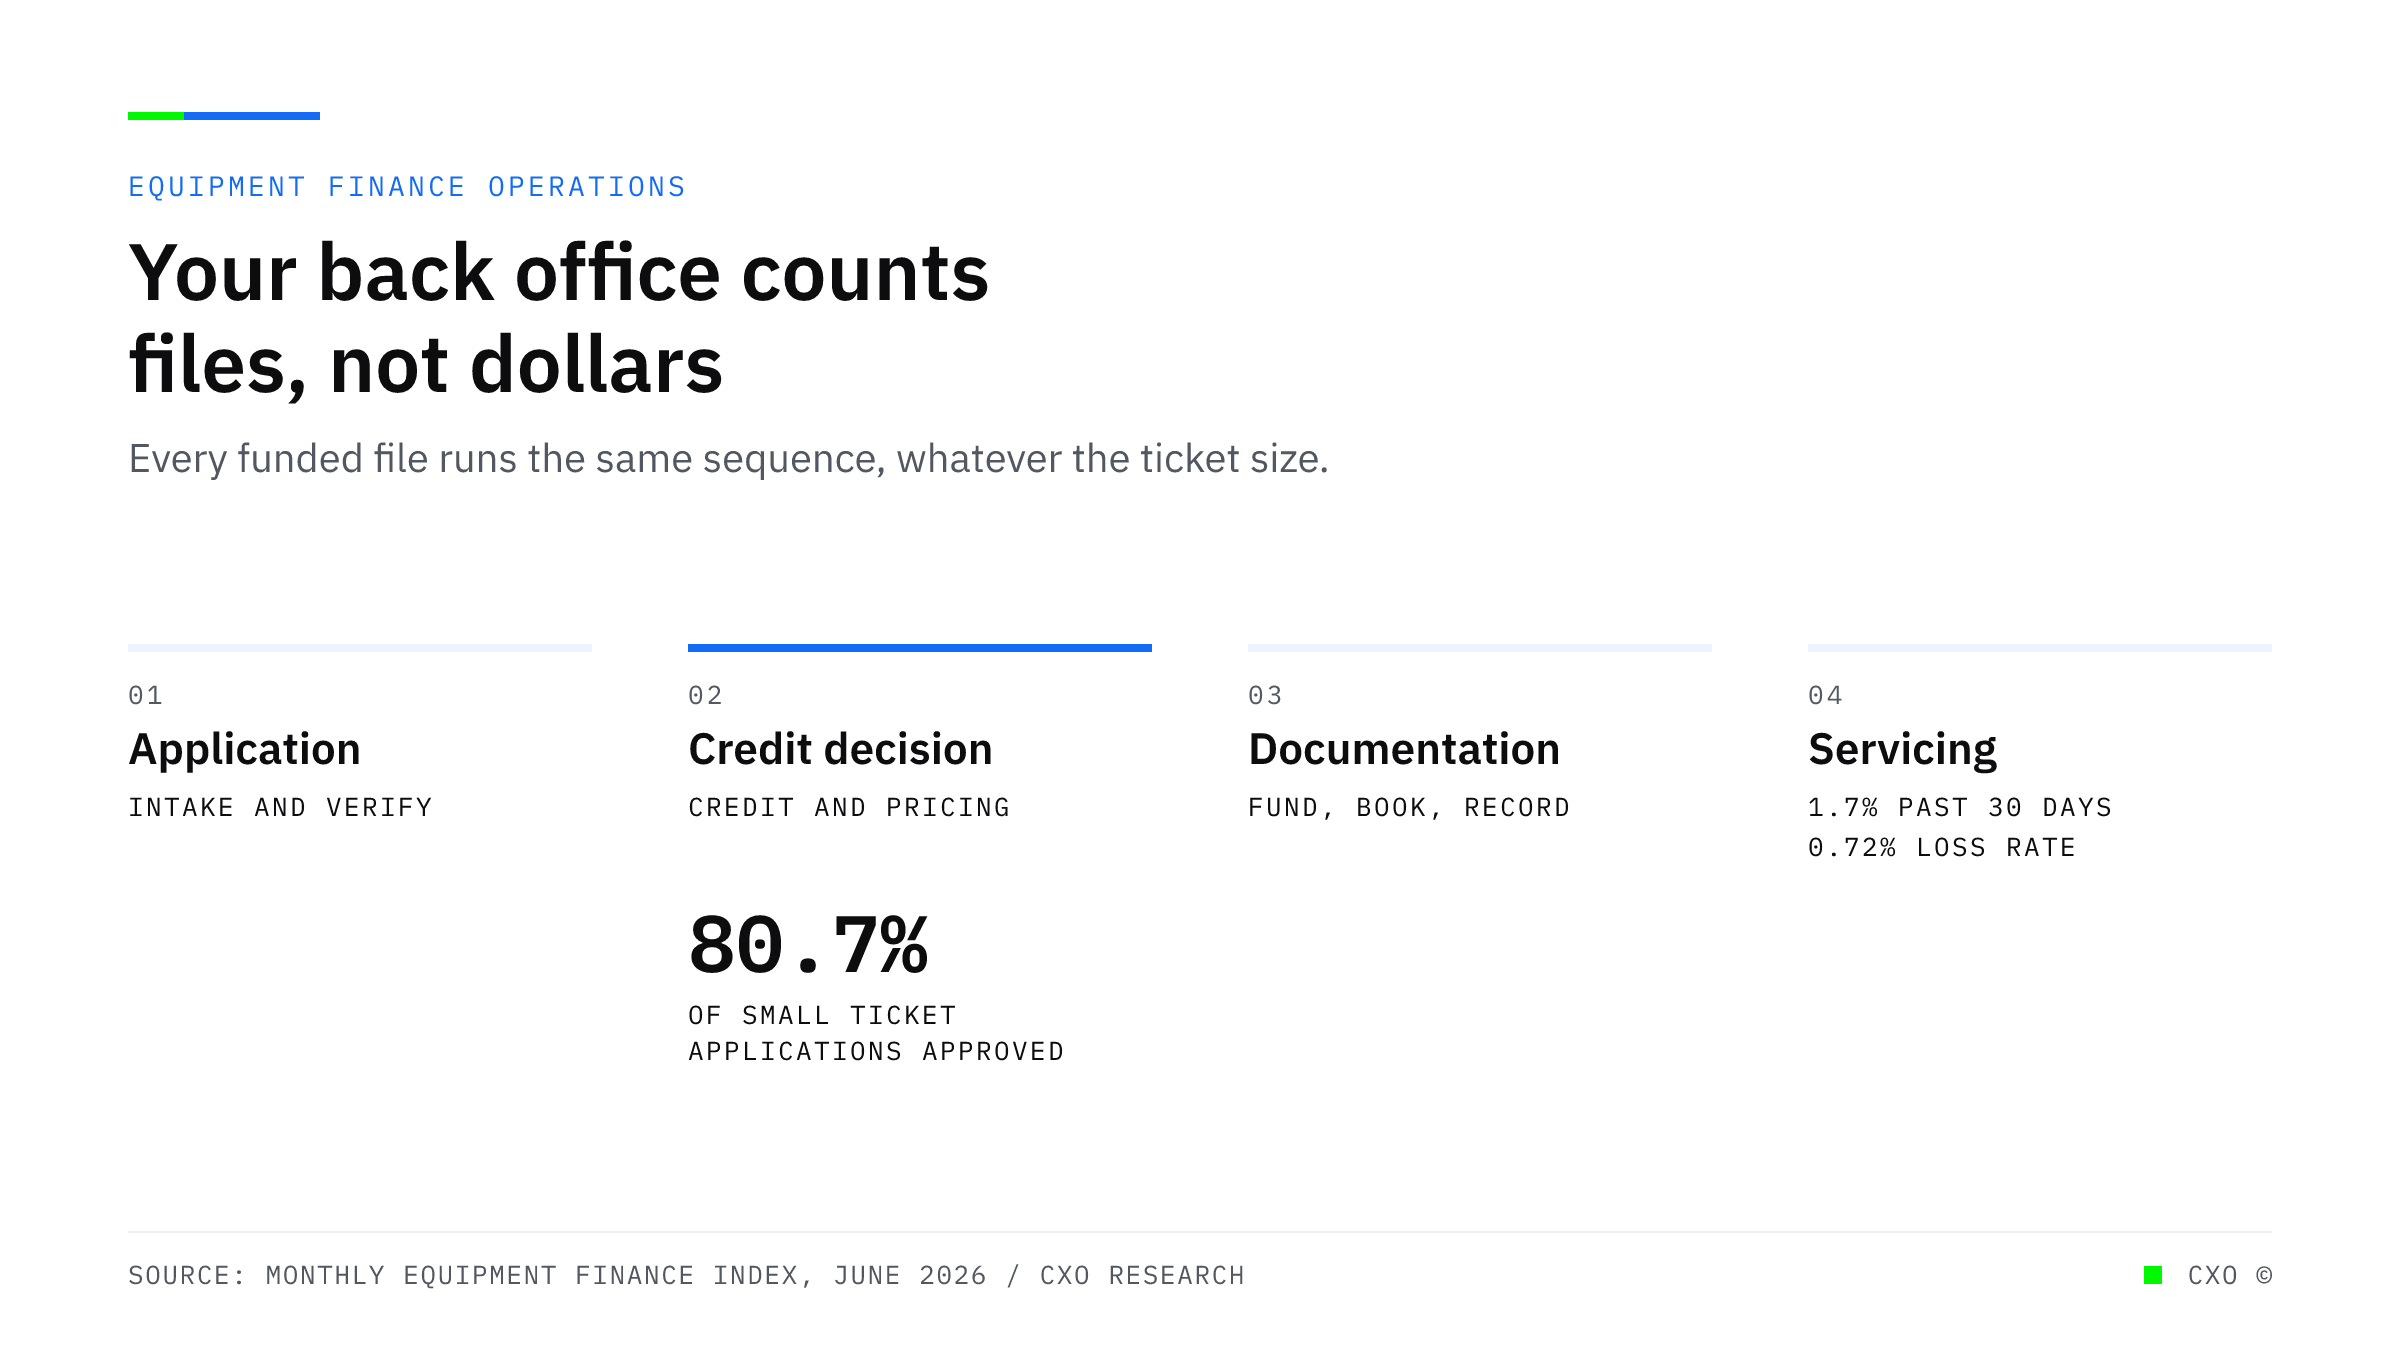
A labelled diagram of a small ticket equipment finance file moving through application, credit decision, documentation and servicing, with 80.7 percent of small ticket applications approved at the decision stage.

Small Ticket Volume Is Up 25.8 Percent. Your Back Office Counts Files, Not Dollars.

Equipment finance small ticket volume is up 25.8 percent year to date against 11.3 percent for the industry. That growth arrives as file count, and a back office charges by the file.
View Insight
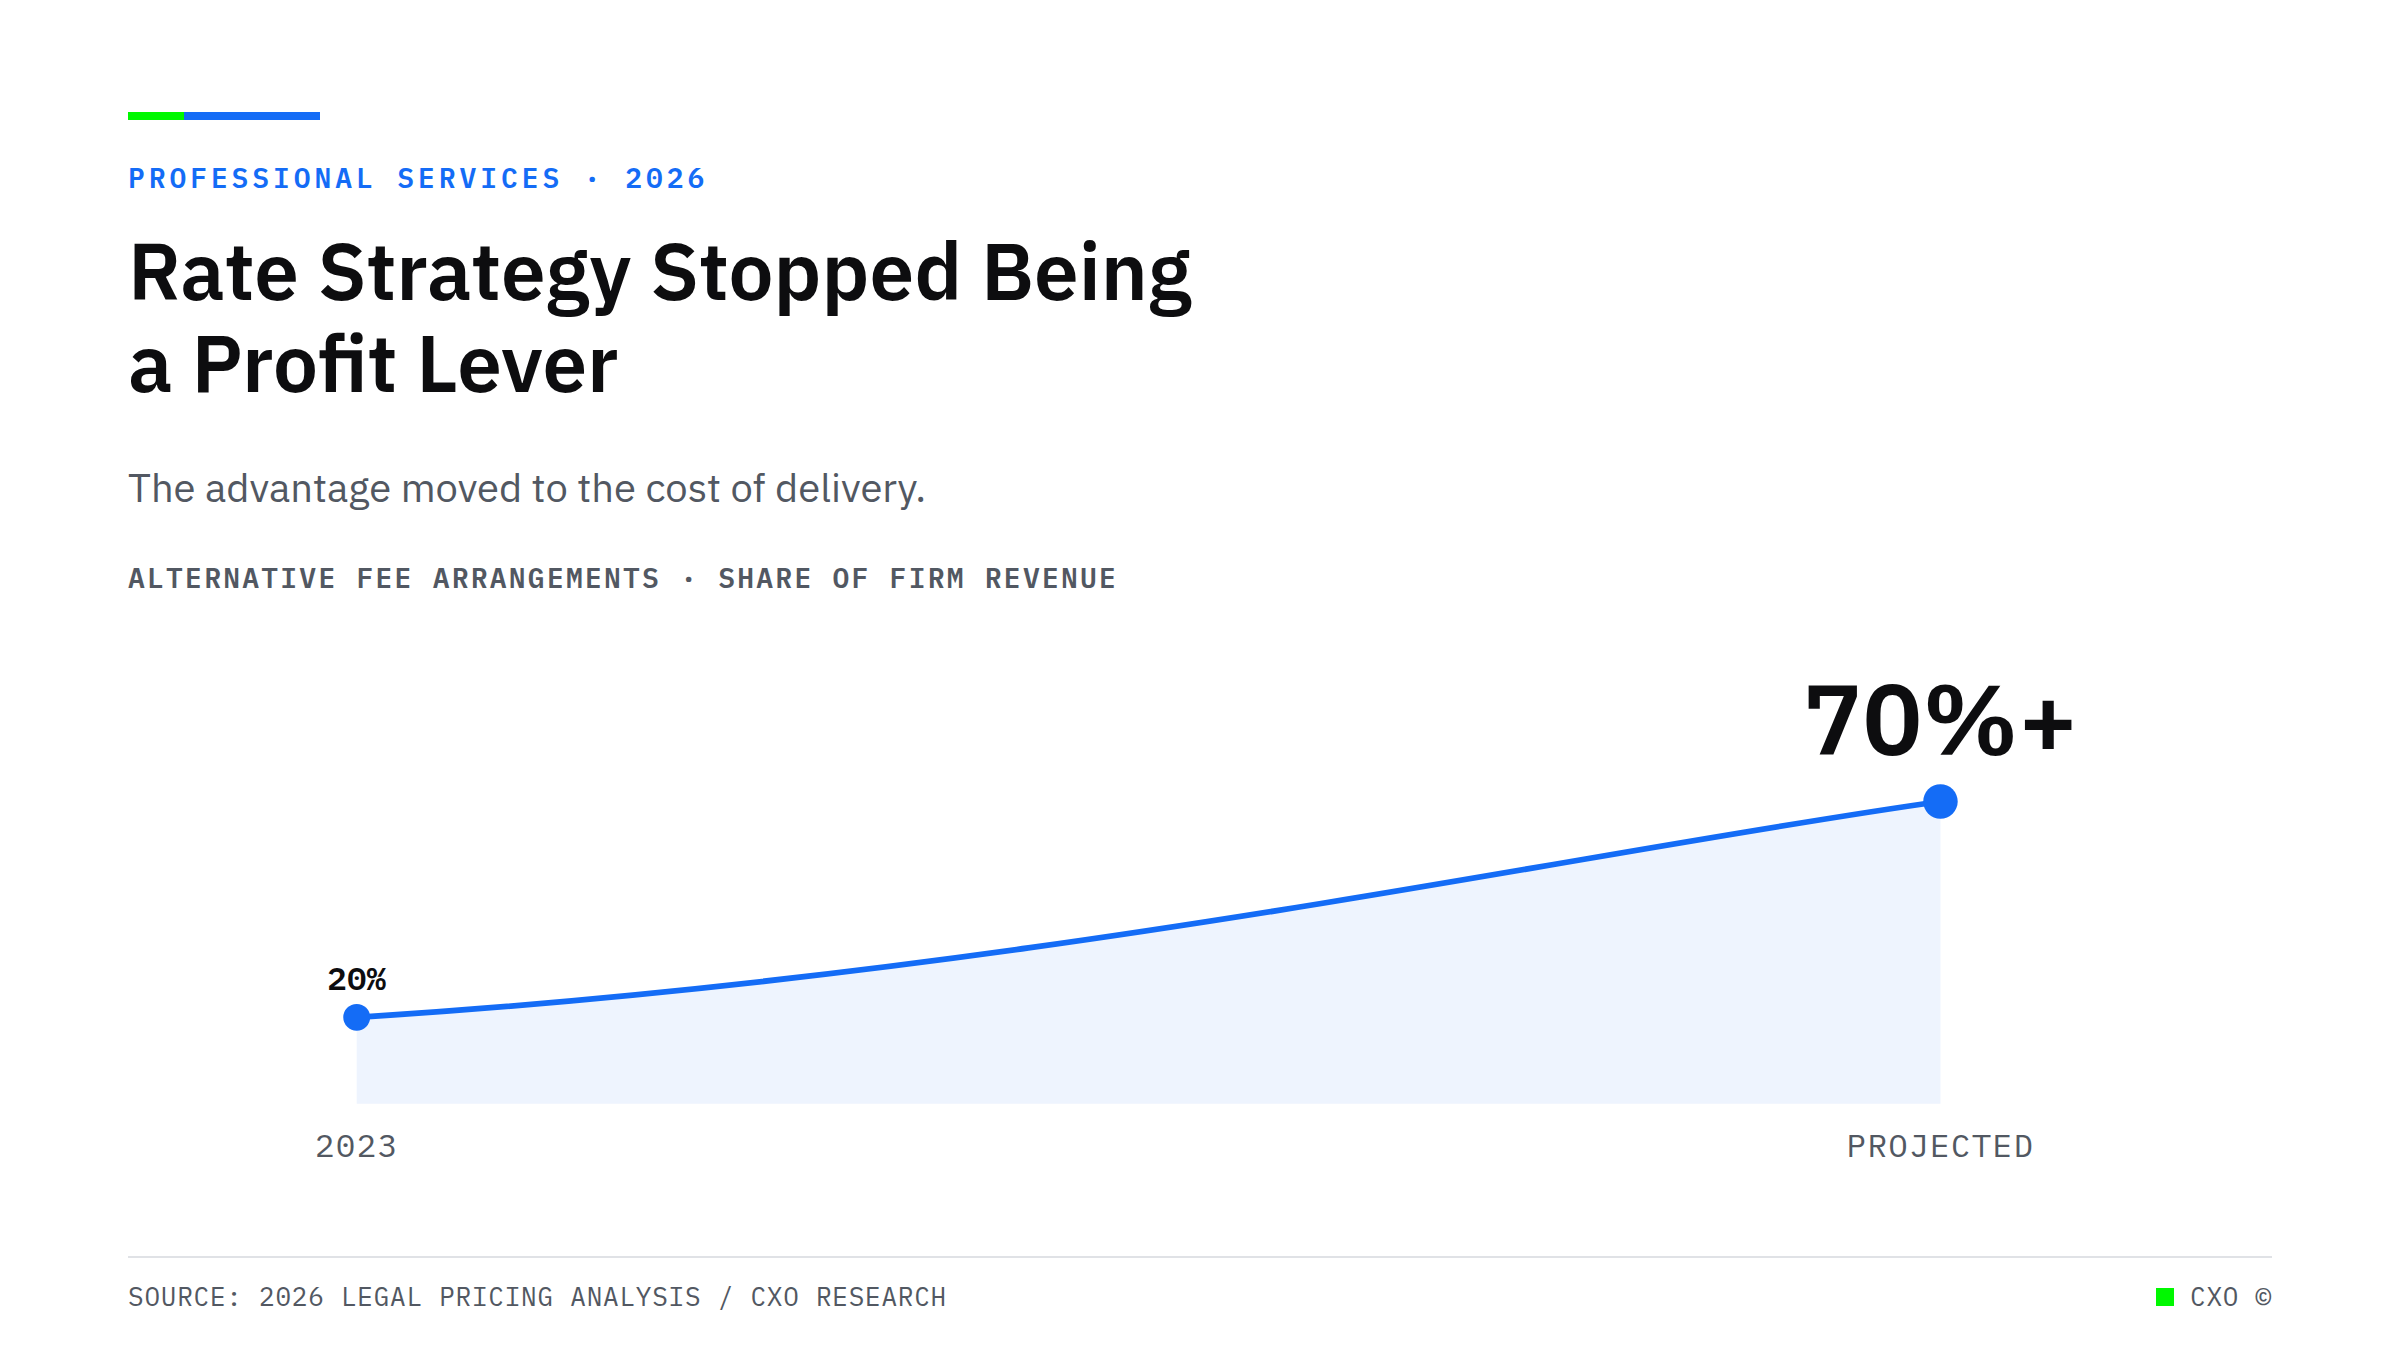
CXO editorial cover charting alternative fee arrangements as a share of firm revenue, rising from about 20% in 2023 toward a projected 70% or more, illustrating that rate strategy has stopped being a profit lever and margin now depends on the cost of delivery.

Rate Strategy Stopped Being a Lever. Your Advantage Moved to the Cost of Delivery.

2026 rate data shows firms collect the same effective rate whether they discount hard or hold firm. Pricing power is neutral. The margin lever that still moves is the cost of delivery.
View Insight
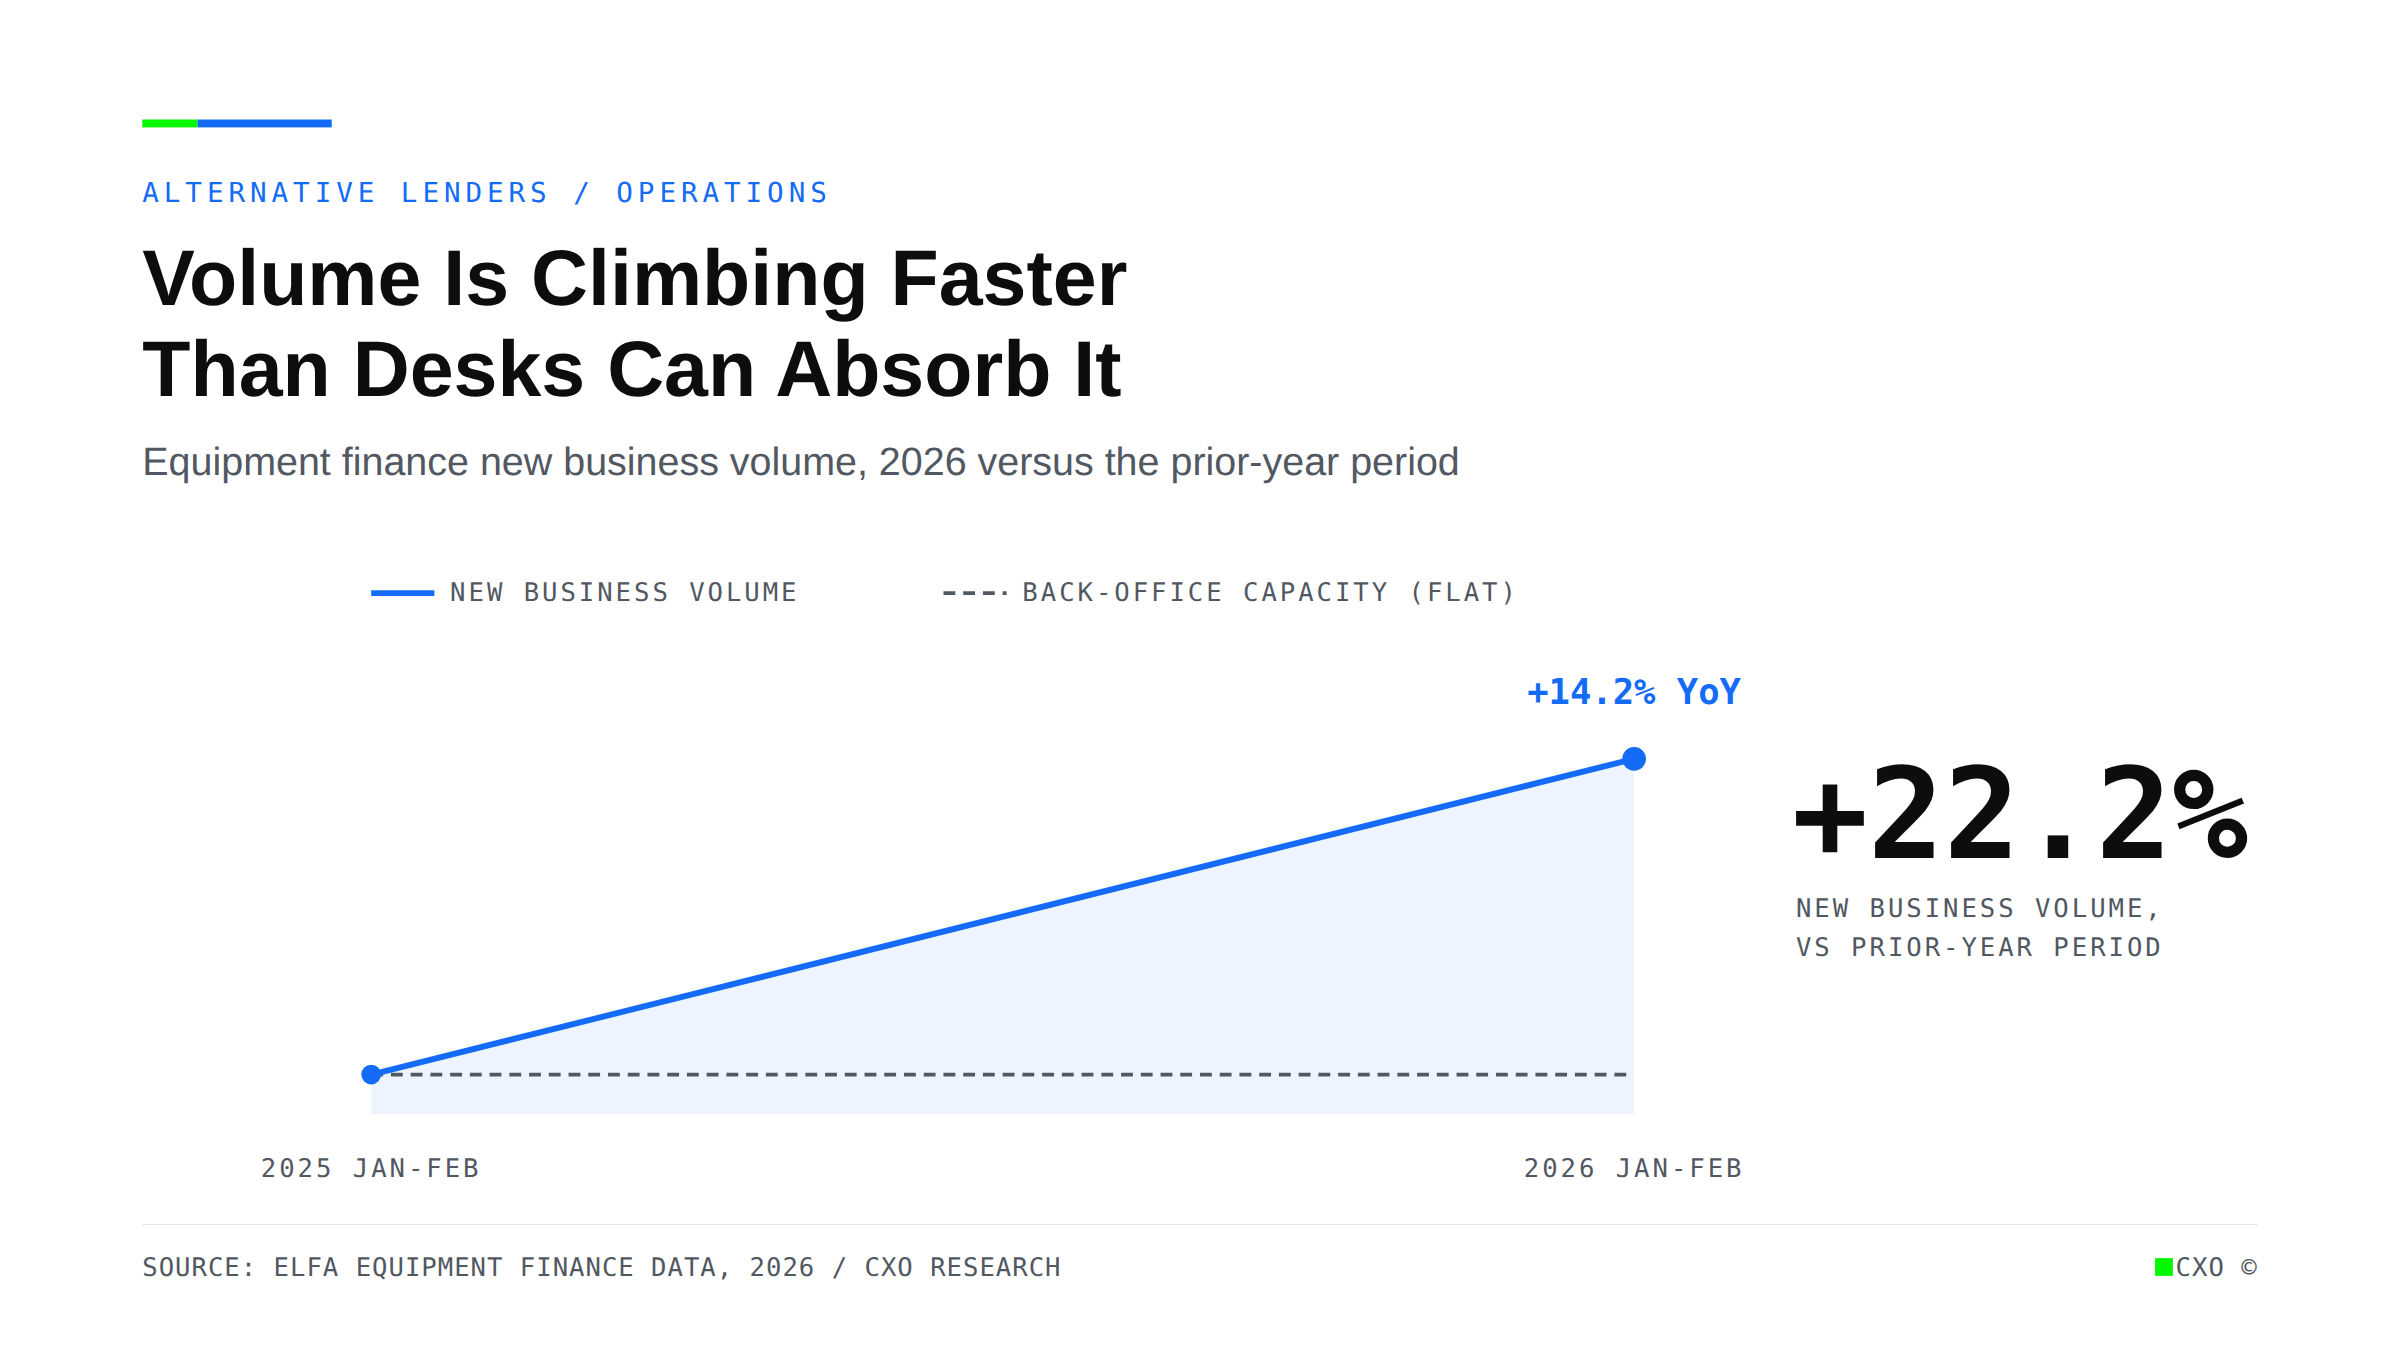
Line chart showing equipment finance new business volume rising 22.2% versus the prior-year period while back-office capacity stays flat, opening a widening operational gap.

Equipment Finance Volume Is Up Twenty-Two Percent. The Desks Processing It Did Not Grow Twenty-Two Percent.

Equipment finance volume is up 22.2% in early 2026, but the desks processing it did not grow with it. Why hiring through a surge fails, and how lenders scale volume without scaling headcount.
View Insight

Ready to put agentic AI to work?

See where automation can take the manual, repetitive work off your team. Book a discovery call and we'll map the highest-impact processes in your operation.

Book a discovery call