Tag

back-office automation

19 insights

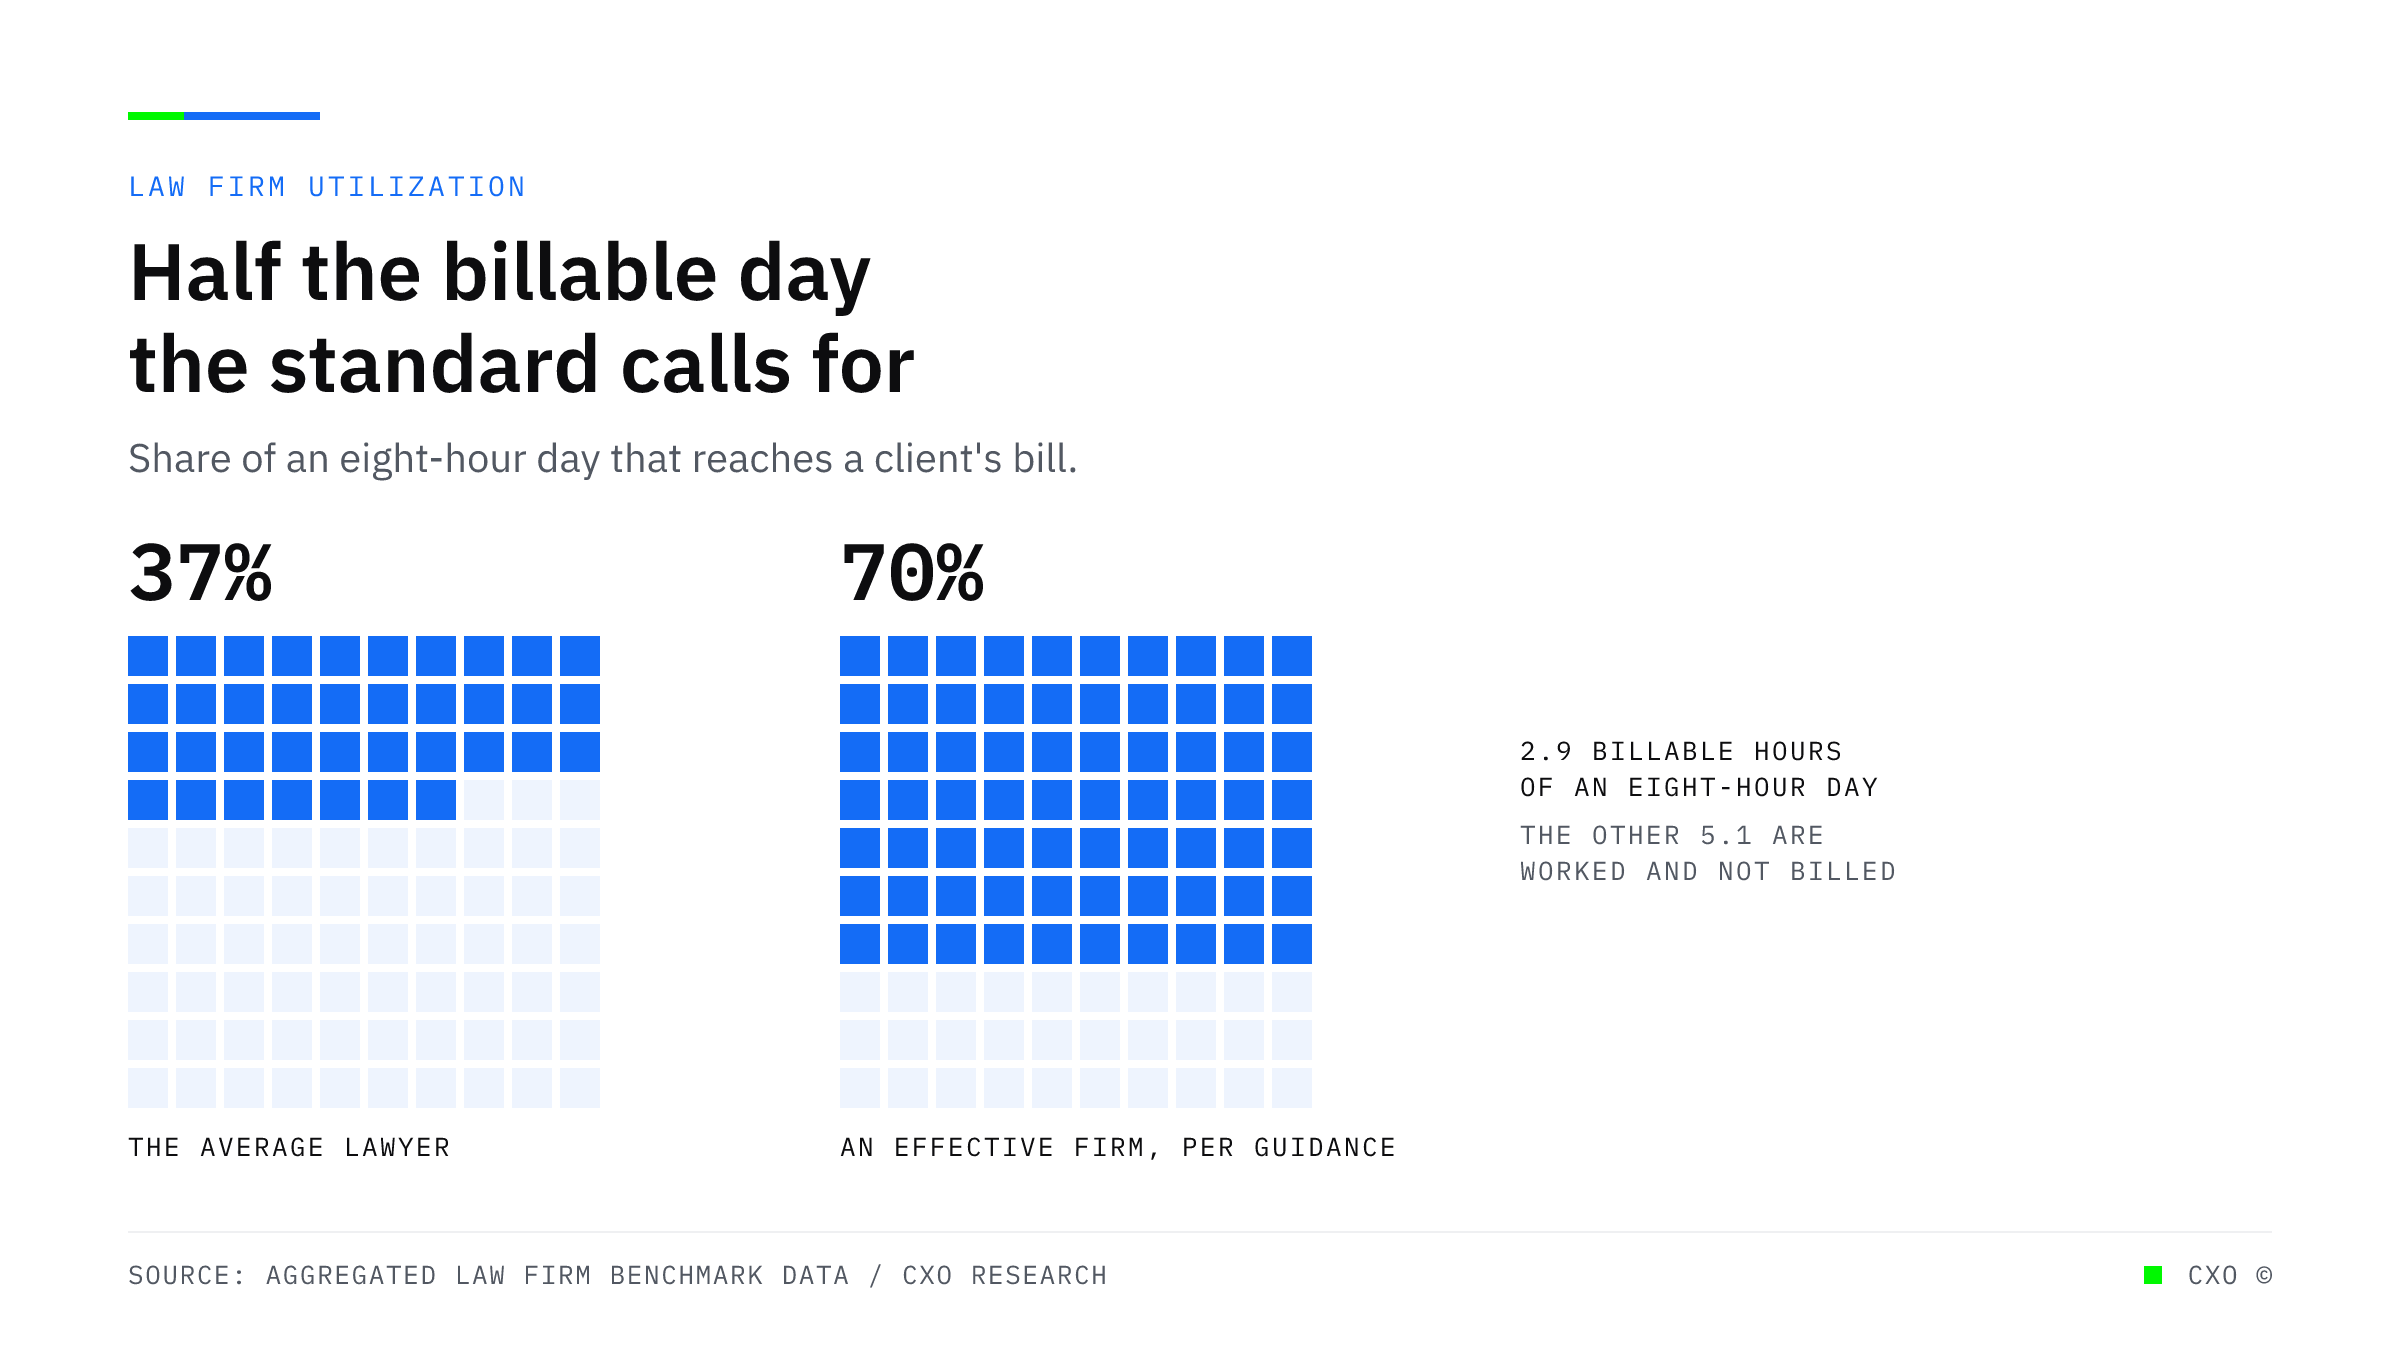
Two grids of 100 squares comparing the average lawyer's utilization rate of 37 percent against the 70 percent minimum the profession's own guidance sets for an effective firm.

The Average Lawyer Bills 2.9 Hours of an Eight-Hour Day

Utilization across law firms averages 37 percent against a 70 percent benchmark for an effective firm. It climbs with headcount, which tells you exactly what the constraint is.
View Insight
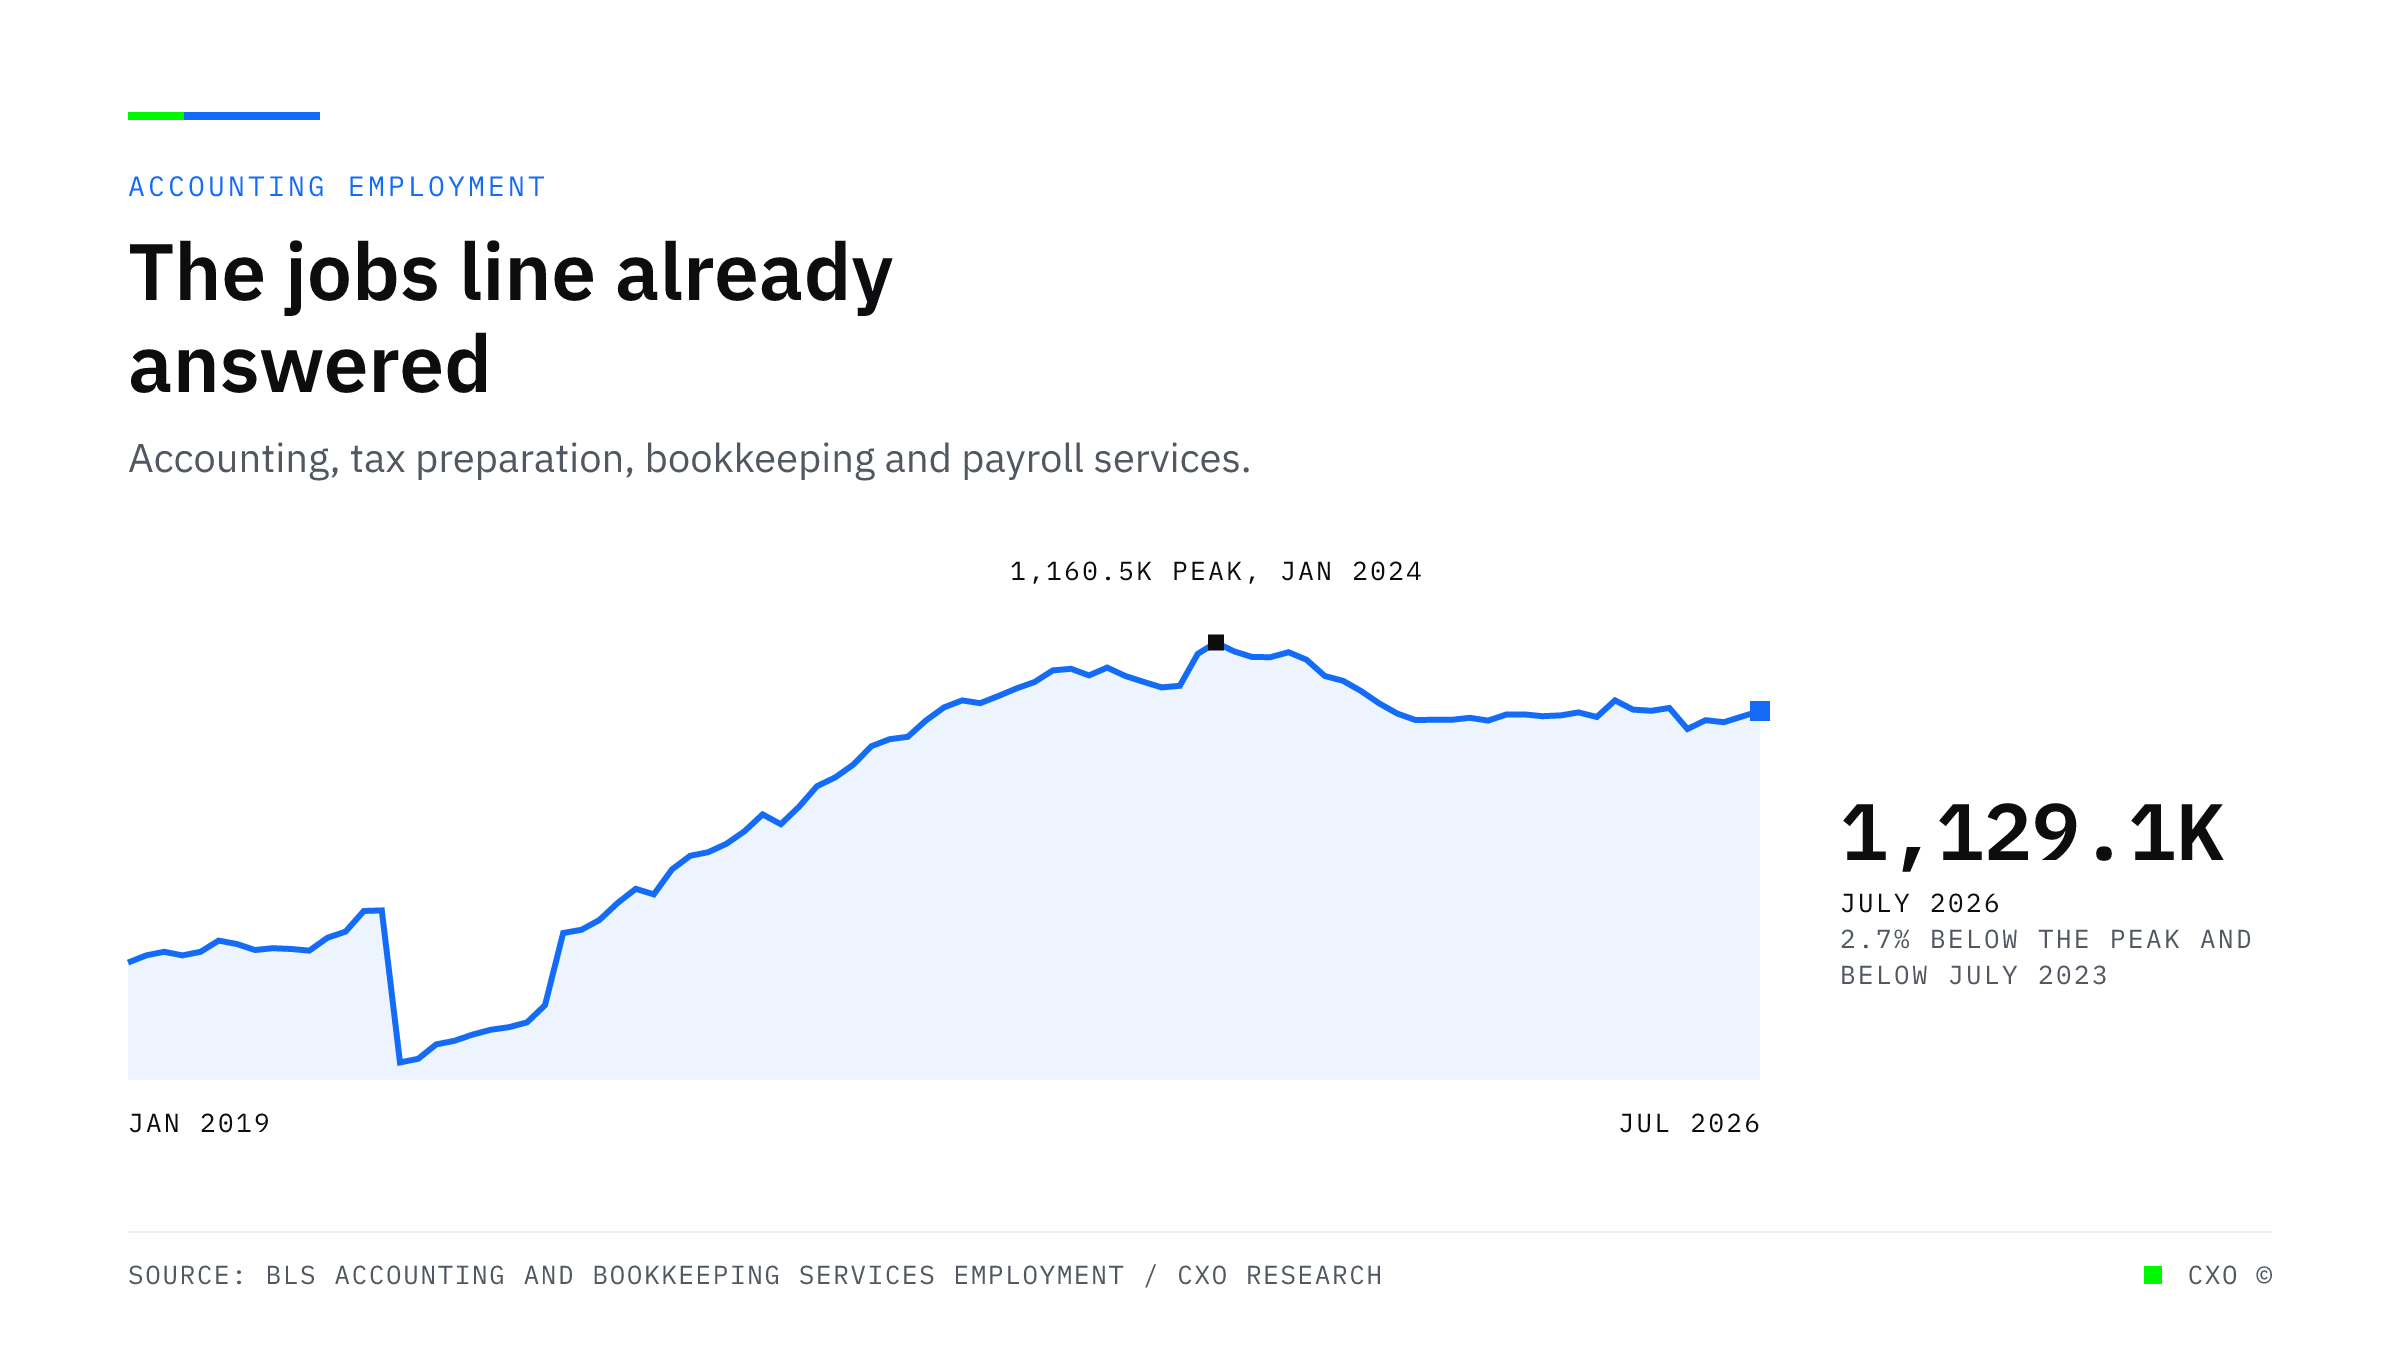
A line chart of monthly employment in accounting, tax preparation, bookkeeping and payroll services, peaking at 1,160,500 in January 2024 and standing at 1,129,100 in July 2026.

The Pipeline Is Refilling at the Front. Your Capacity Problem Is at the Back.

Accounting enrollment rose 8.9 percent to 205,180, a third straight increase. Graduates fell 6.6 percent and new CPA exam candidates dropped from 42,626 to 28,082 over the same stretch.
View Insight
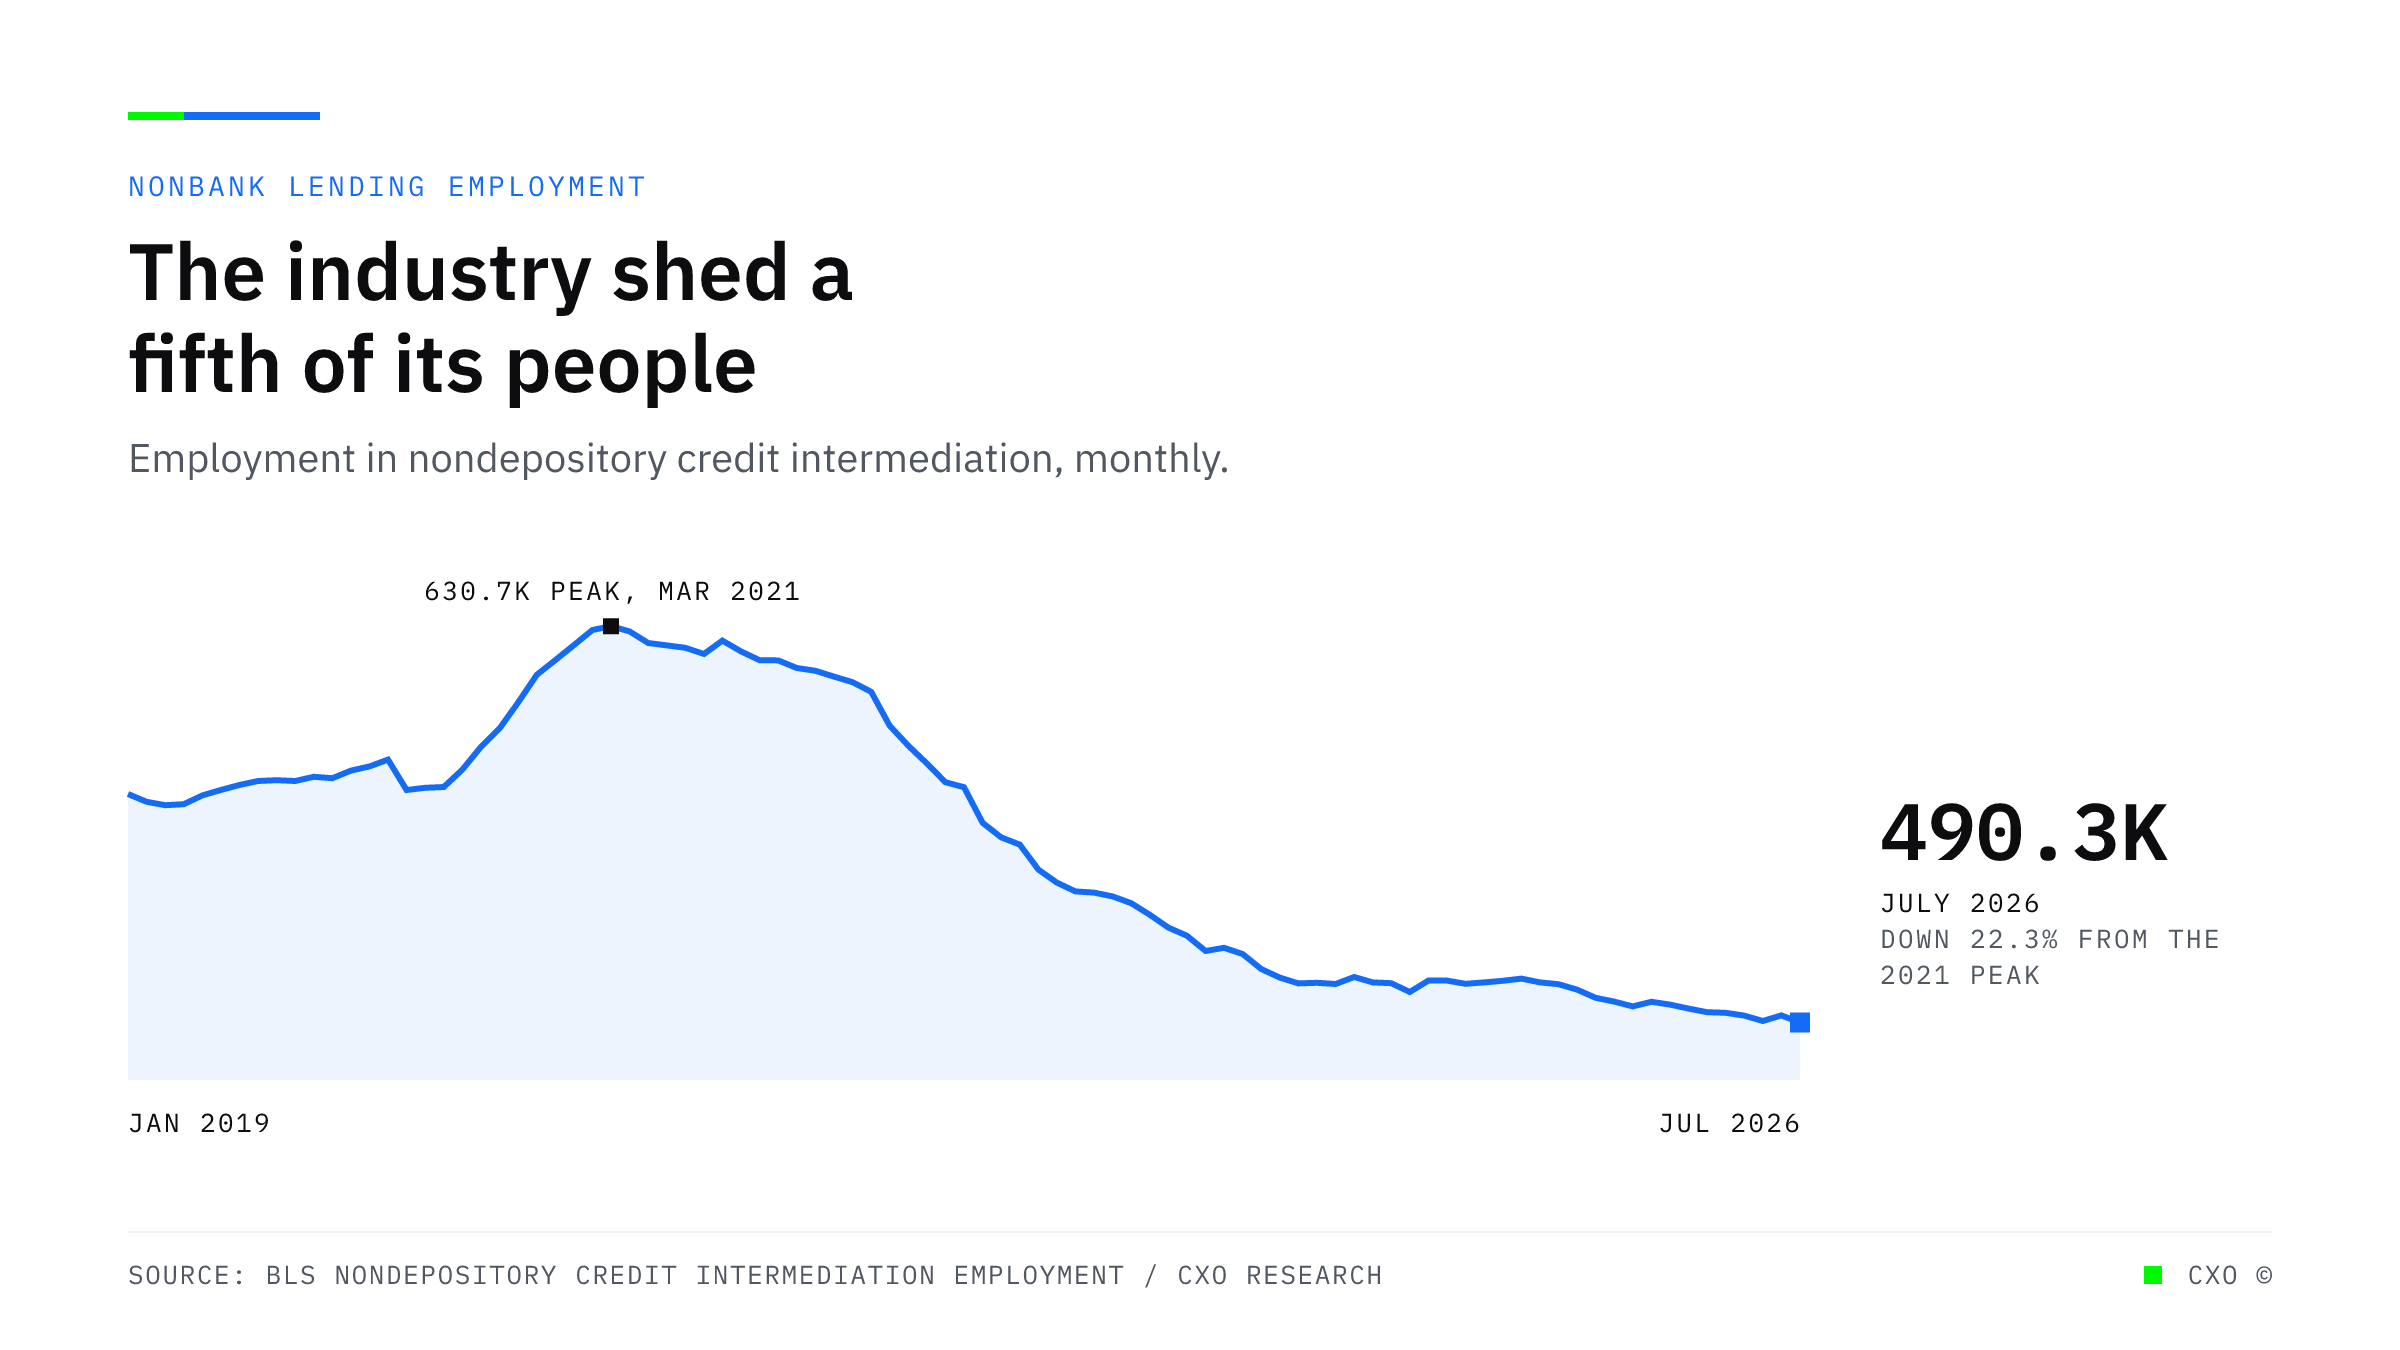
A curve of monthly employment in nondepository credit intermediation, peaking at 630,700 in March 2021 and falling steadily to 490,300 in July 2026, a decline of 22.3 percent.

The Industry Has 140,000 Fewer People Than in 2021 and a Larger Share of the Applications

Employment in nondepository credit intermediation has fallen 22.3 percent from its 2021 peak and is still declining, while the share of small business applicants going to online lenders rose to 29 percent.
View Insight
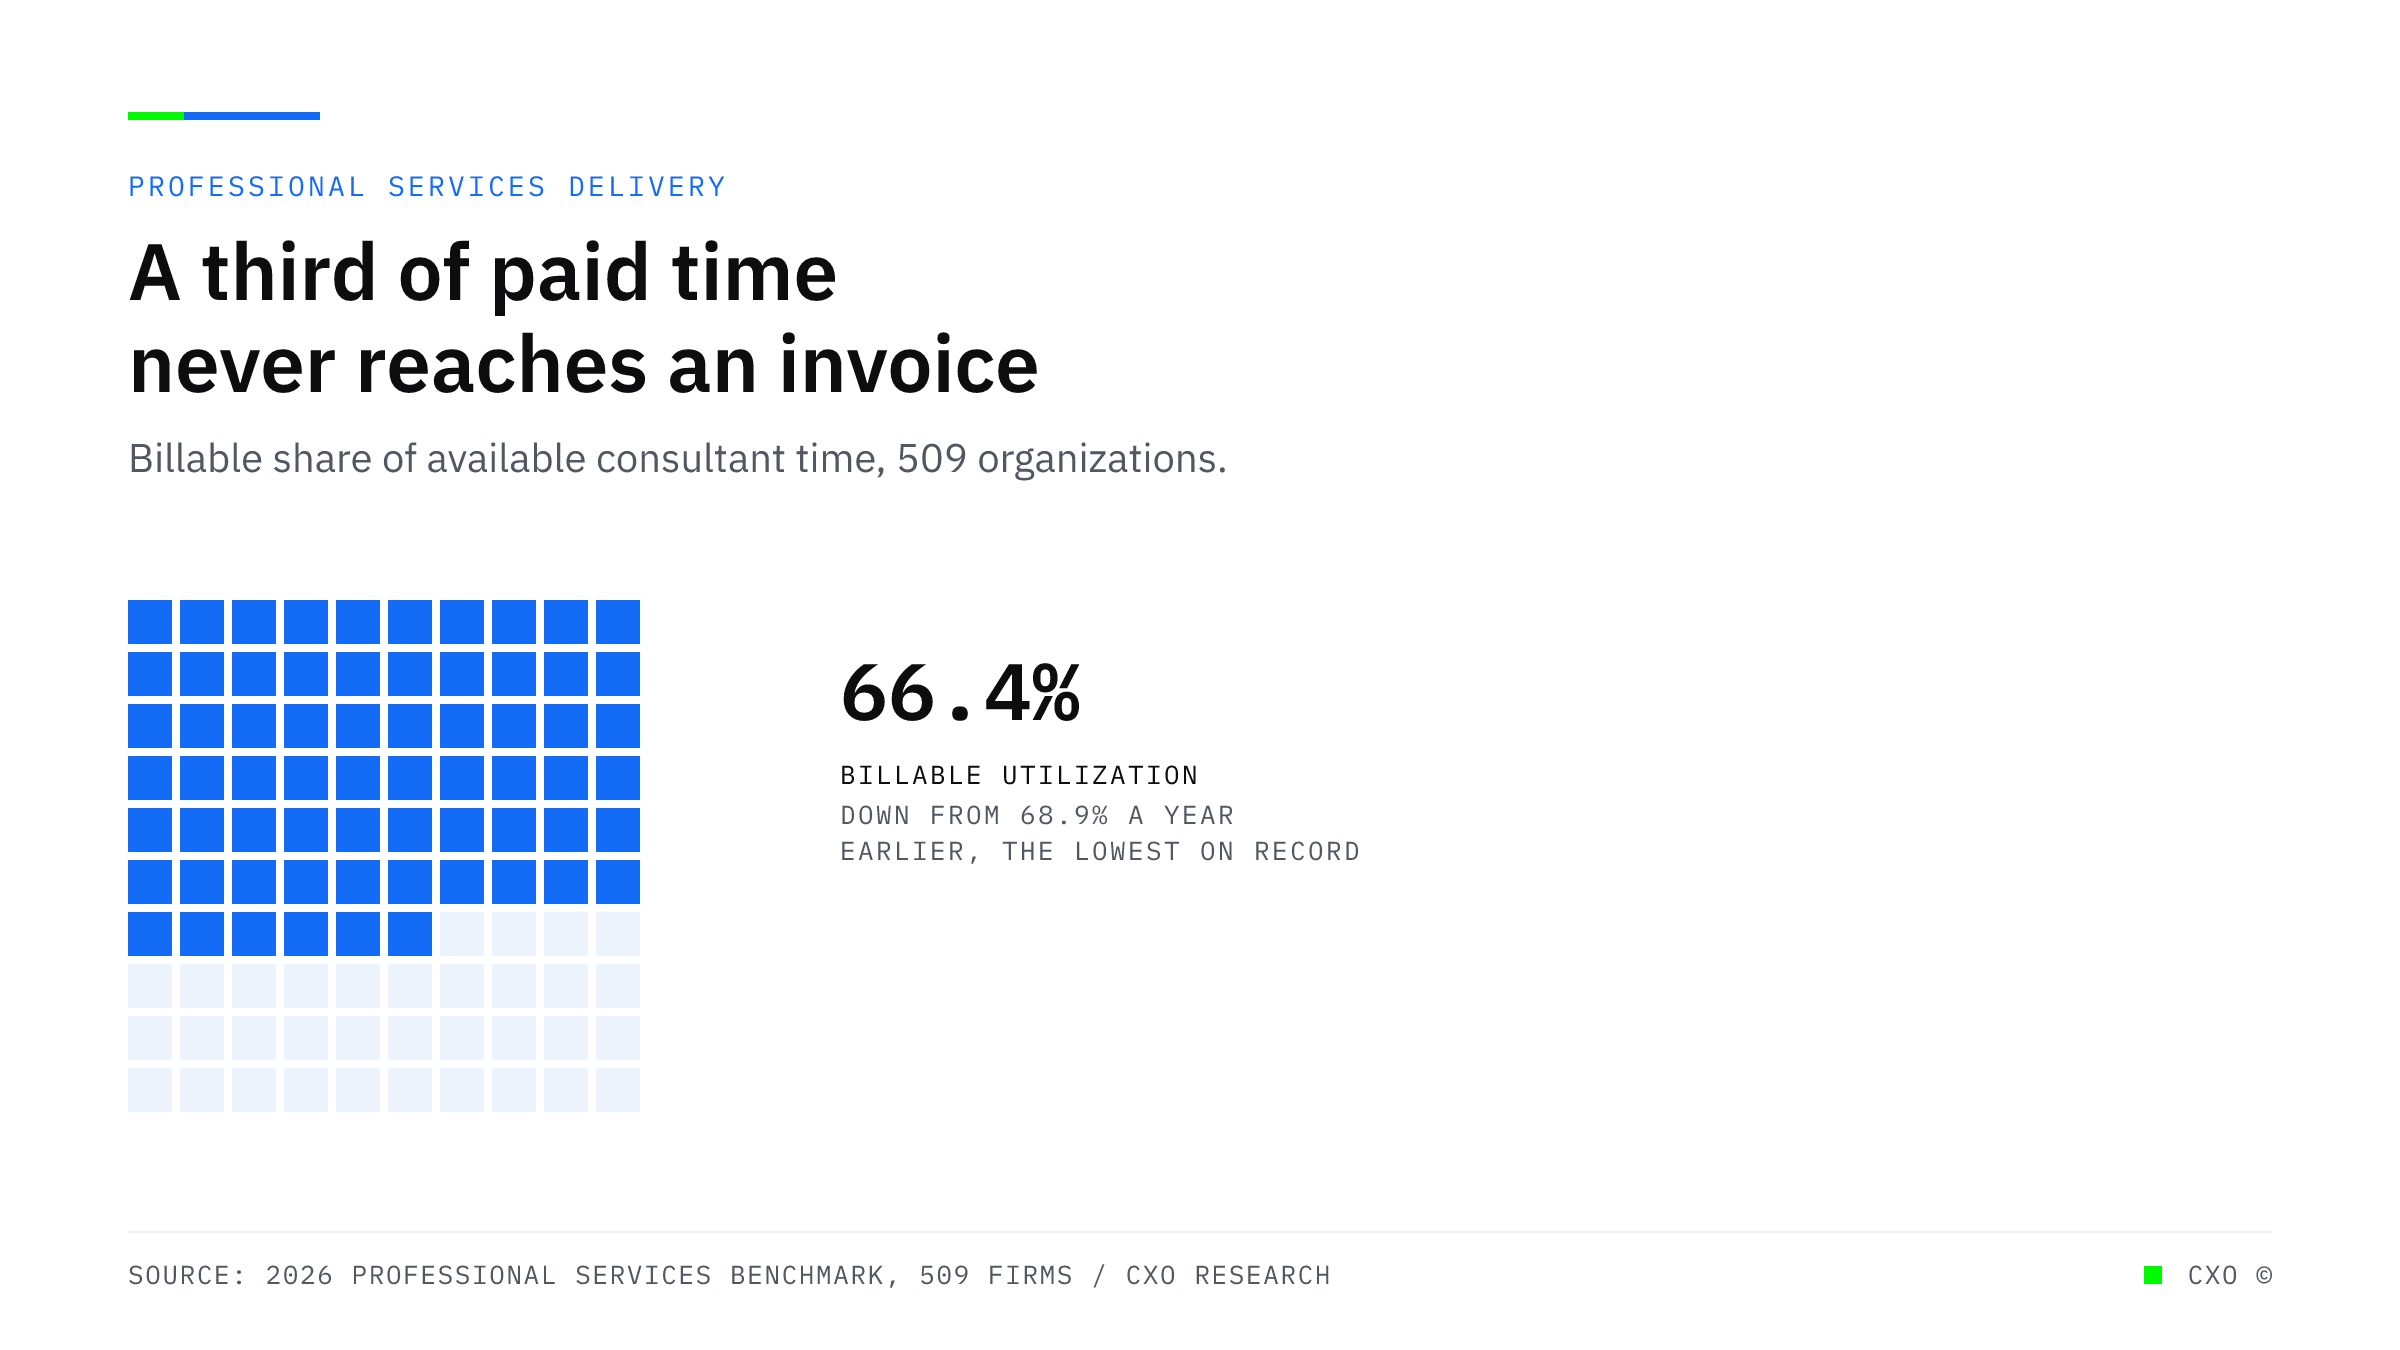
A grid of 100 squares with 66 filled in blue, showing that 66.4 percent of available consultant time is billable across 509 professional services organizations, the lowest level recorded.

Billable Utilization Hit a Record Low in the Same Year AI Use Rose Forty Percent

Across 509 professional services organizations, billable utilization fell to 66.4 percent, the lowest on record, while revenue growth improved and generative AI reached 27.1 percent of projects.
View Insight
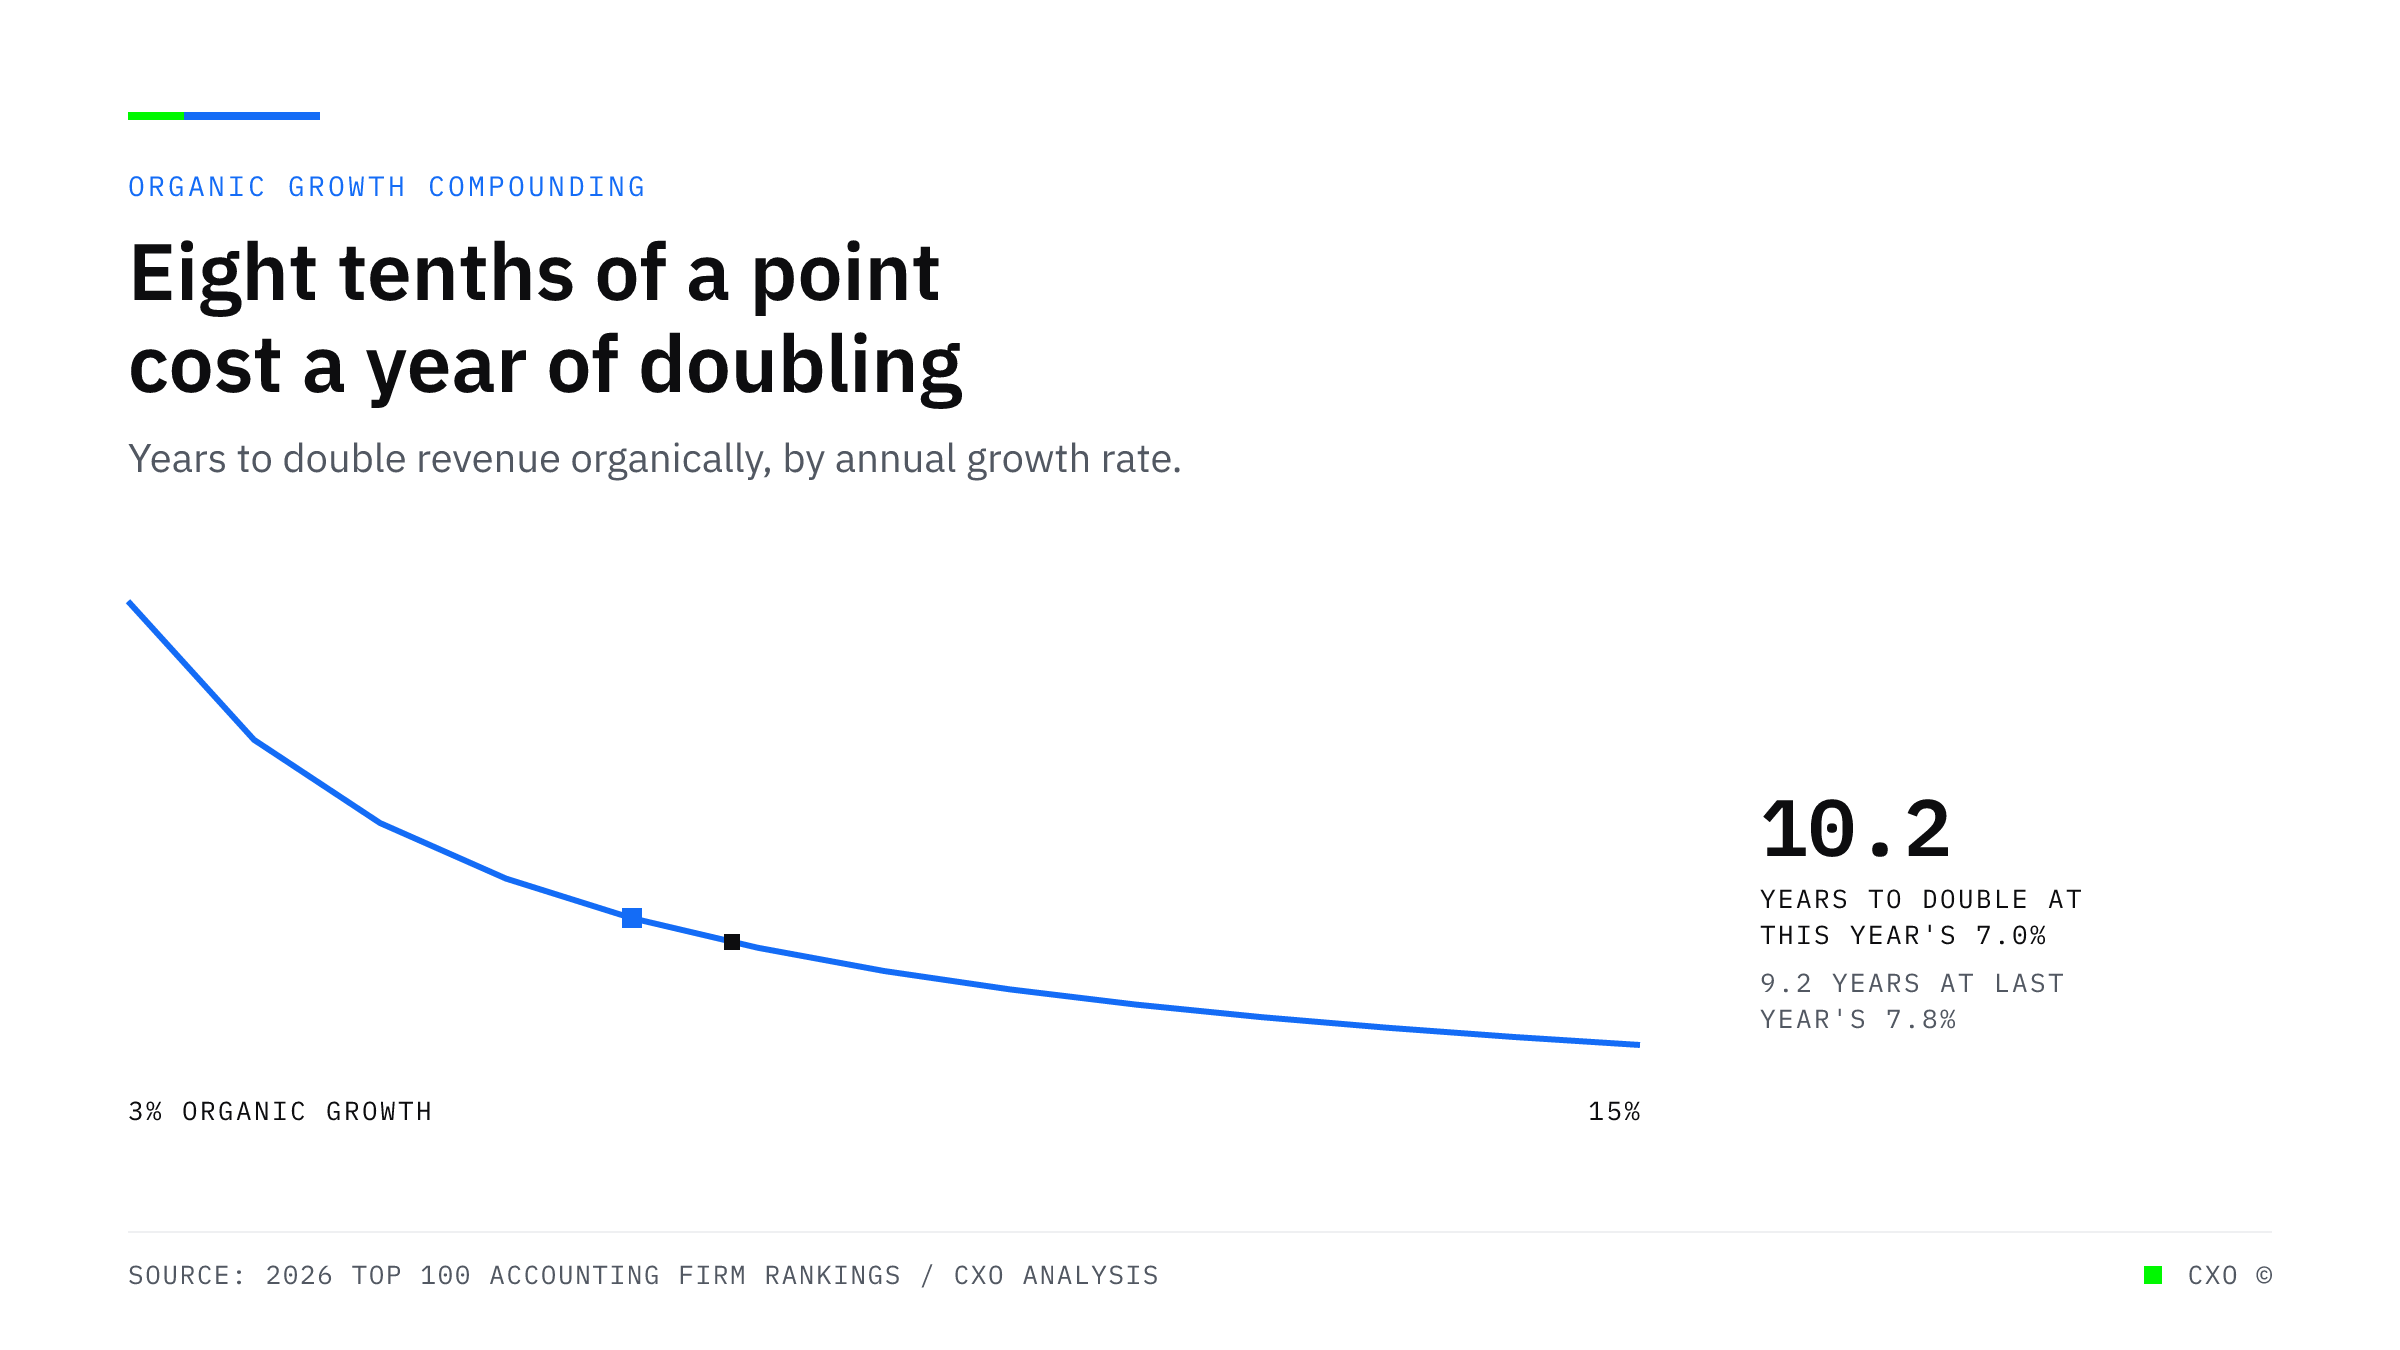
A rising curve showing how long it takes to double revenue at a given organic growth rate, marked at 7.0 percent where doubling takes 10.2 years, against 9.2 years at last year's 7.8 percent.

Top-100 Growth Rose to 12.8 Percent While Organic Growth Fell to 7

Total revenue growth at the top 100 accounting firms rose from 10.4 to 12.8 percent. Organic growth fell from 7.8 to 7.0. The entire acceleration was bought, and the benchmark moved with it.
View Insight
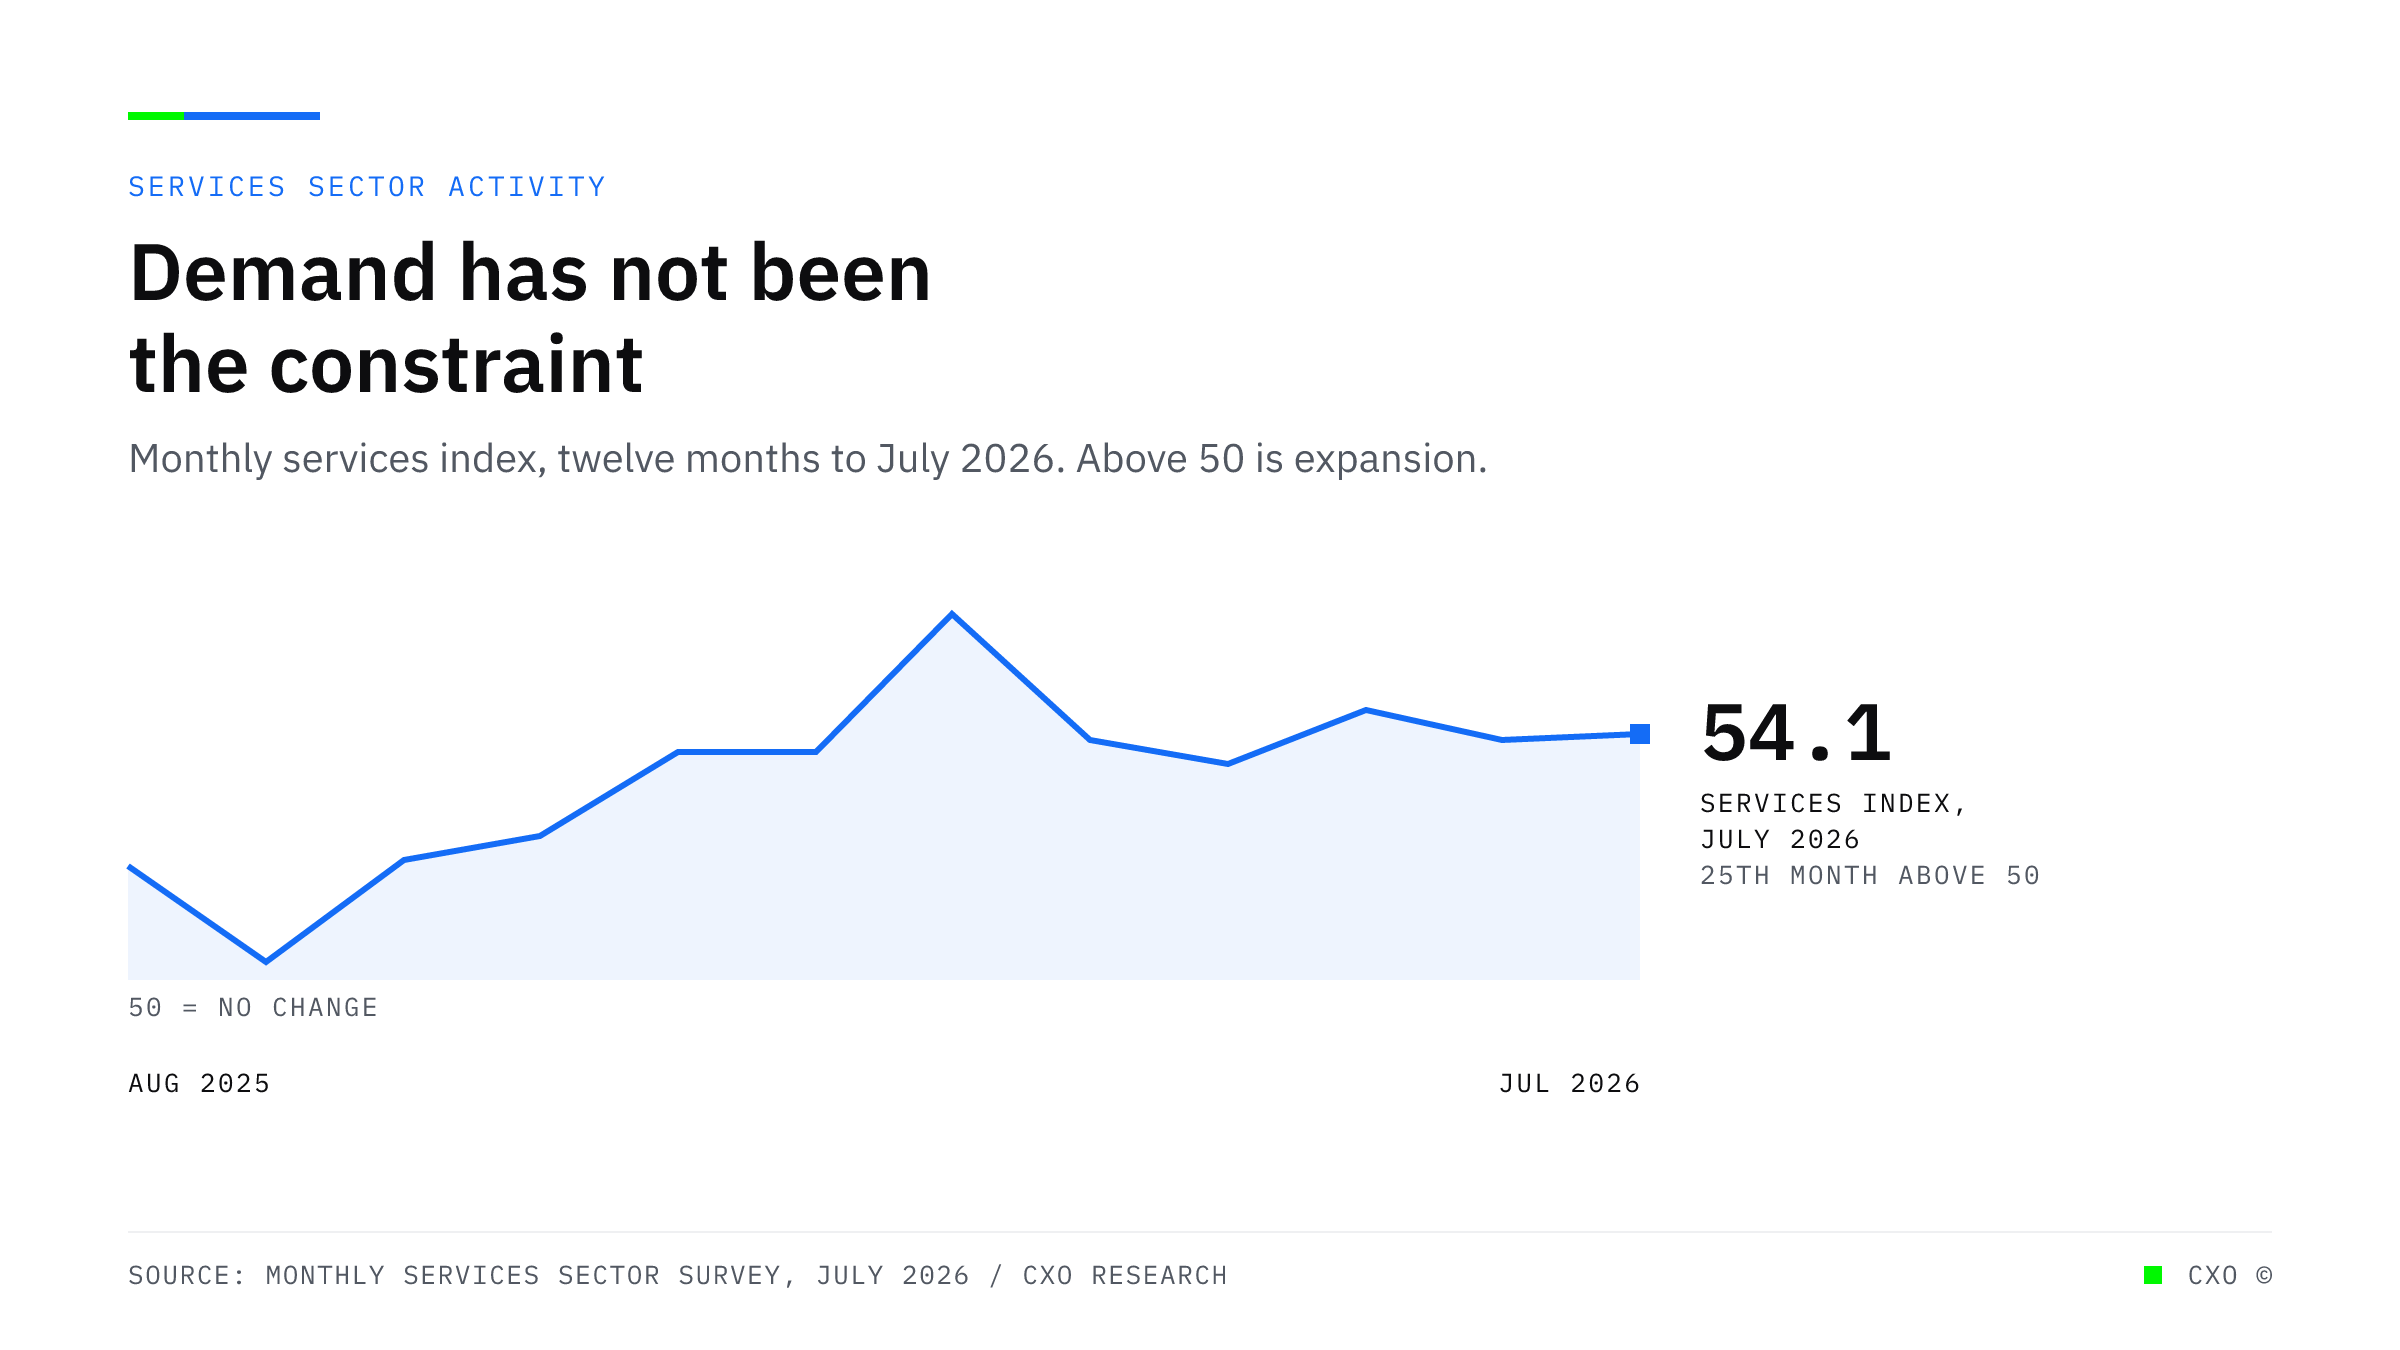
A line chart of the monthly services index across the twelve months to July 2026, holding above the 50 no-change line throughout and reading 54.1 in July, the twenty-fifth consecutive month of expansion.

Demand Has Not Been the Constraint for Twenty-Five Months. Delivery Capacity Has.

Services business activity jumped to 59.1 in July while the services employment index fell to 47.4. Demand keeps expanding and the payroll that delivers it keeps contracting.
View Insight
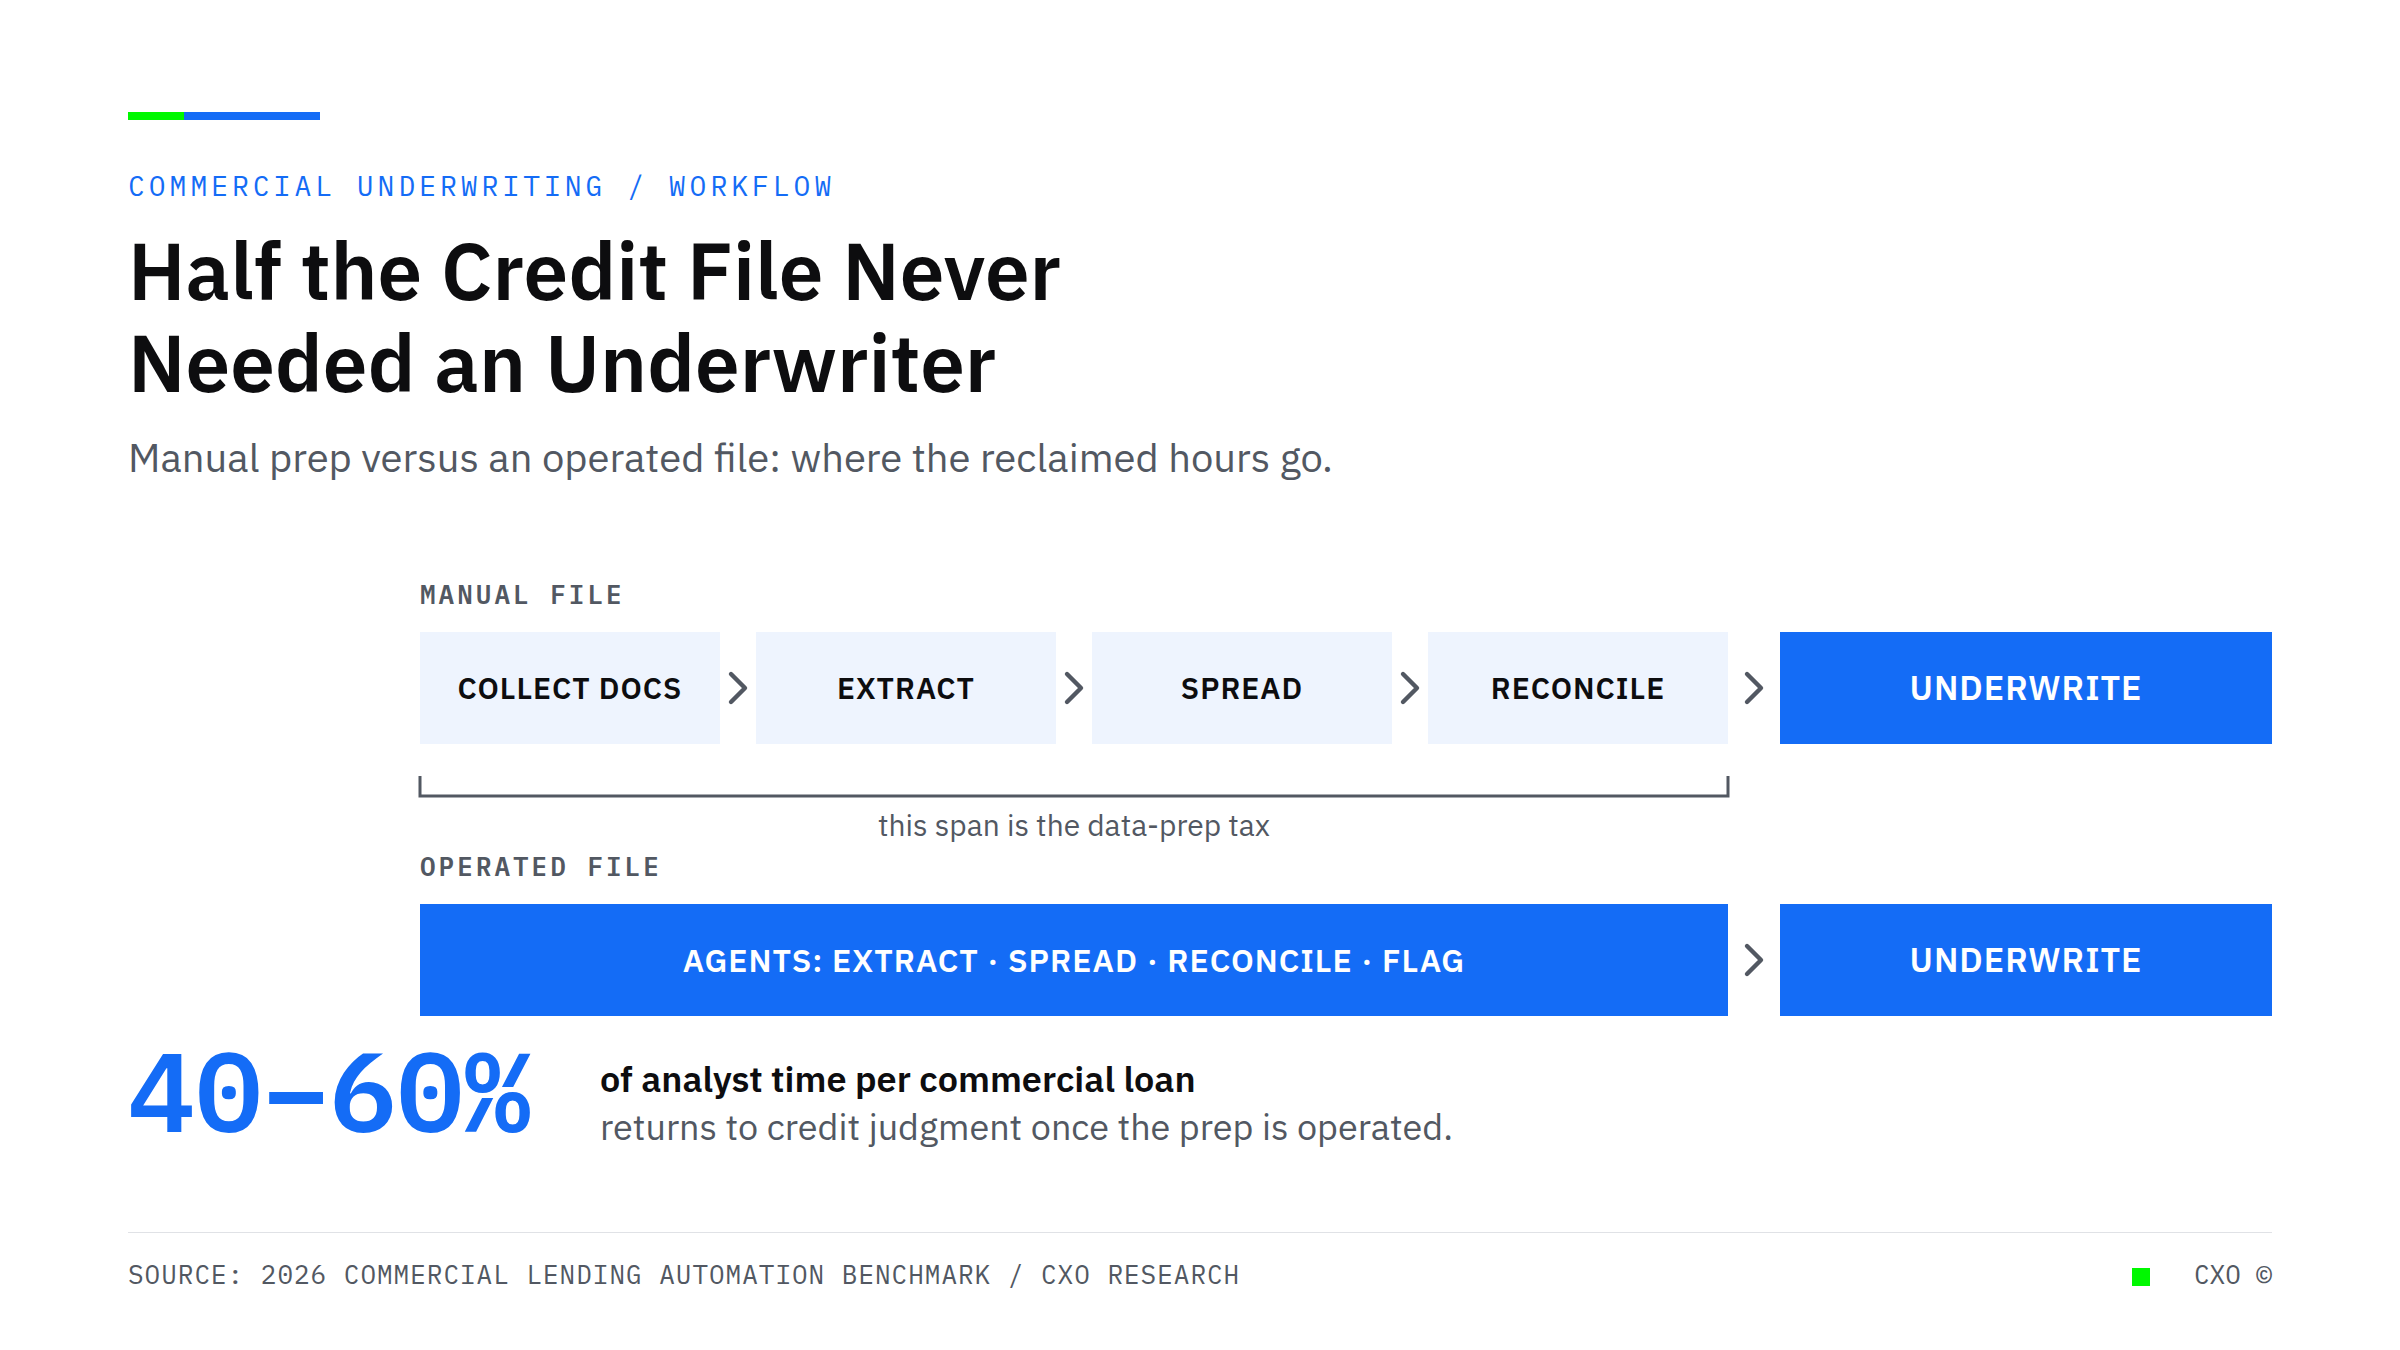
Anatomy of a commercial credit file comparing a manual file, which spends 40 to 60 percent of analyst time on document prep, with an operated file where agents handle extraction, spreading, and reconciliation before underwriting.

Your Best Underwriters Spend Half Their Day Not Underwriting

Automating financial spreading and reconciliation cuts analyst time per commercial loan by 40 to 60%. Why hiring another underwriter is the wrong fix for a backed-up pipeline, and what an operated credit file changes.
View Insight
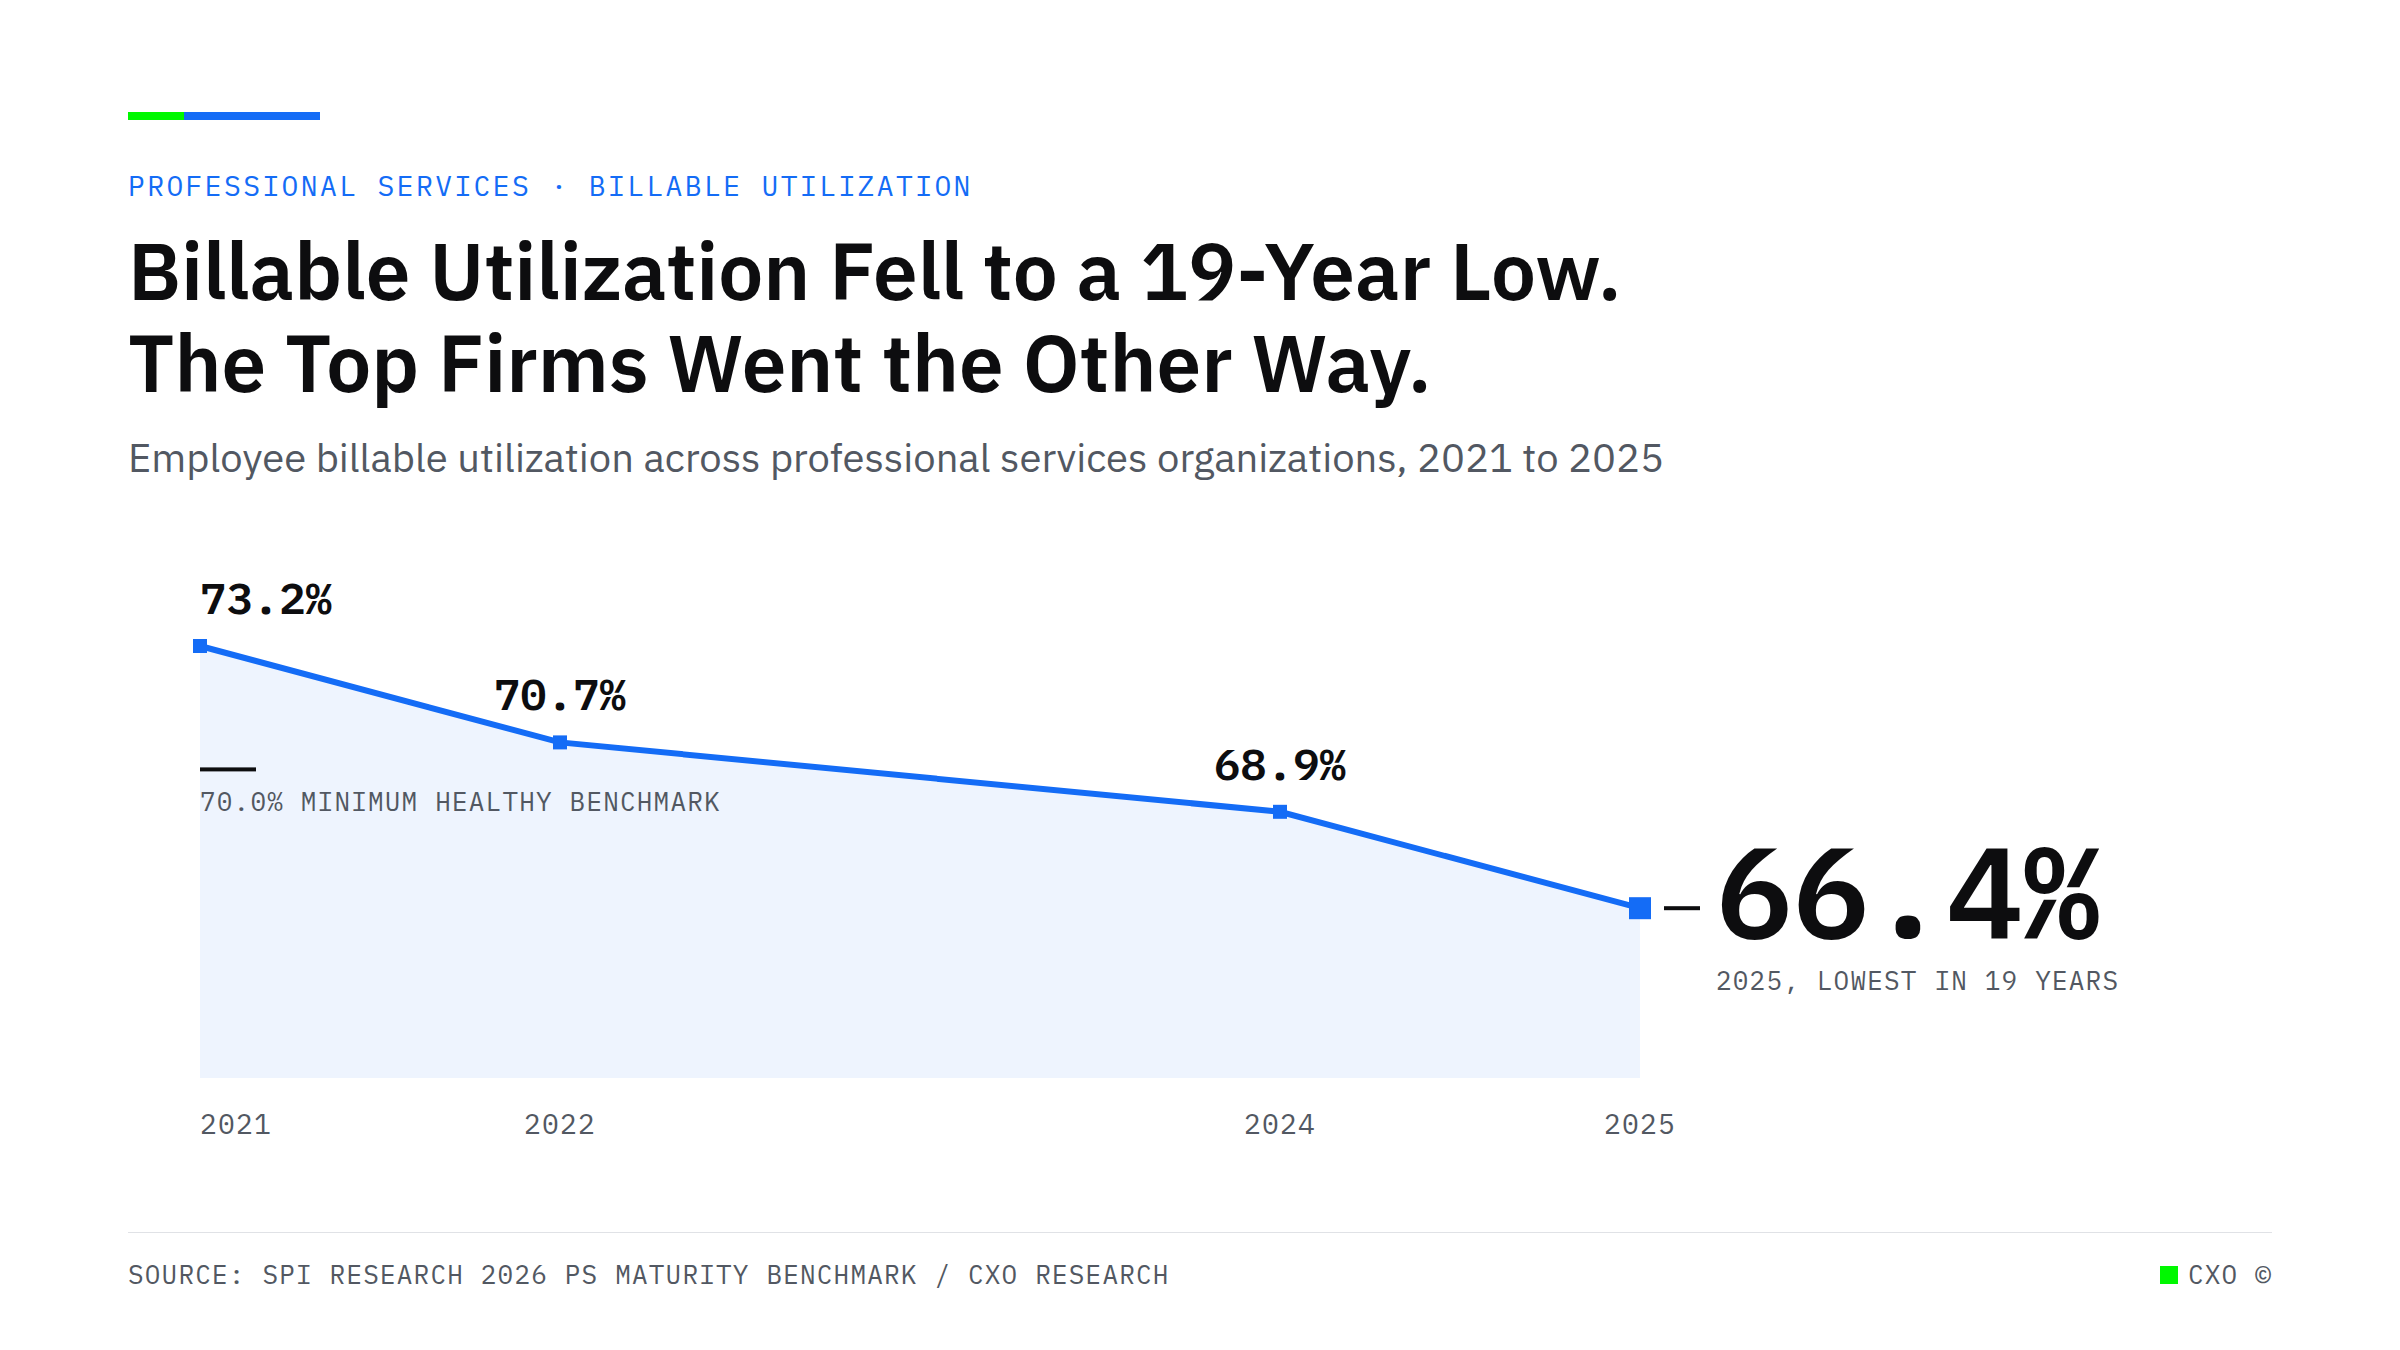
Line chart of employee billable utilization across professional services organizations falling from 73.2 percent in 2021 to 66.4 percent in 2025, below the 70 percent minimum healthy benchmark.

Billable Utilization Fell to a 19-Year Low. The Top Firms Went the Other Way.

Billable utilization fell to 66.4% in 2025, a 19-year low, in a year revenue and margins recovered. The gap between high performers and the rest is not software ownership. It is system integration.
View Insight
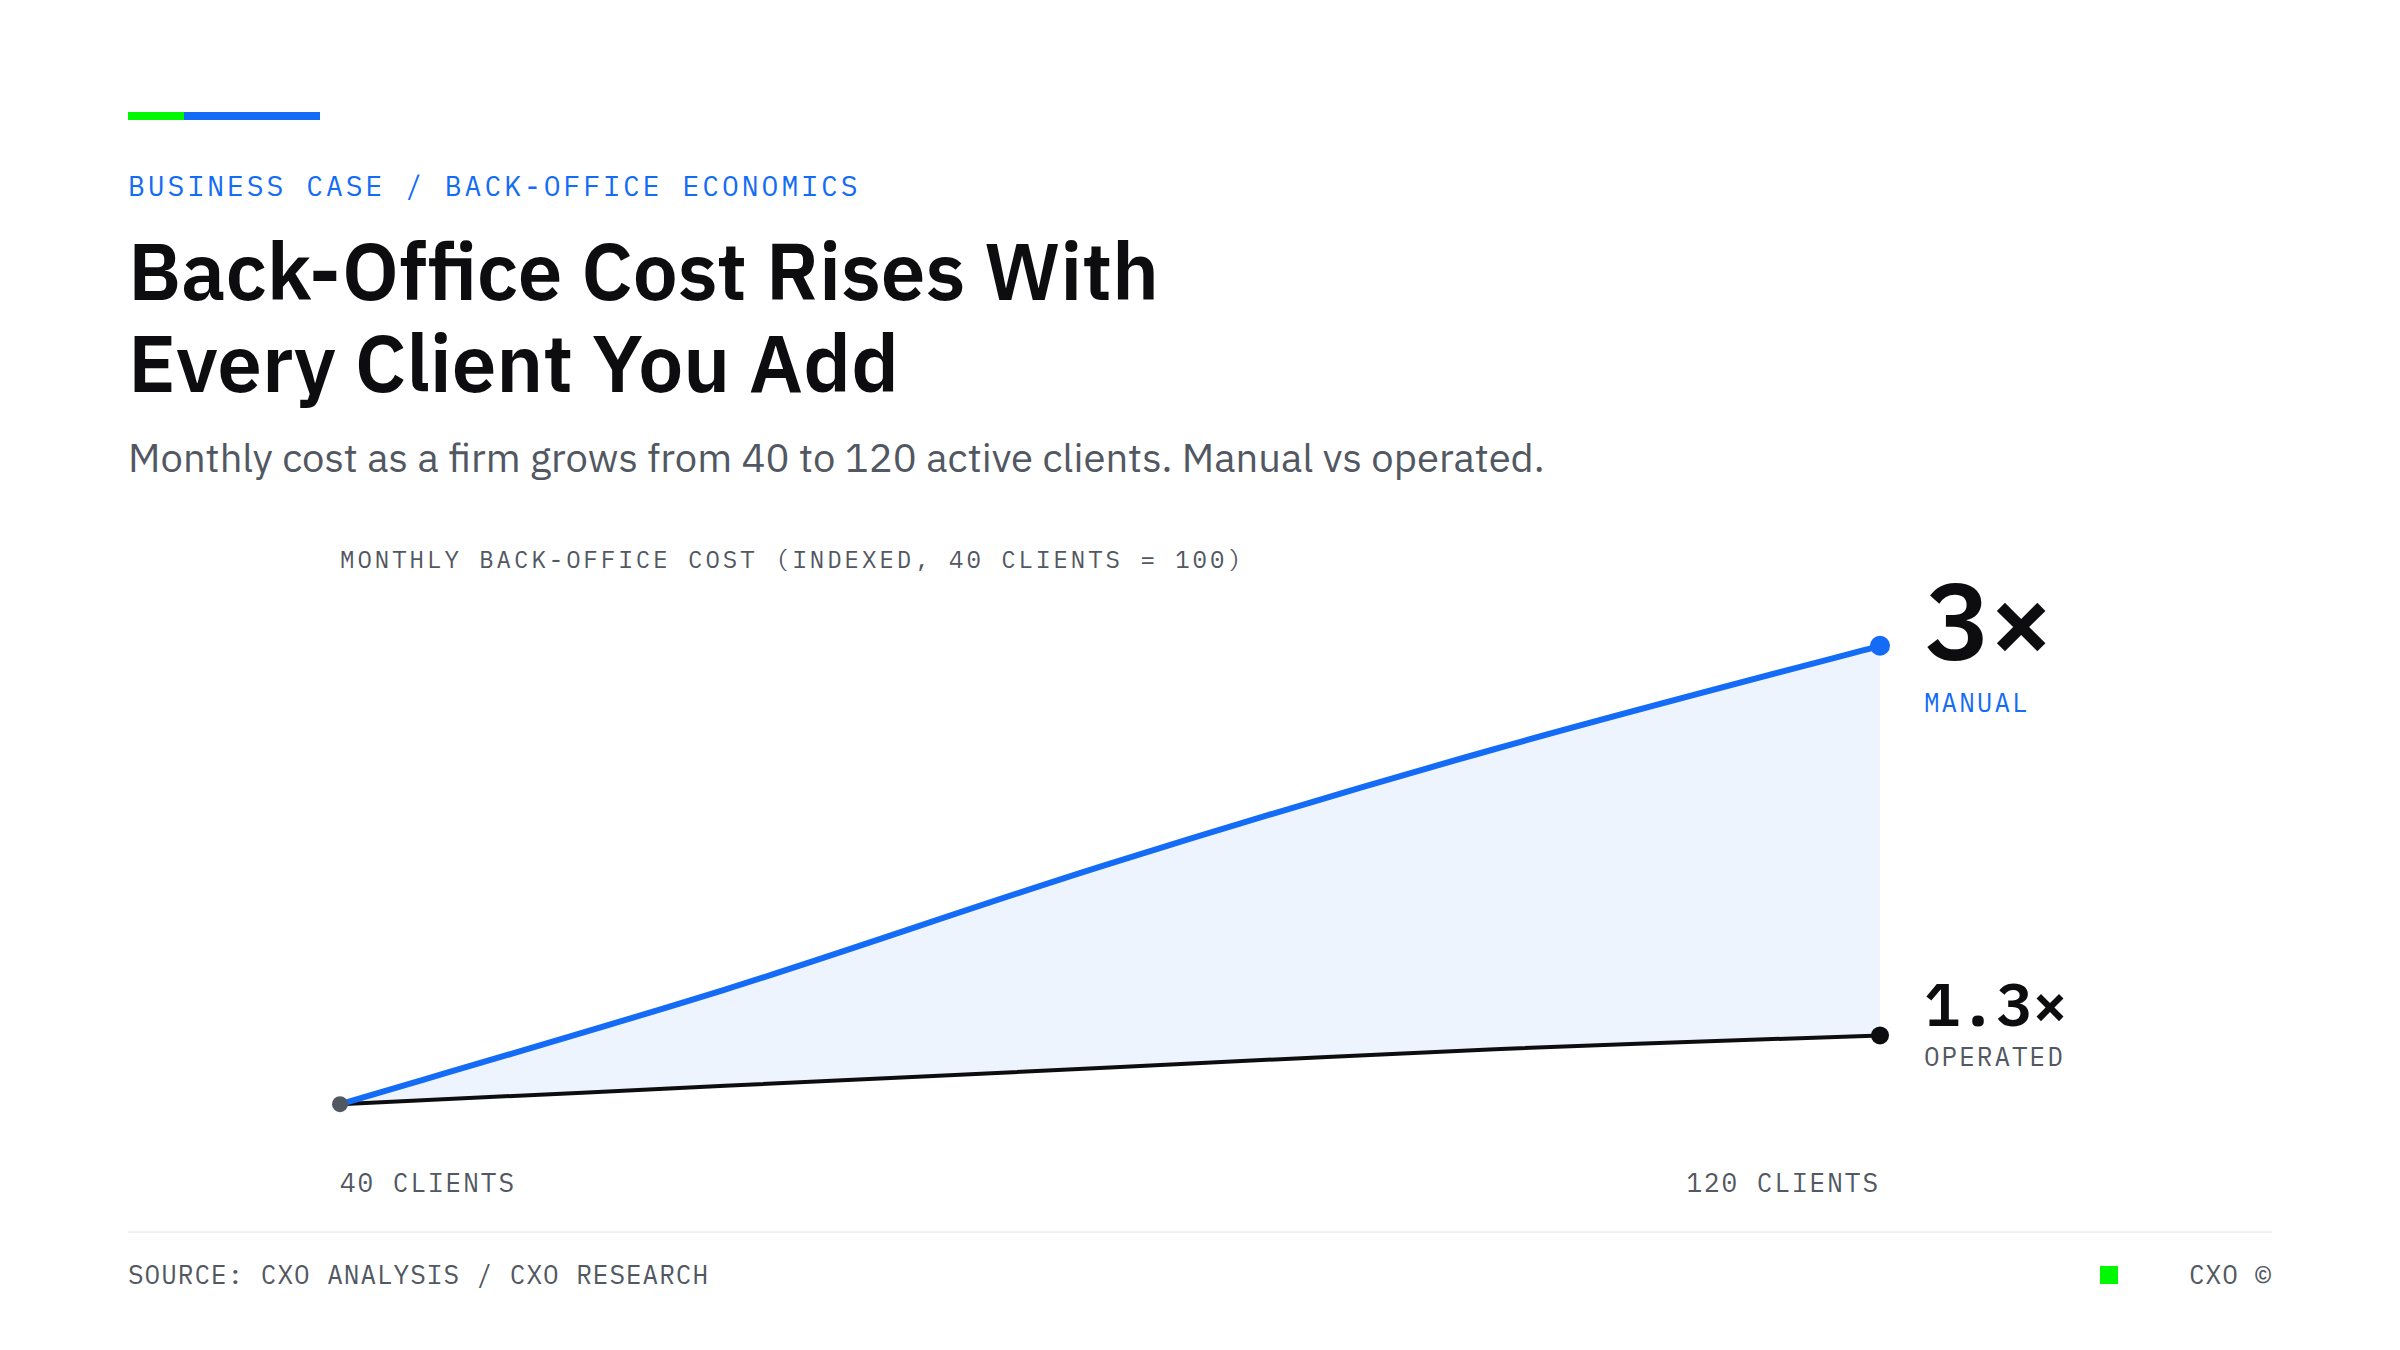
Line chart showing monthly back-office cost rising close to threefold as a professional services firm grows from 40 to 120 active clients under manual operations, while an operated system holds cost near flat.

Your Back-Office Cost Is Wired to Grow Every Time You Win a Client

Back-office cost in professional services scales with client count by design. Here is why hiring makes it permanent, and how operated back-office and AR automation break the link between growth and overhead.
View Insight
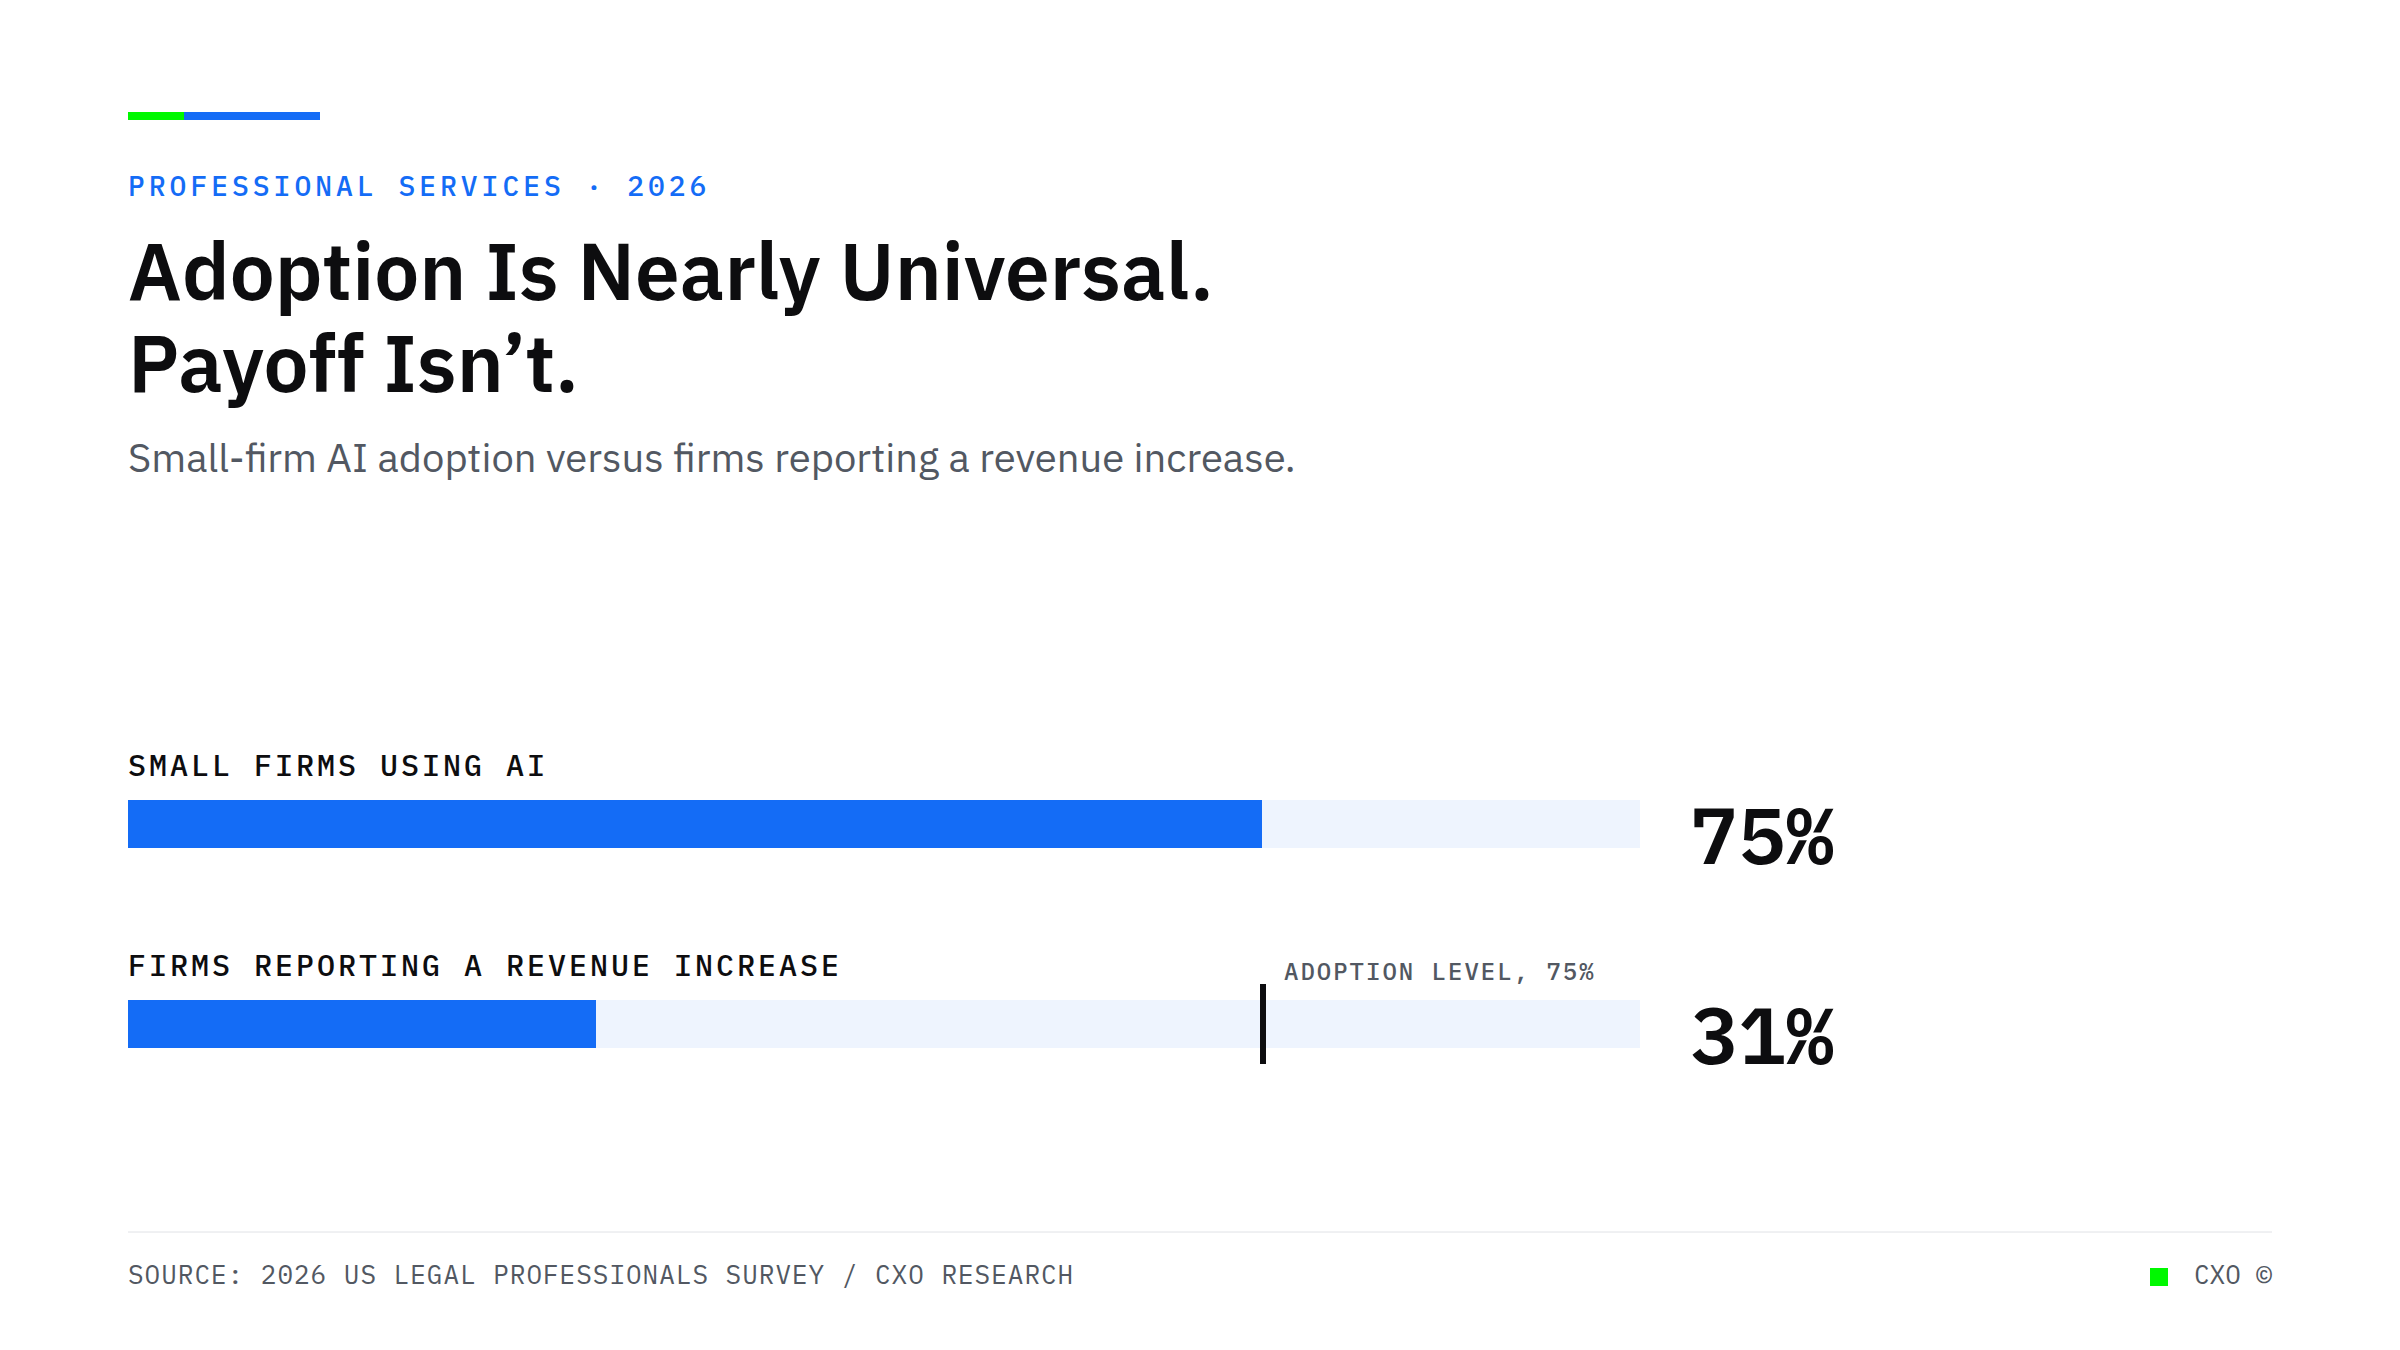
Bullet-bar chart showing 75% of small professional services firms use AI while only 31% report a revenue increase, illustrating the gap between adoption and payoff.

Adoption Is Not Transformation. Most Professional Services Firms Bought the First and Skipped the Second.

Three-quarters of small professional services firms use AI. A third saw revenue move. The gap is not the tools, it is the unrebuilt operation the tools run inside.
View Insight
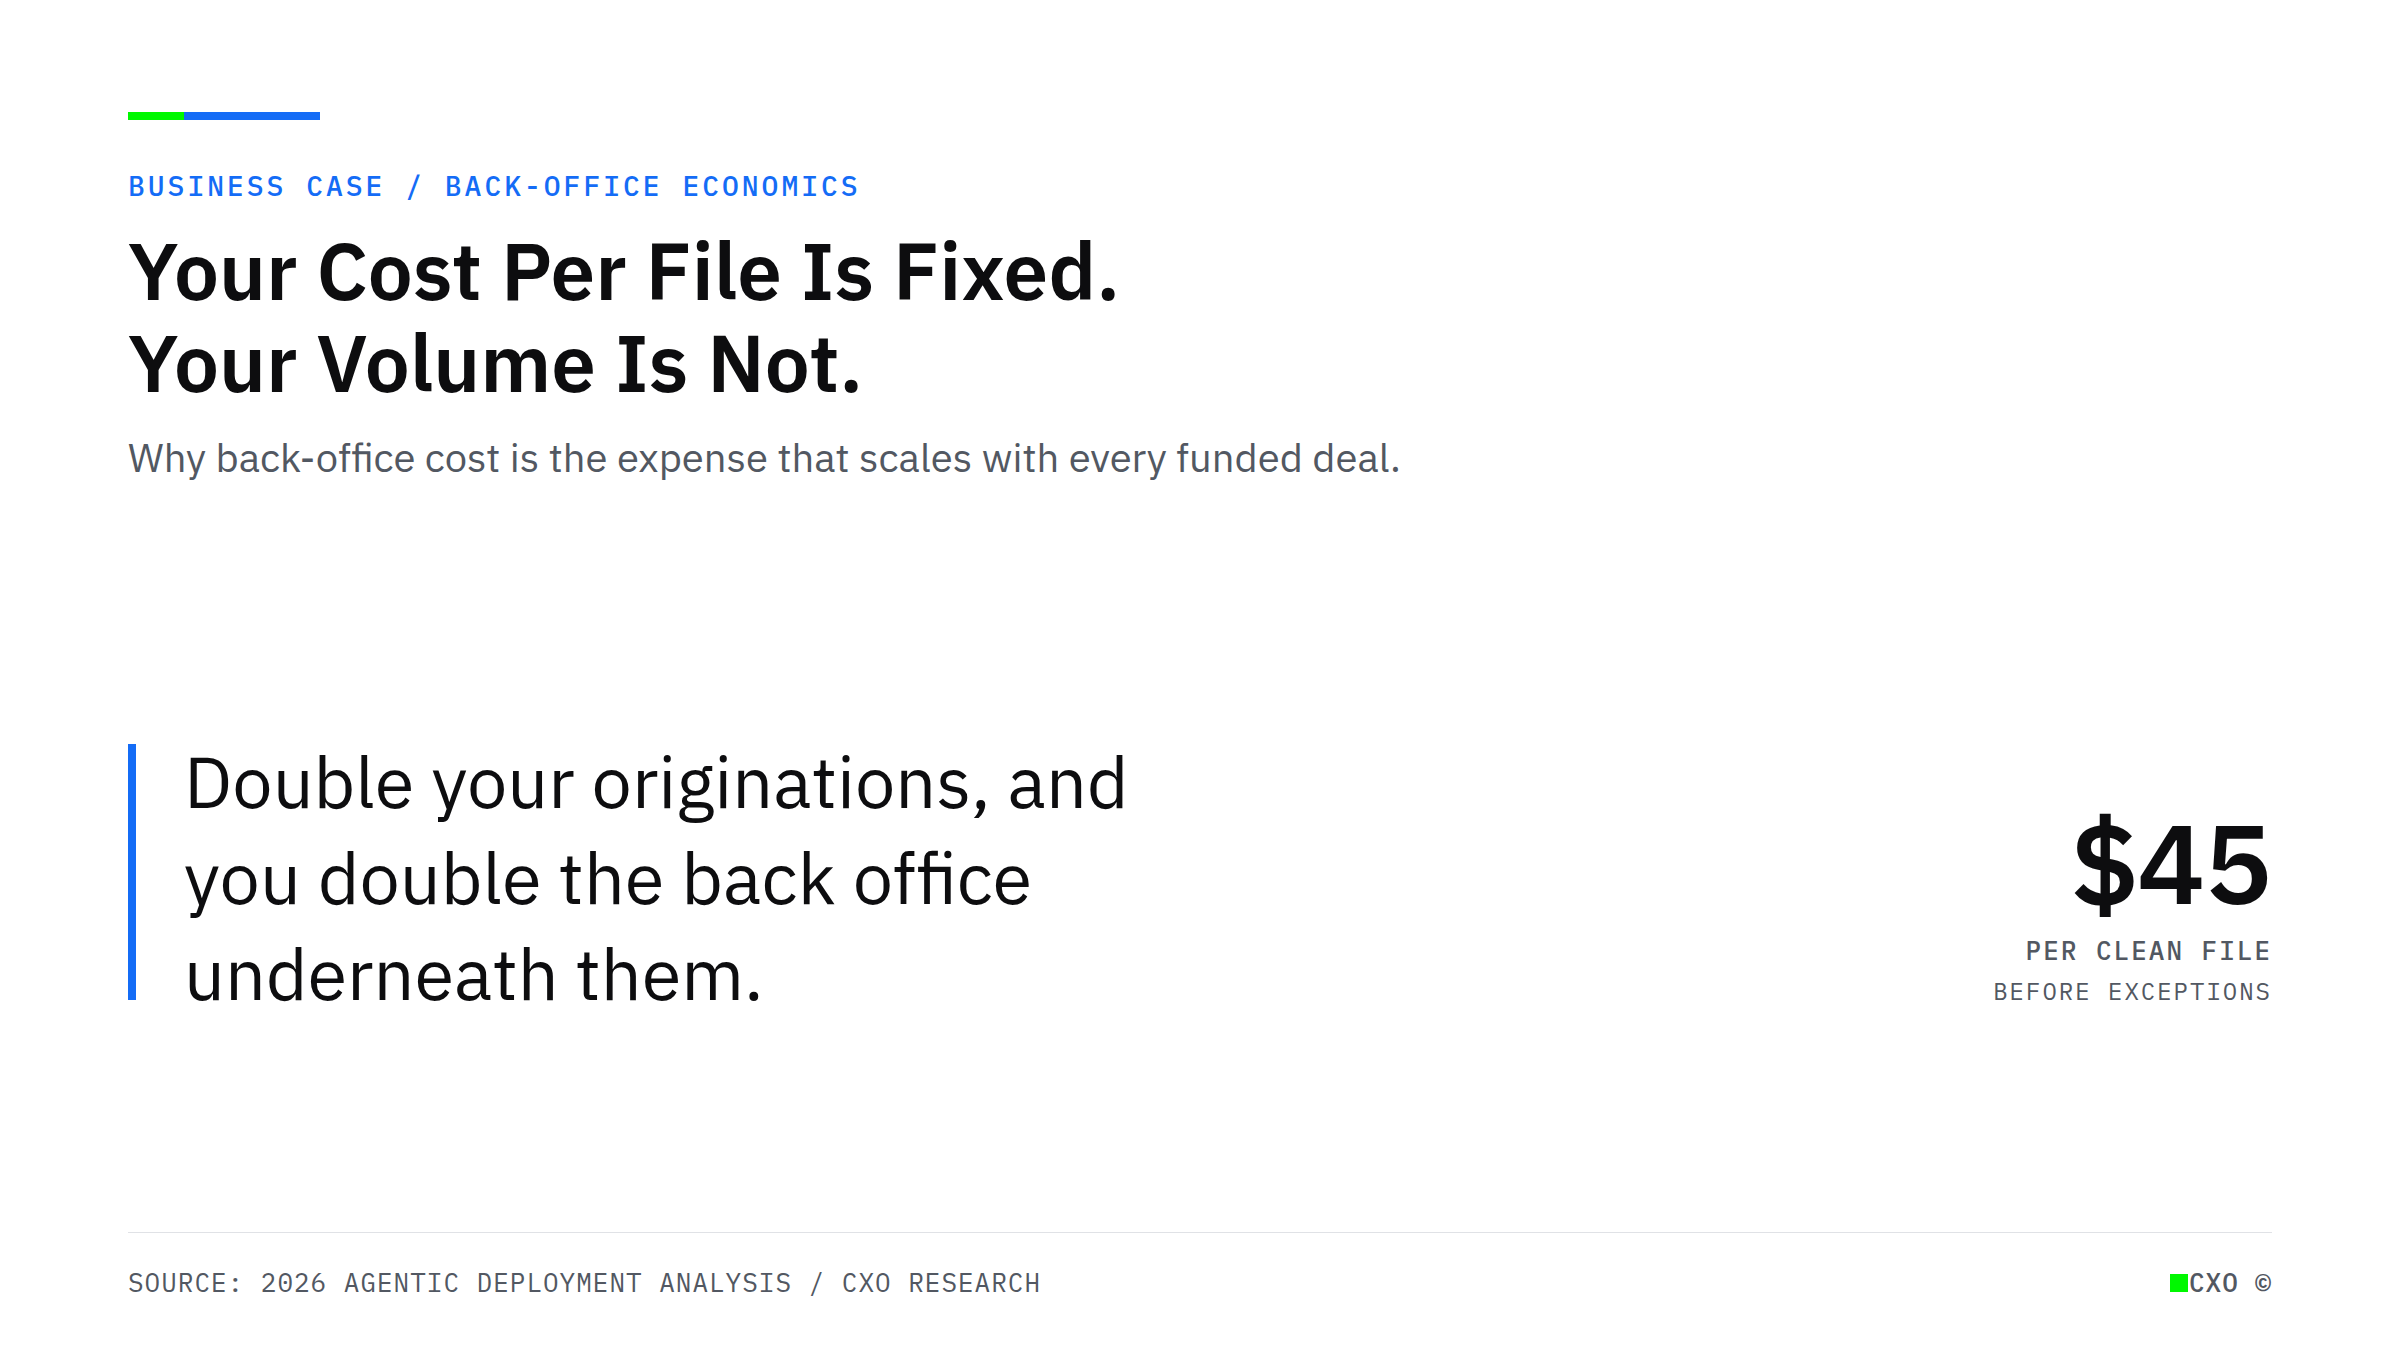
Editorial pull-quote cover reading "Double your originations, and you double the back office underneath them," annotated with roughly $45 per clean file before exceptions

Your Cost Per File Is Fixed. Your Volume Is Not. That Is Where Growth Gets Expensive.

Back-office cost is the one expense that scales in lockstep with loan volume. At roughly $45 a clean file, growth quietly doubles it. Here is how alternative lenders break the link between volume and headcount.
View Insight
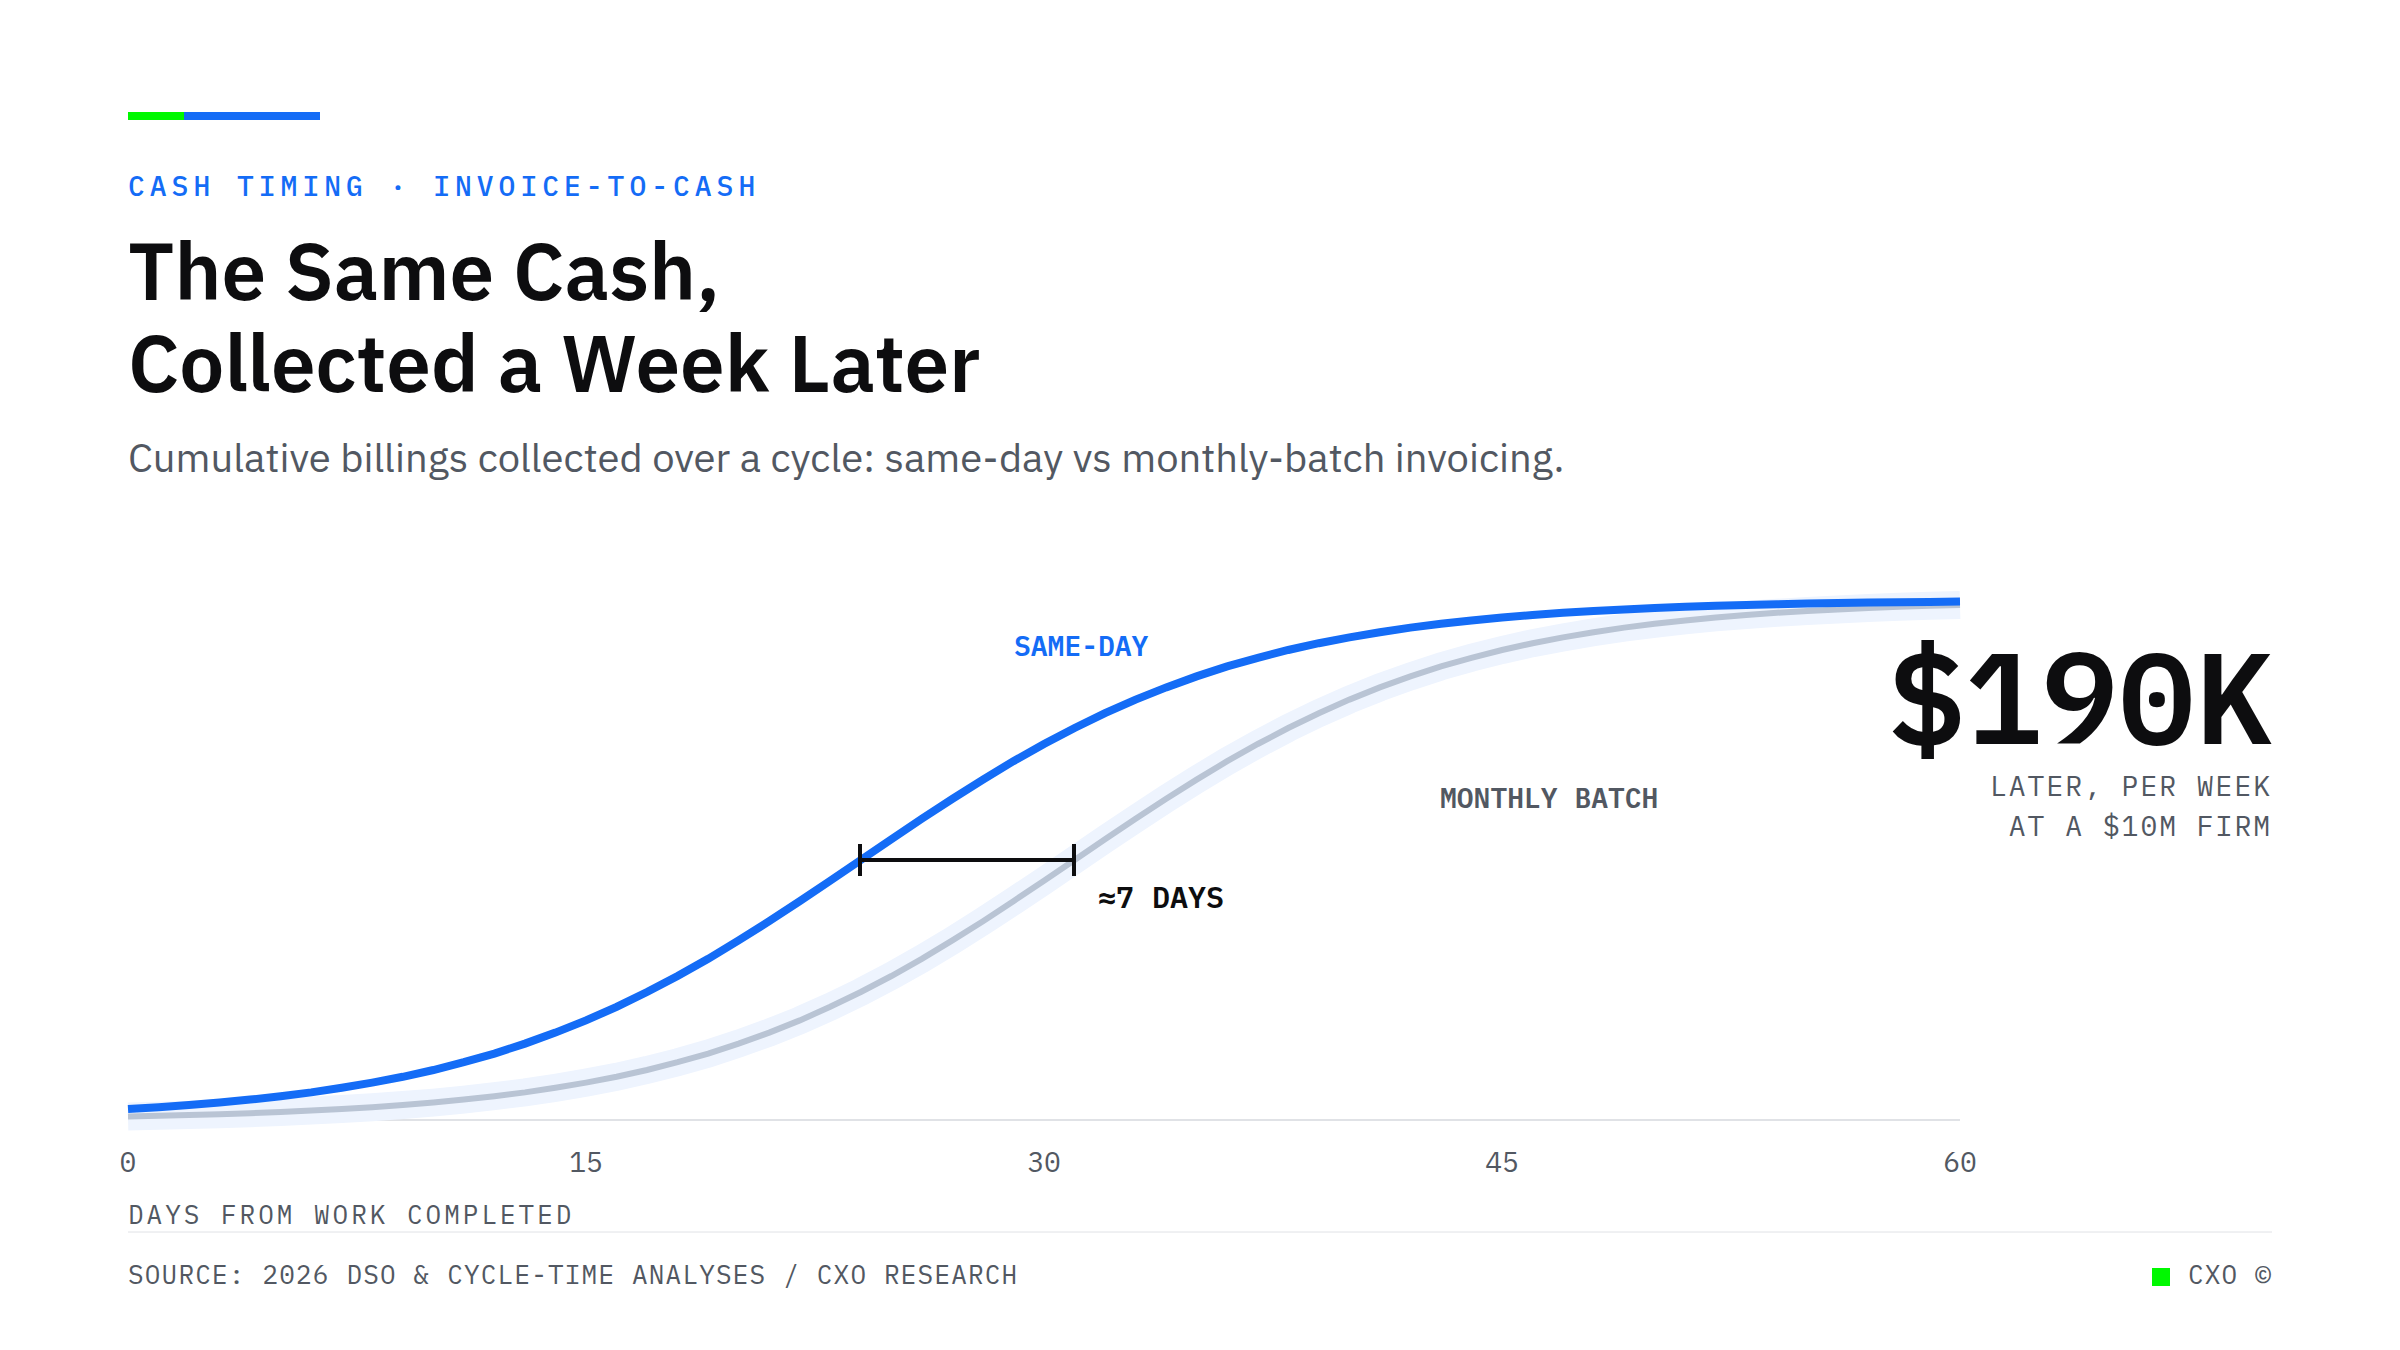
Line chart titled The Same Cash, Collected a Week Later, comparing cumulative billings collected under same-day versus monthly-batch invoicing over a 60-day cycle; the same-day curve leads the monthly-batch curve by about 7 days, a timing gap worth roughly $190,000 of cash arriving later per week at a $10M firm.

Most Collection Delay Happens Before You Send a Single Invoice

Your DSO clock starts when work is earned, not when you invoice. Batch billing builds a week of lost cash into every cycle. Where the leak really sits, and how to close it.
View Insight
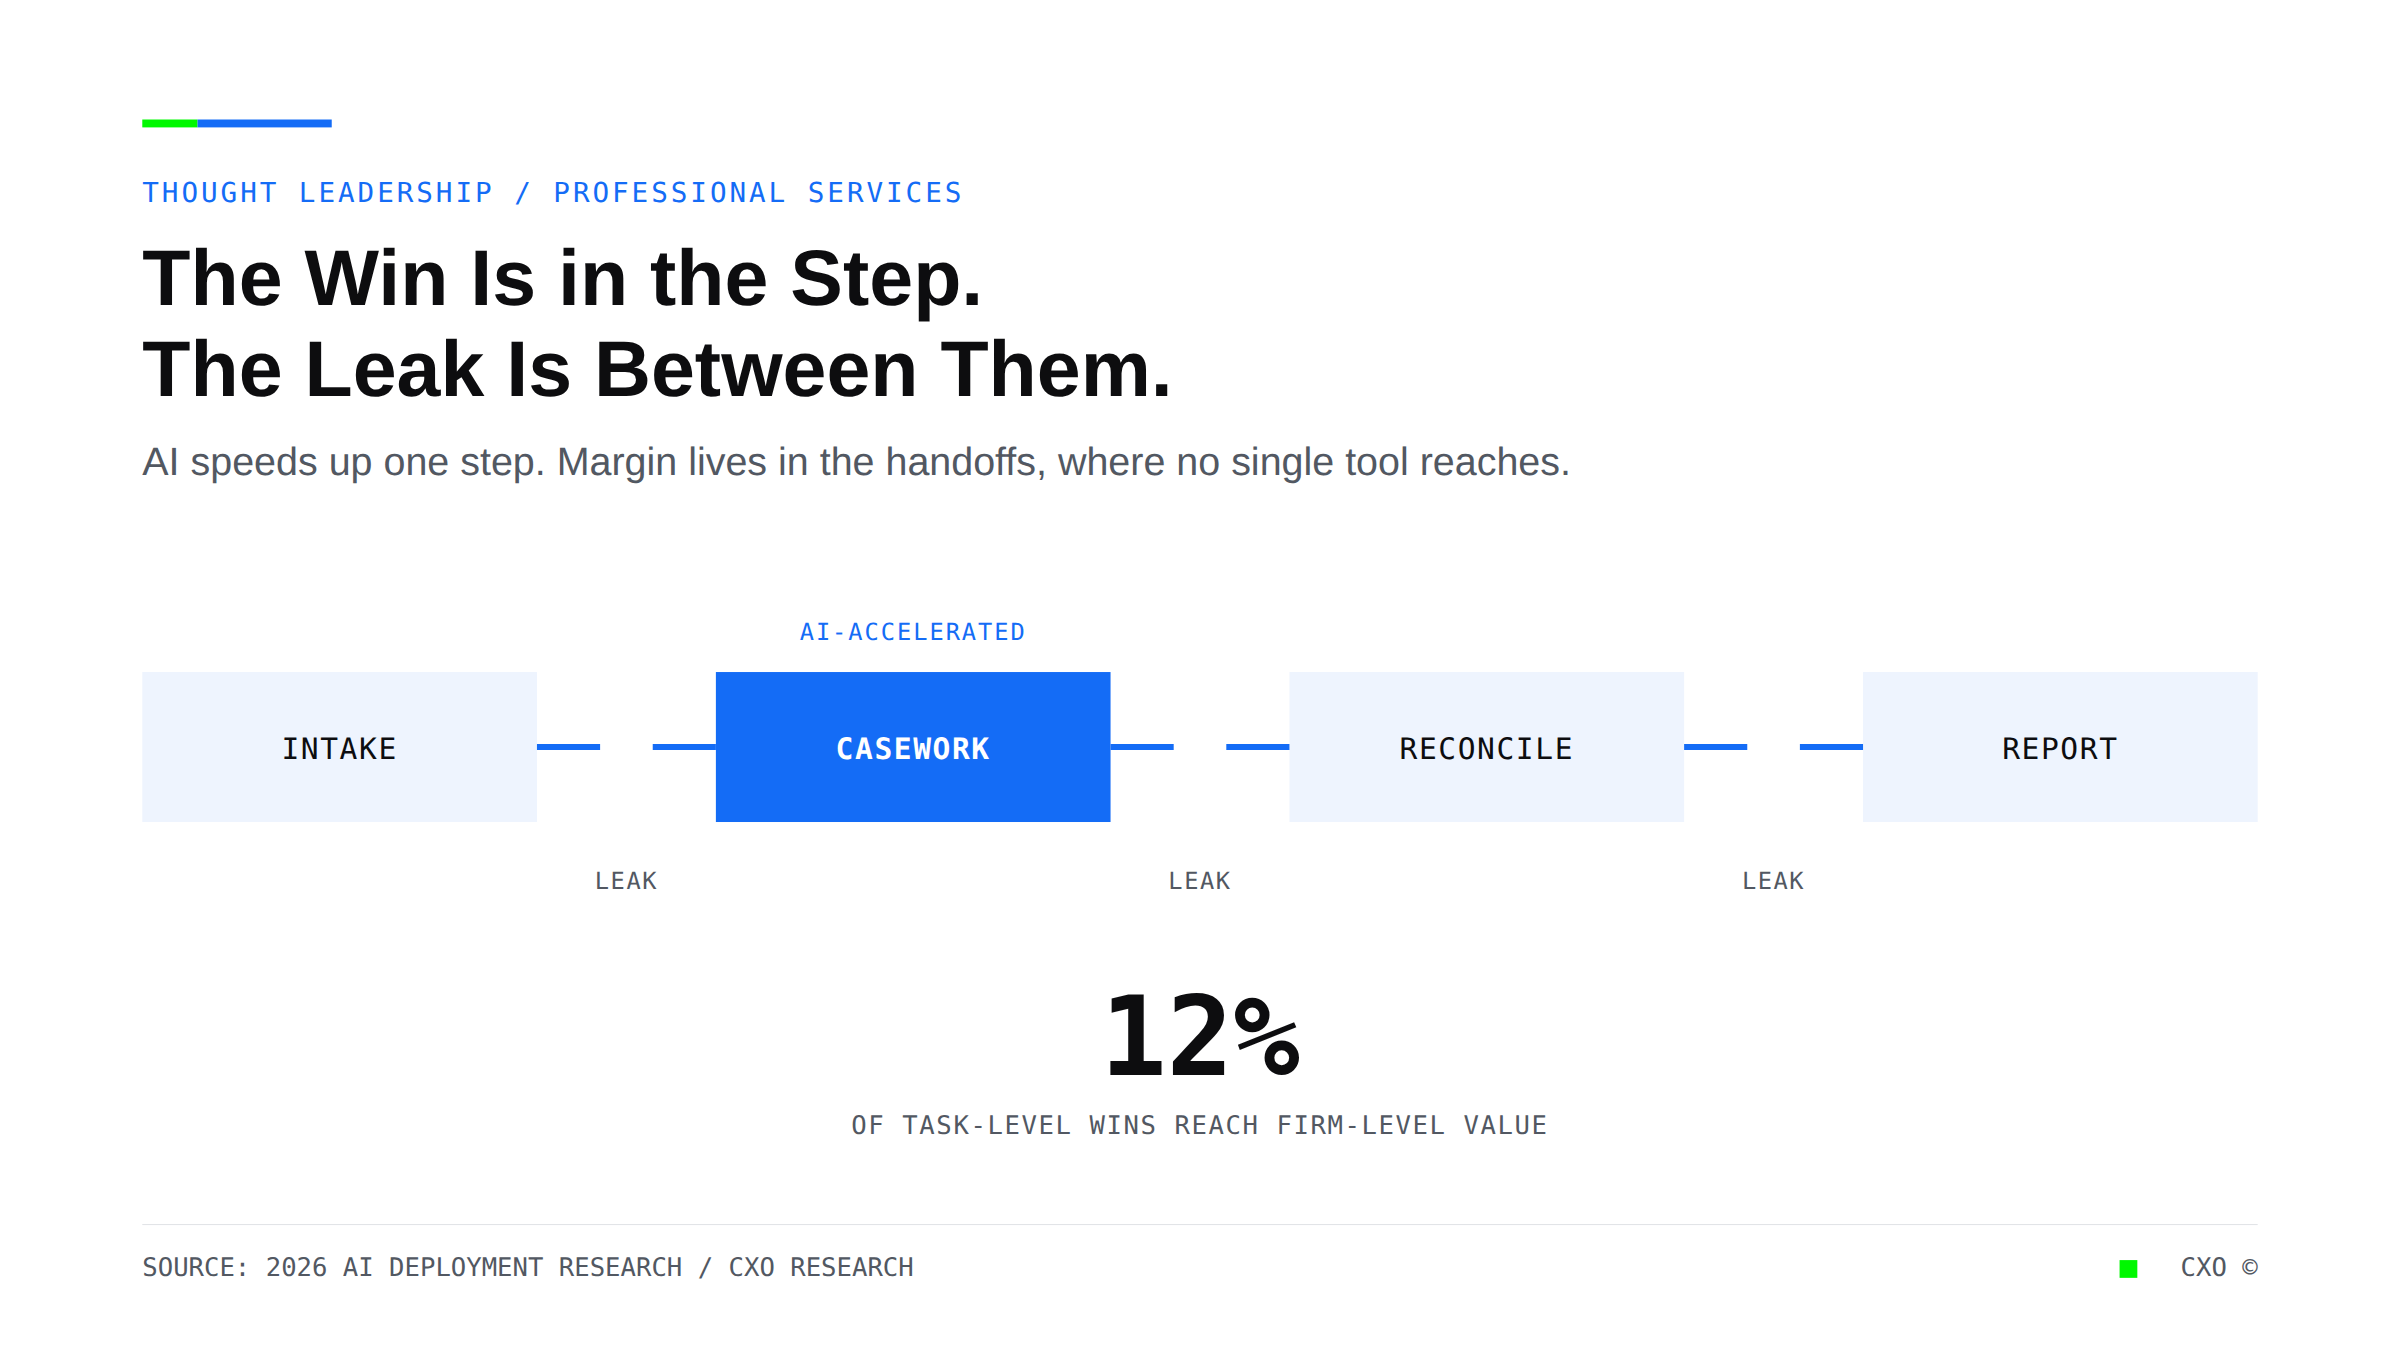
Workflow diagram of four process steps, intake, casework, reconciliation, and reporting, with AI accelerating the casework step while time leaks at each handoff between steps, and only 12 percent of task-level wins reaching firm-level value.

Every Professional in Your Firm Saves Hours With AI. Your Margins Have Not Moved. Here Is Why.

Your people are faster with AI and your margins have not moved. The return on AI lands at the process level, not the person, and most firms only changed the person. Here is the gap, and how to close it.
View Insight
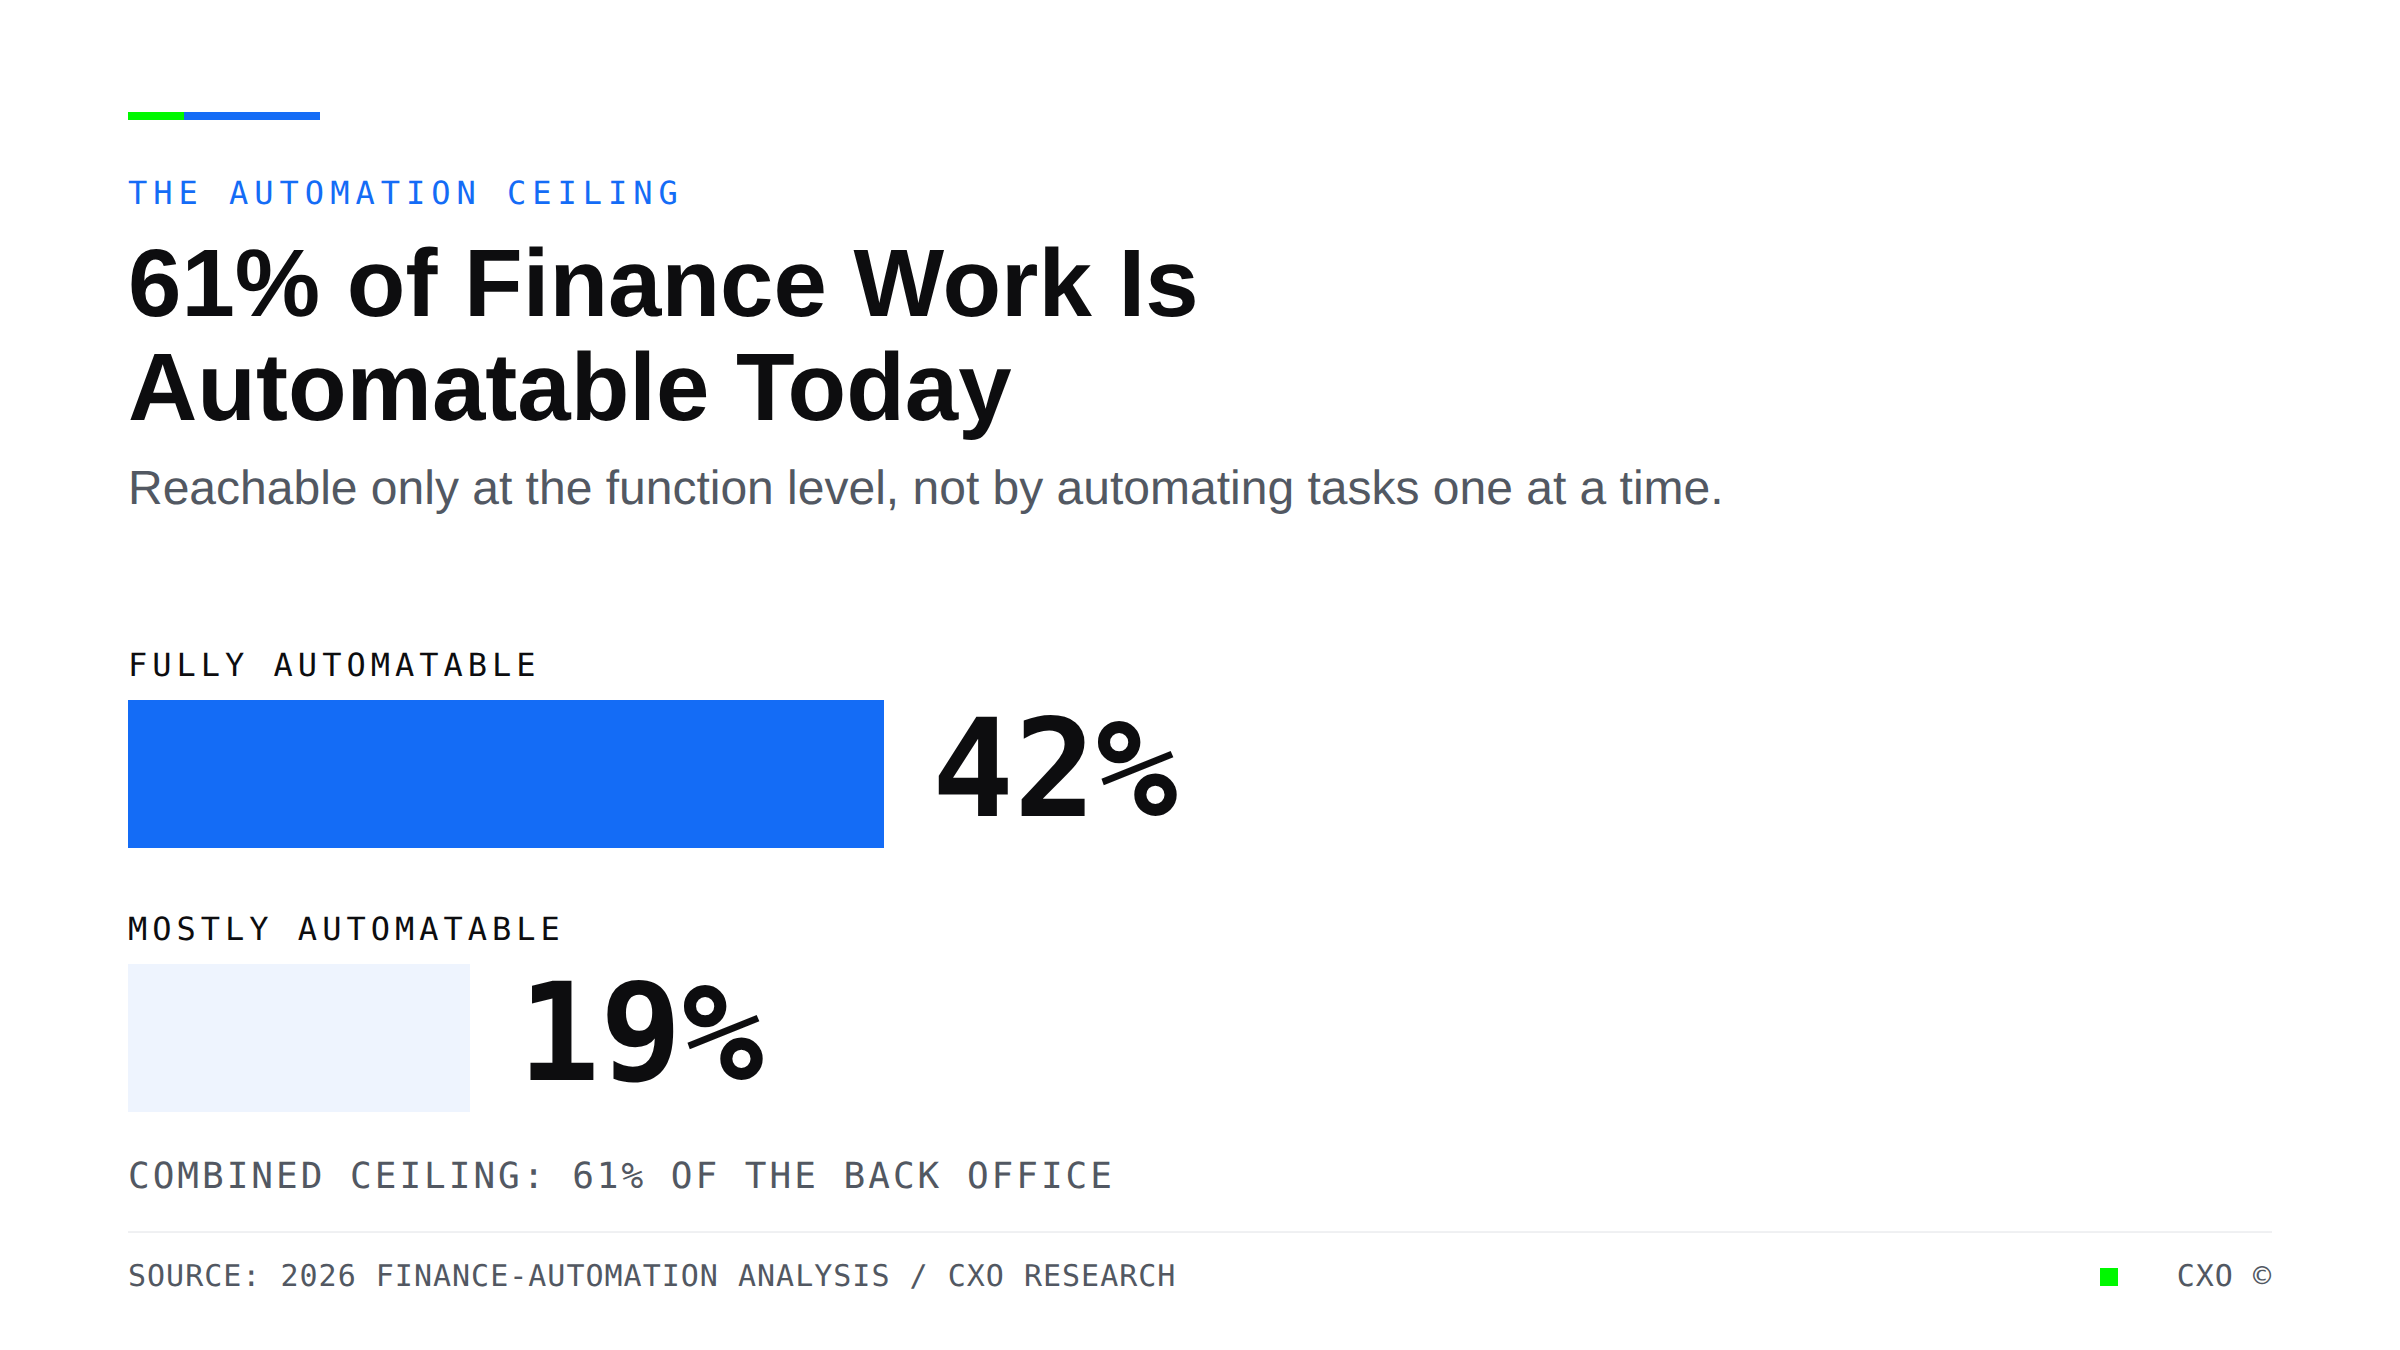
Grouped bar chart showing 42% of finance work is fully automatable and 19% is mostly automatable with current technology, a combined 61% ceiling reachable only at the function level.

Automating Tasks Is Not Automating a Function. Most Lenders Have Confused the Two.

Most lenders have automated tasks, not functions. The 2026 data shows why that gap keeps the cost in place, and what automating a full function actually requires.
View Insight
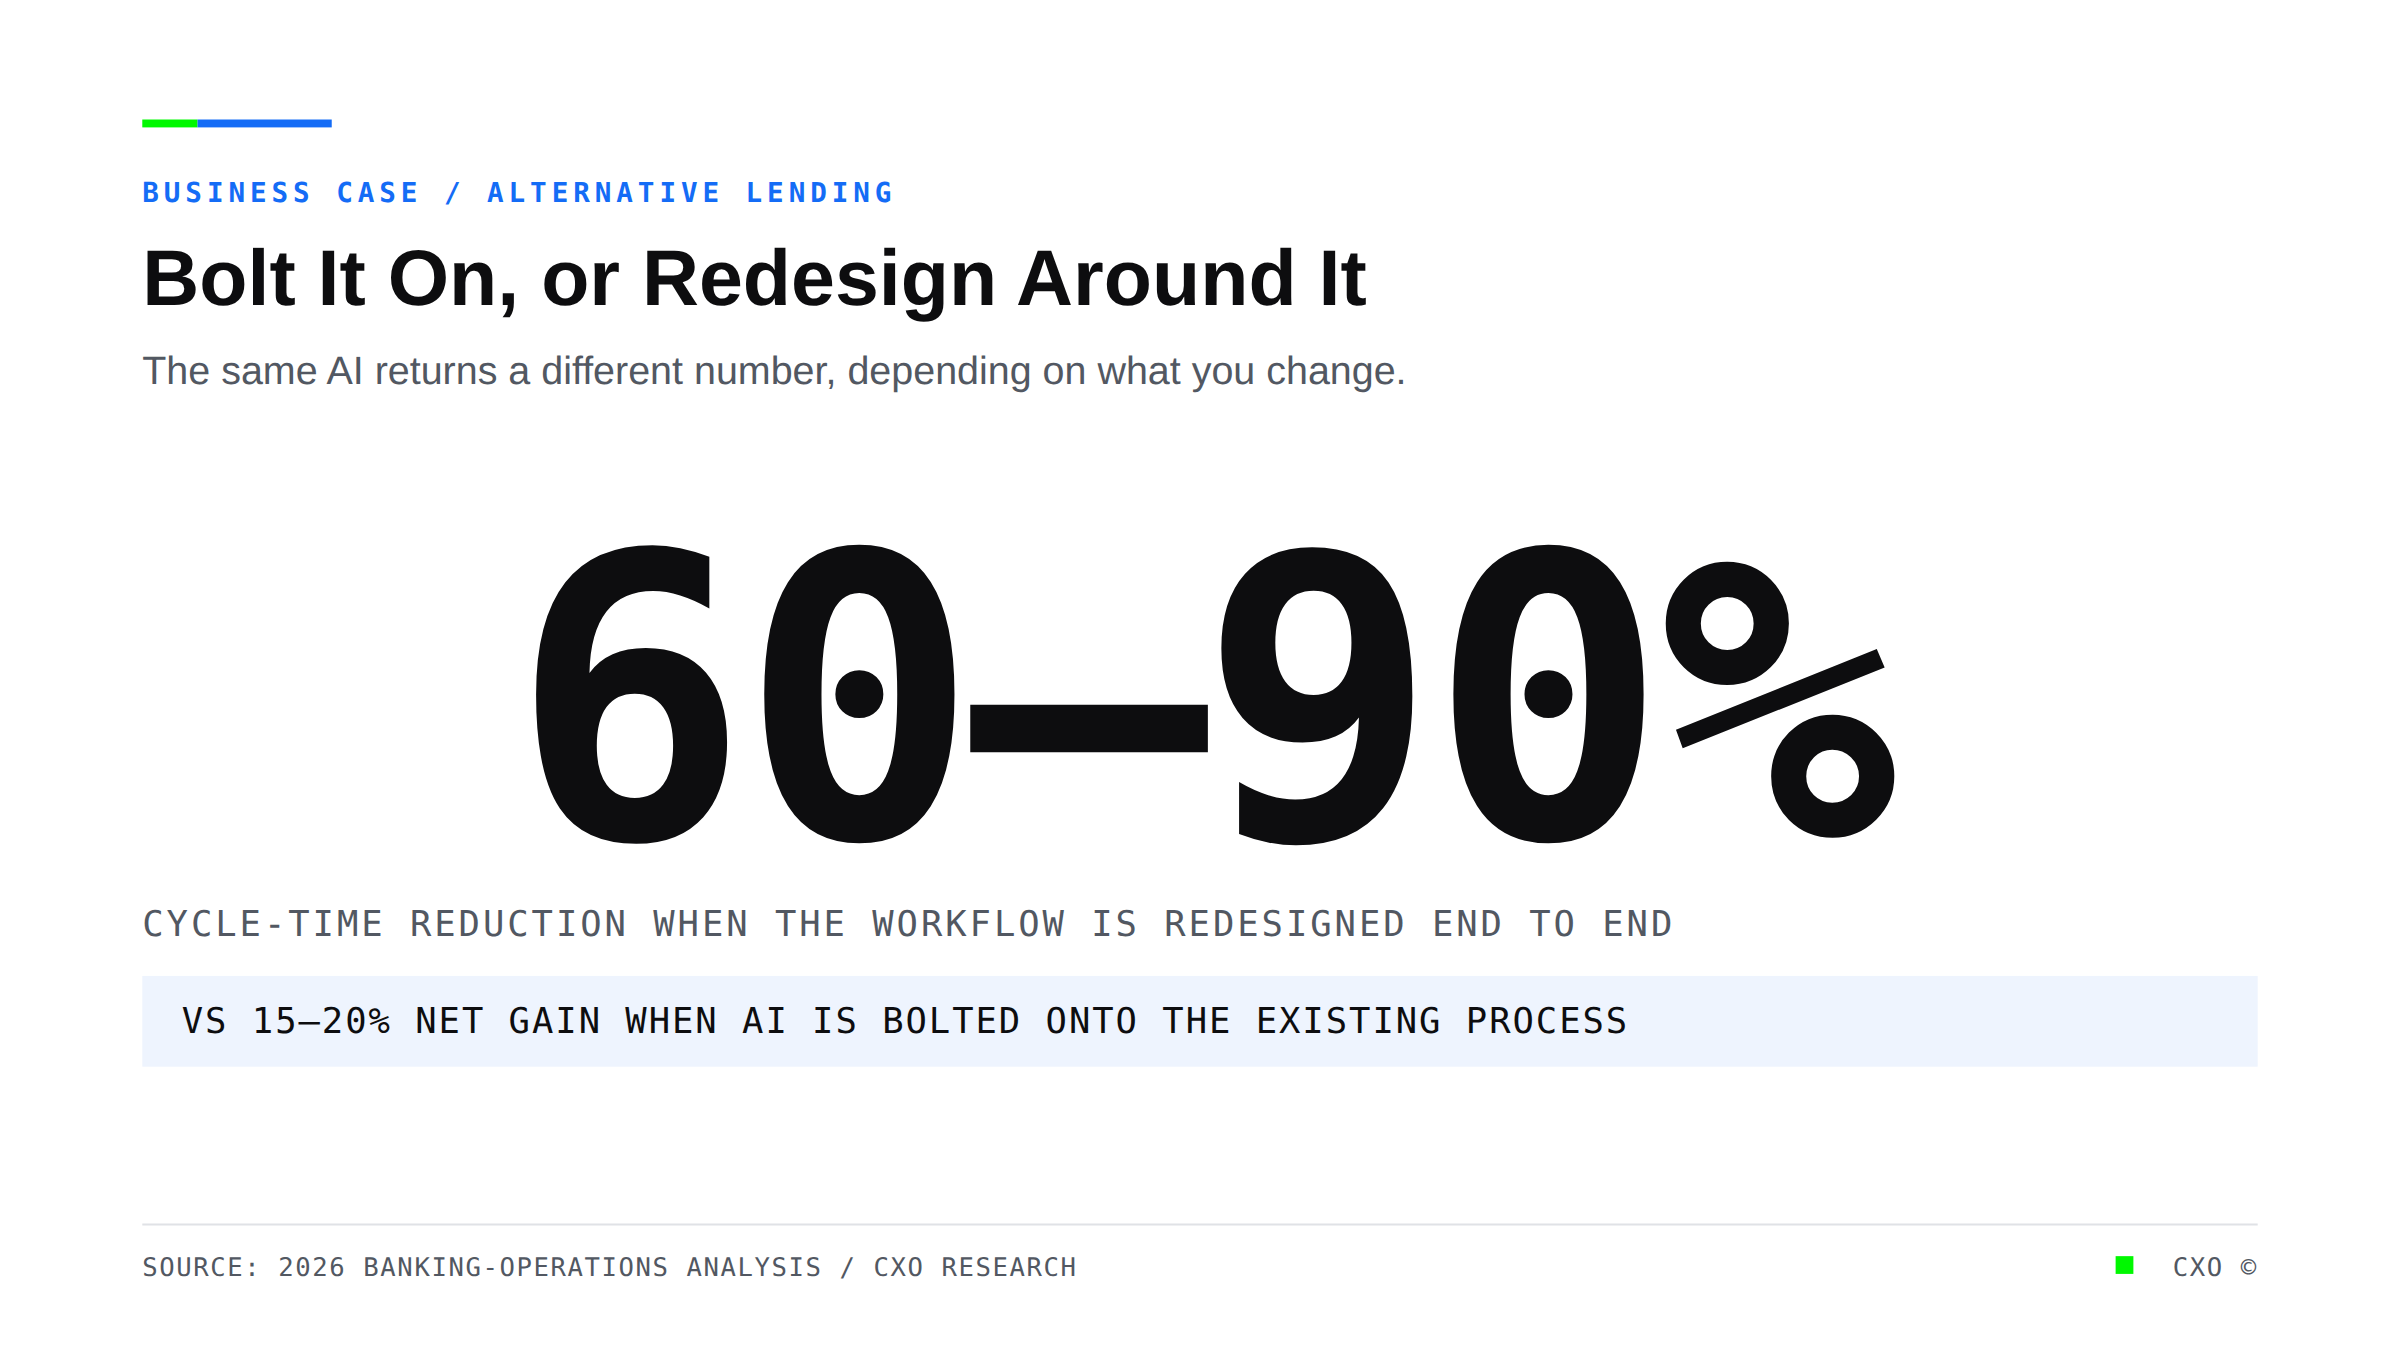
Statement graphic showing a 60 to 90 percent cycle-time reduction when a lending workflow is redesigned end to end, versus a 15 to 20 percent net gain when AI is bolted onto the existing process.

Bolt It On, or Redesign Around It: Why Your 2025 AI Purchase Underdelivered

Most lenders blame the technology when their AI underdelivers. The real issue is a point tool bolted onto an unchanged process. See why end-to-end redesign drives 60 to 90 percent cycle-time reductions.
View Insight
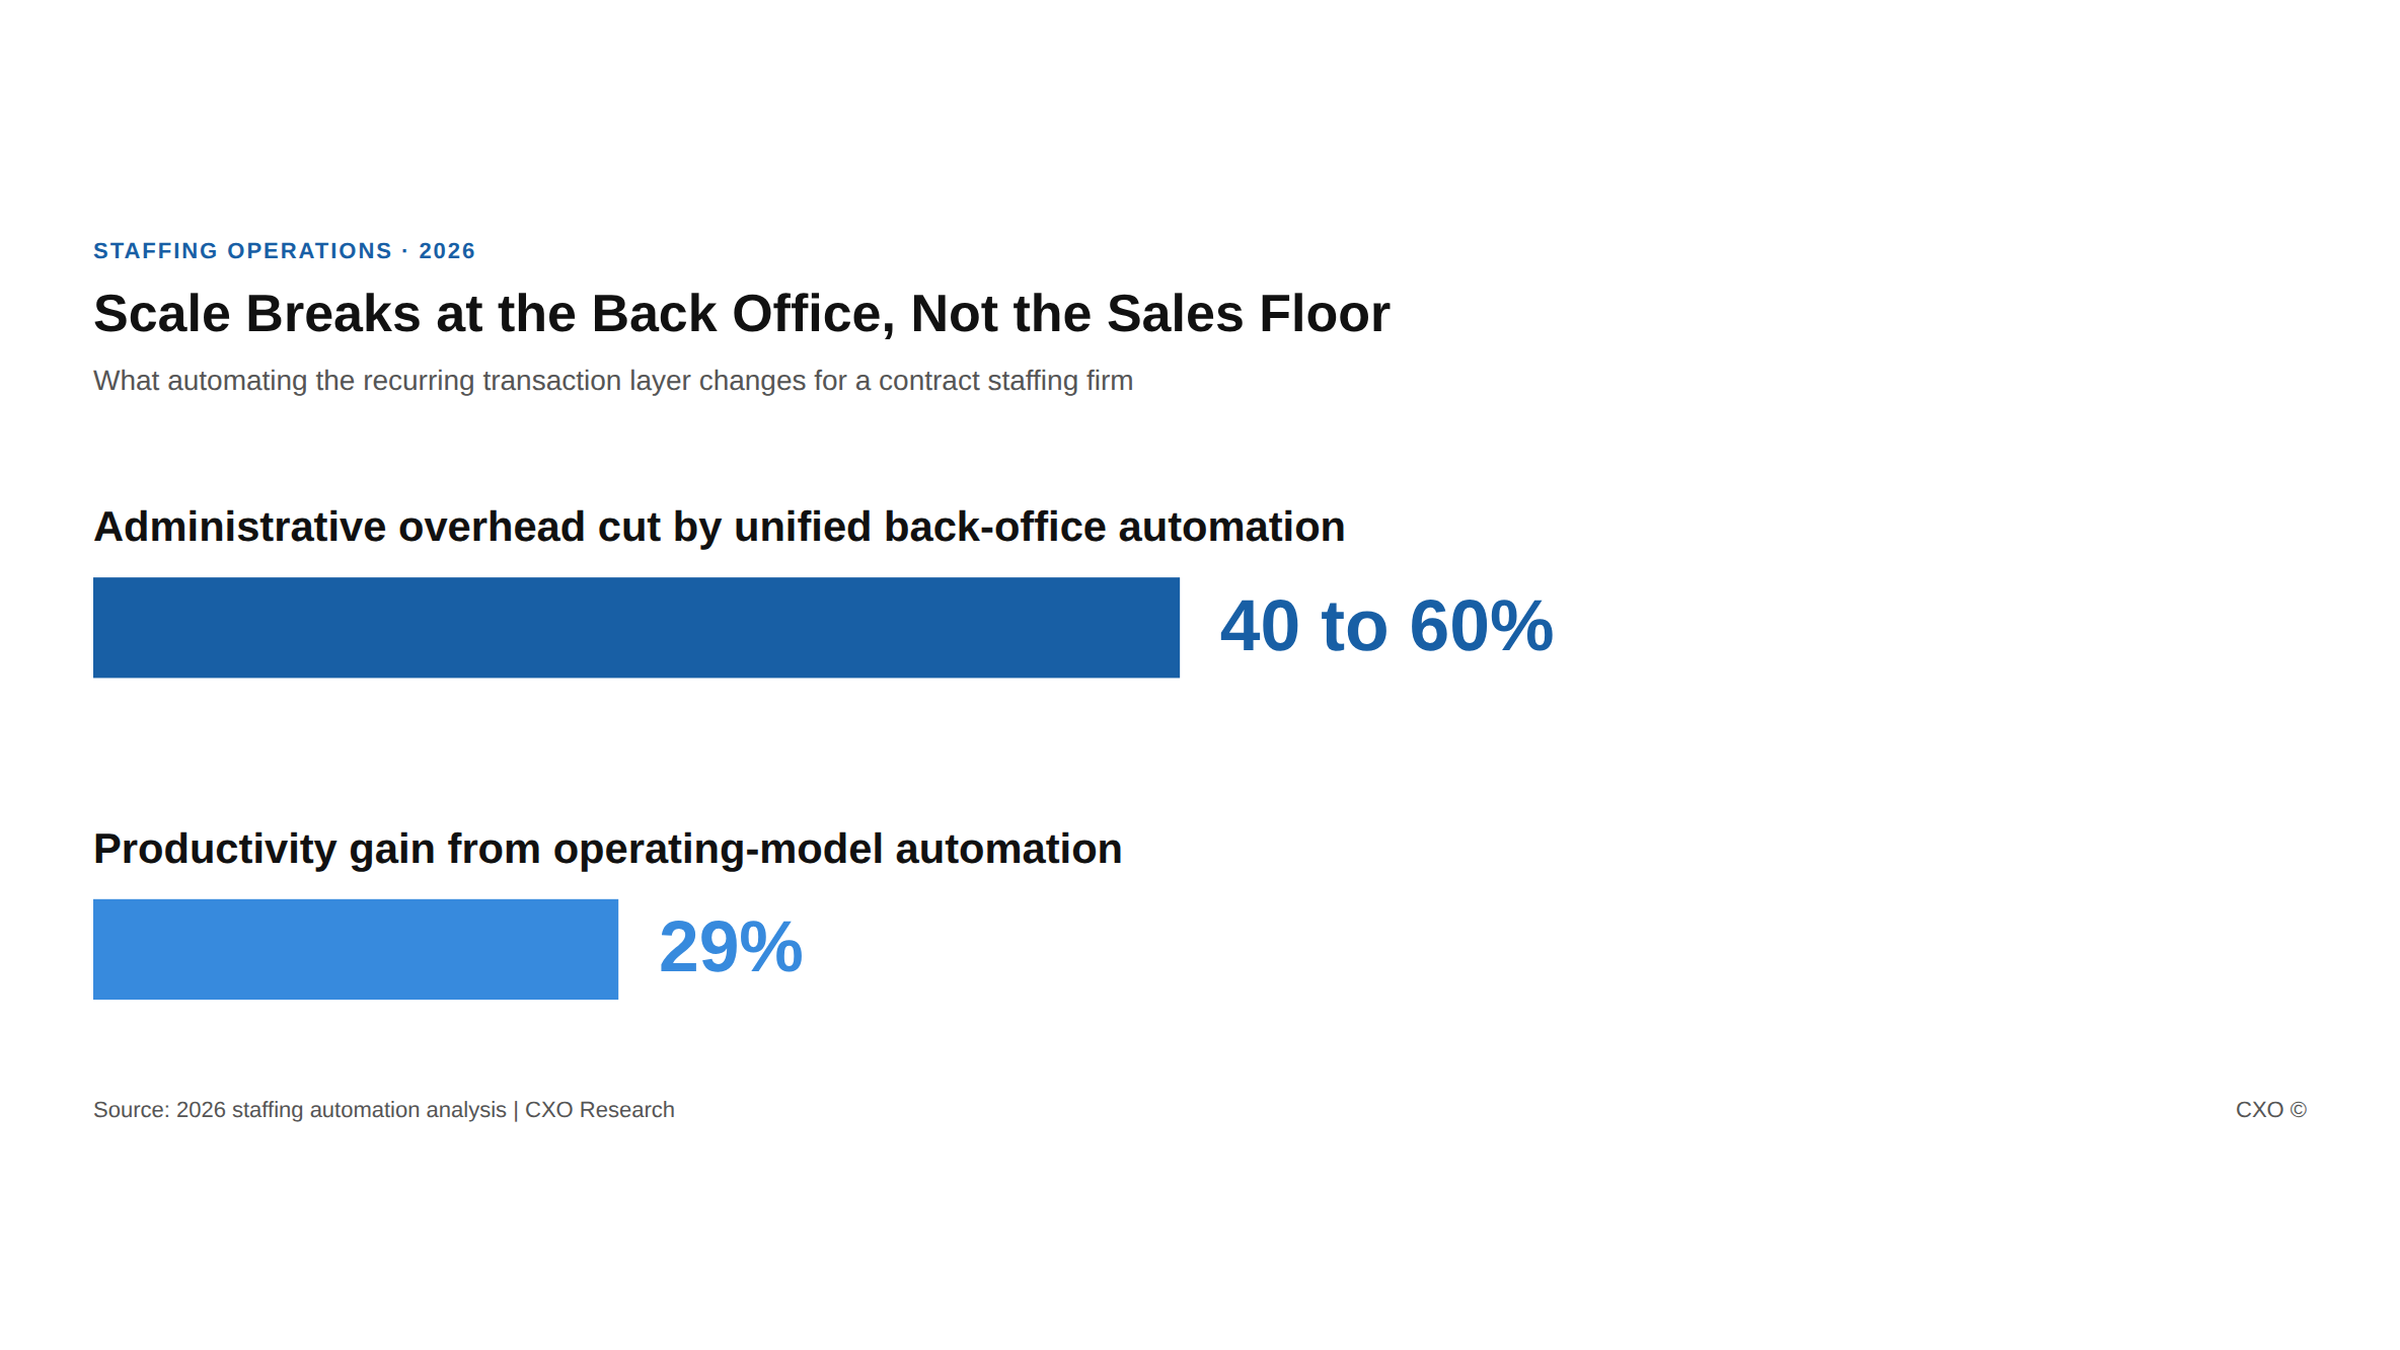
Bar chart showing back-office automation cuts staffing administrative overhead 40 to 60 percent and lifts productivity 29 percent

Contract Staffing Firms Hit a Capacity Wall at Scale. The Ones That Broke Through Automated the Back Office, Not the Sales Floor.

Contract staffing growth multiplies back-office transactions until admin drag caps the firm. See how automating the recurring transaction layer breaks the capacity wall.
View Insight
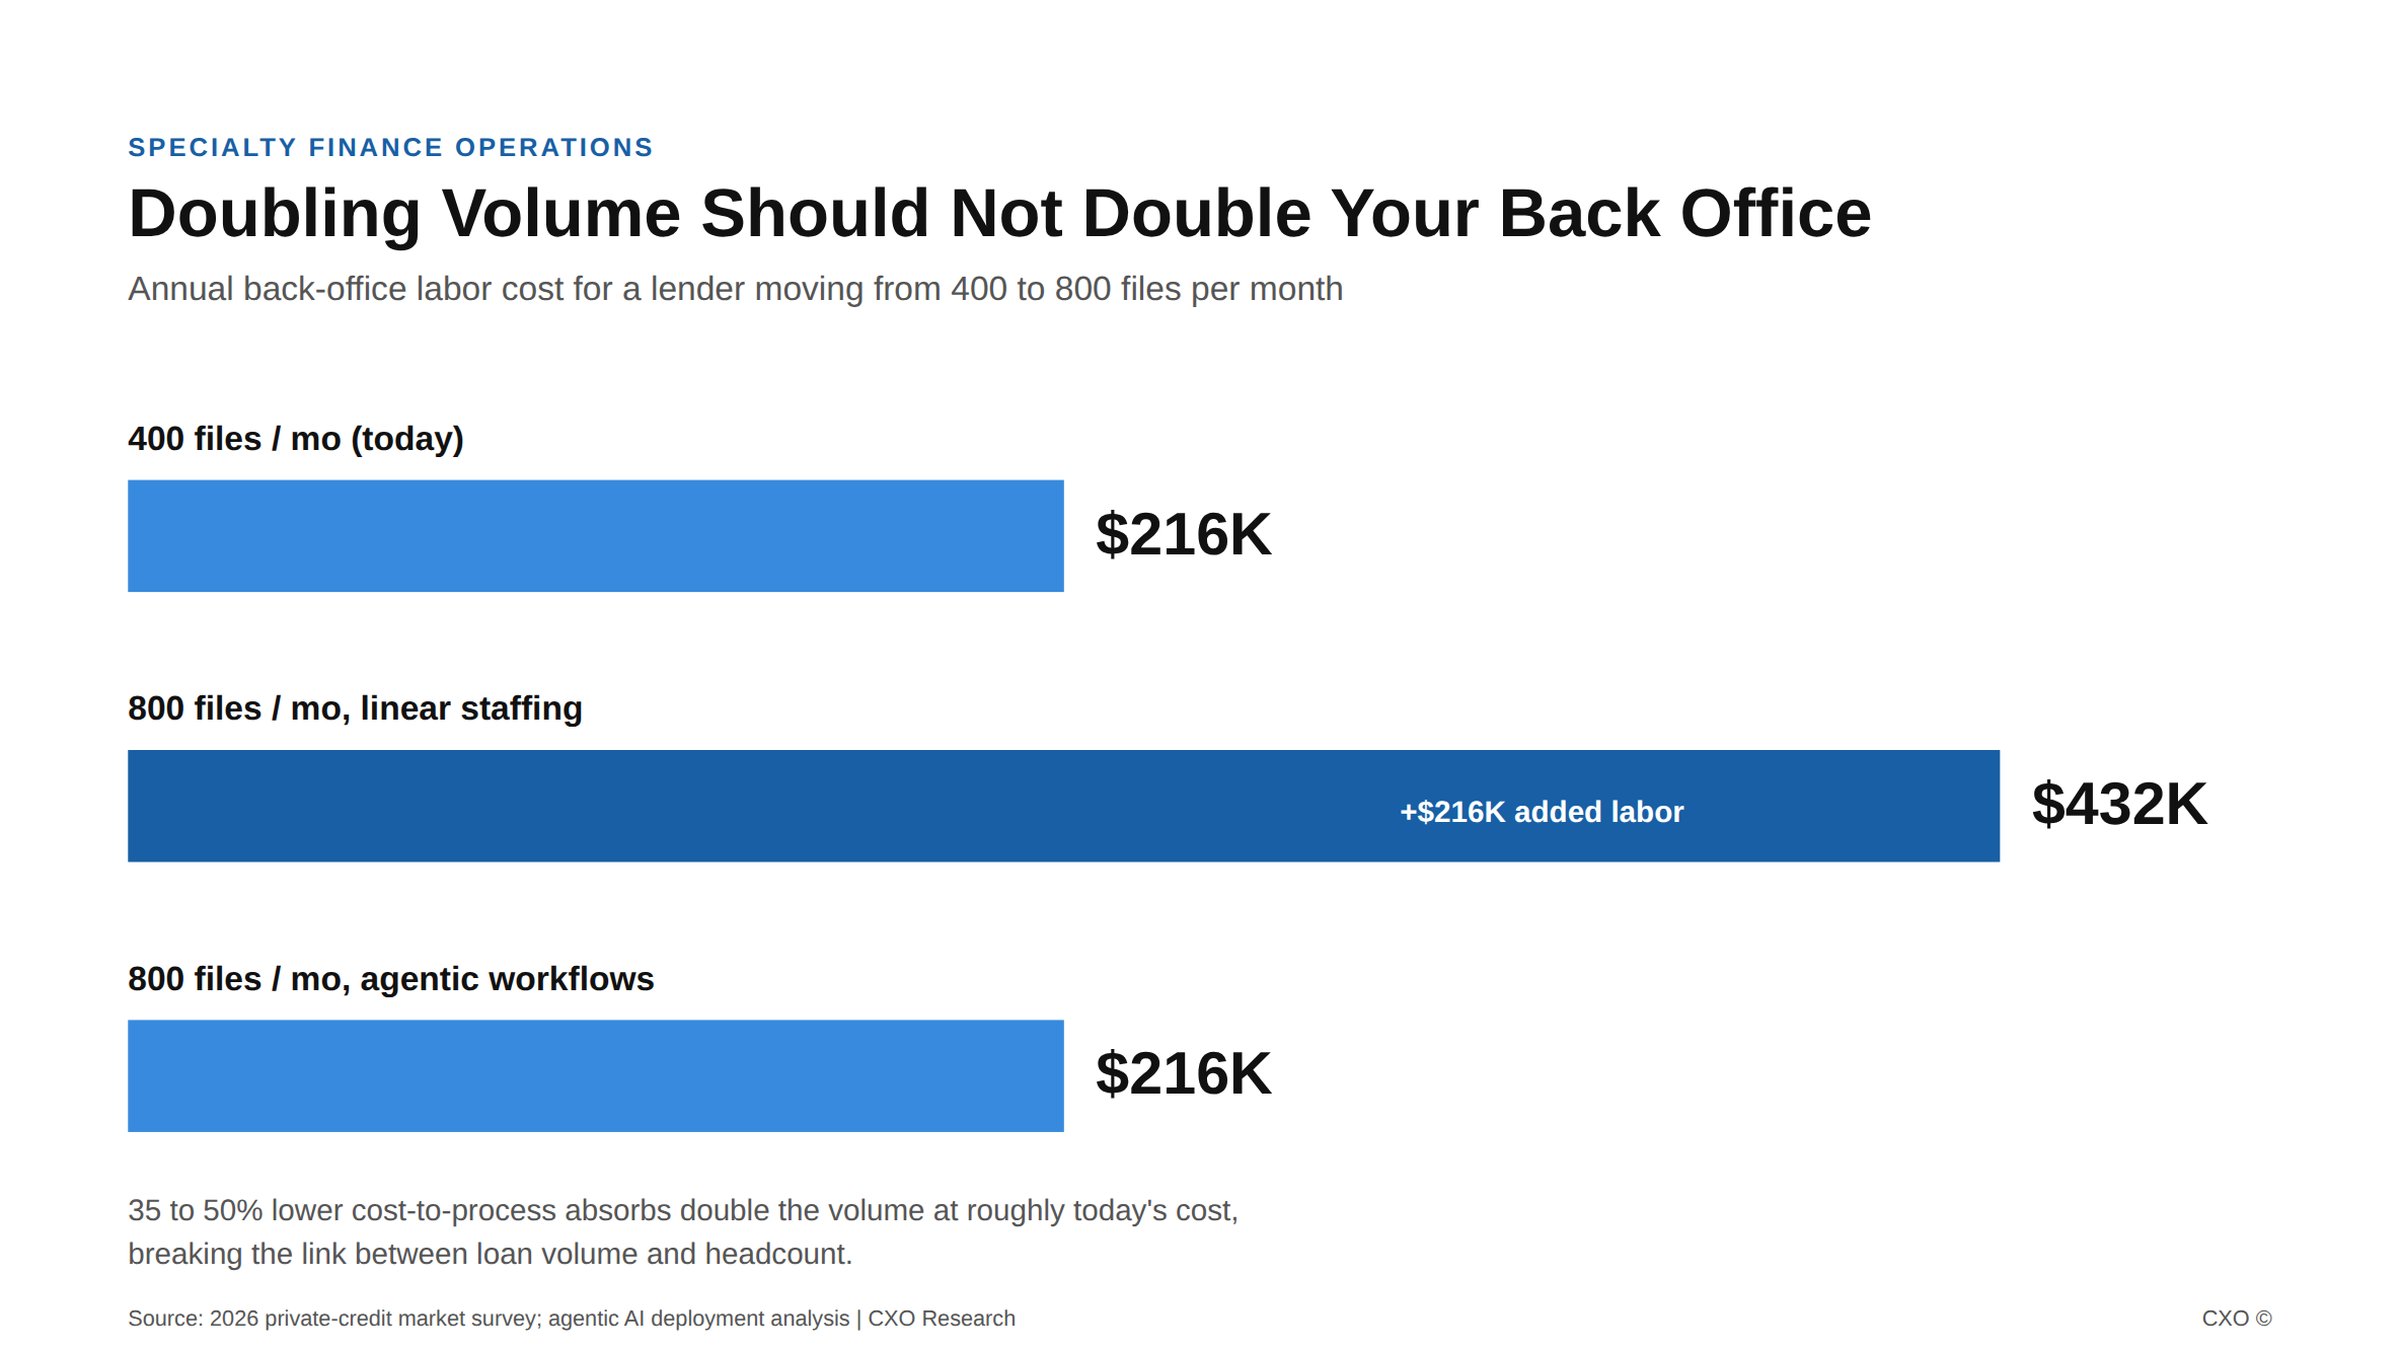
Bar chart comparing linear back-office cost scaling versus agentic cost-to-process for a specialty lender doubling loan volume.

Specialty Finance Is About to Outgrow Its Own Back Office

83% of private-credit firms expect AUM growth in 12 to 18 months. Here is why staffing back office linearly turns that growth into a $216,000 labor line, and how to break the link. Word count: ~915. Now the company post.
View Insight
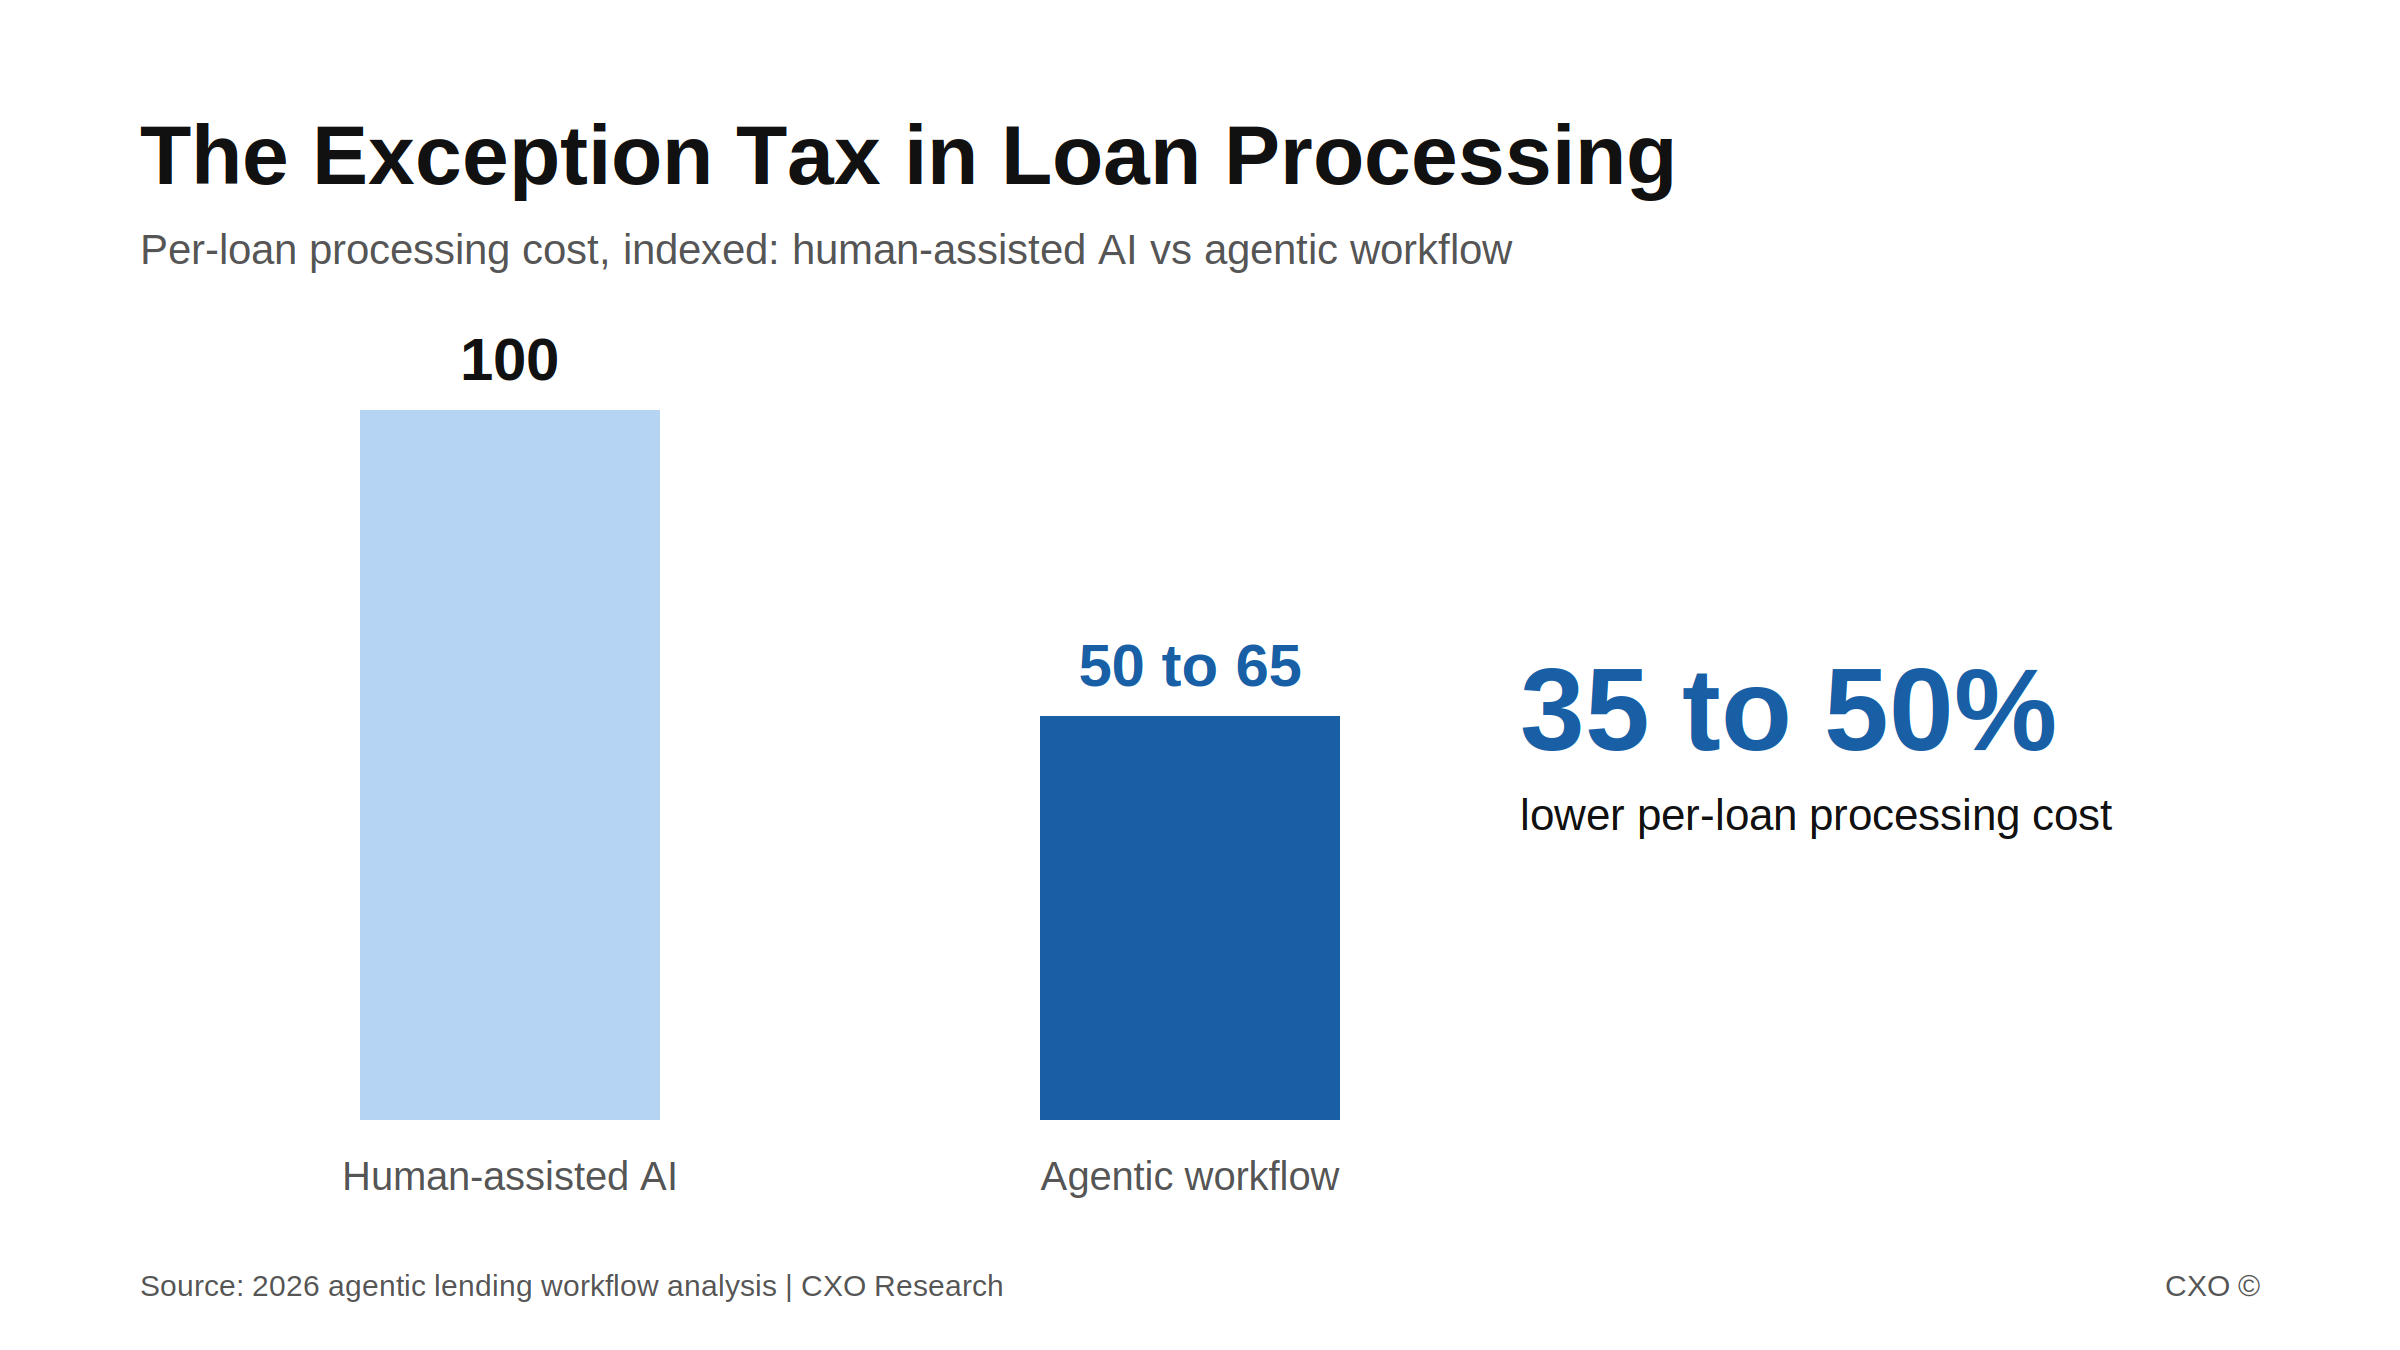
Bar chart showing agentic workflows cut per-loan processing cost 35 to 50 percent versus human-assisted AI

The Exception Queue Is the Most Expensive Line in Your Loan Operation

Agentic workflows cut per-loan processing cost 35 to 50% by eliminating the exception queue scripted automation creates. Here is the math most lenders never run.
View Insight
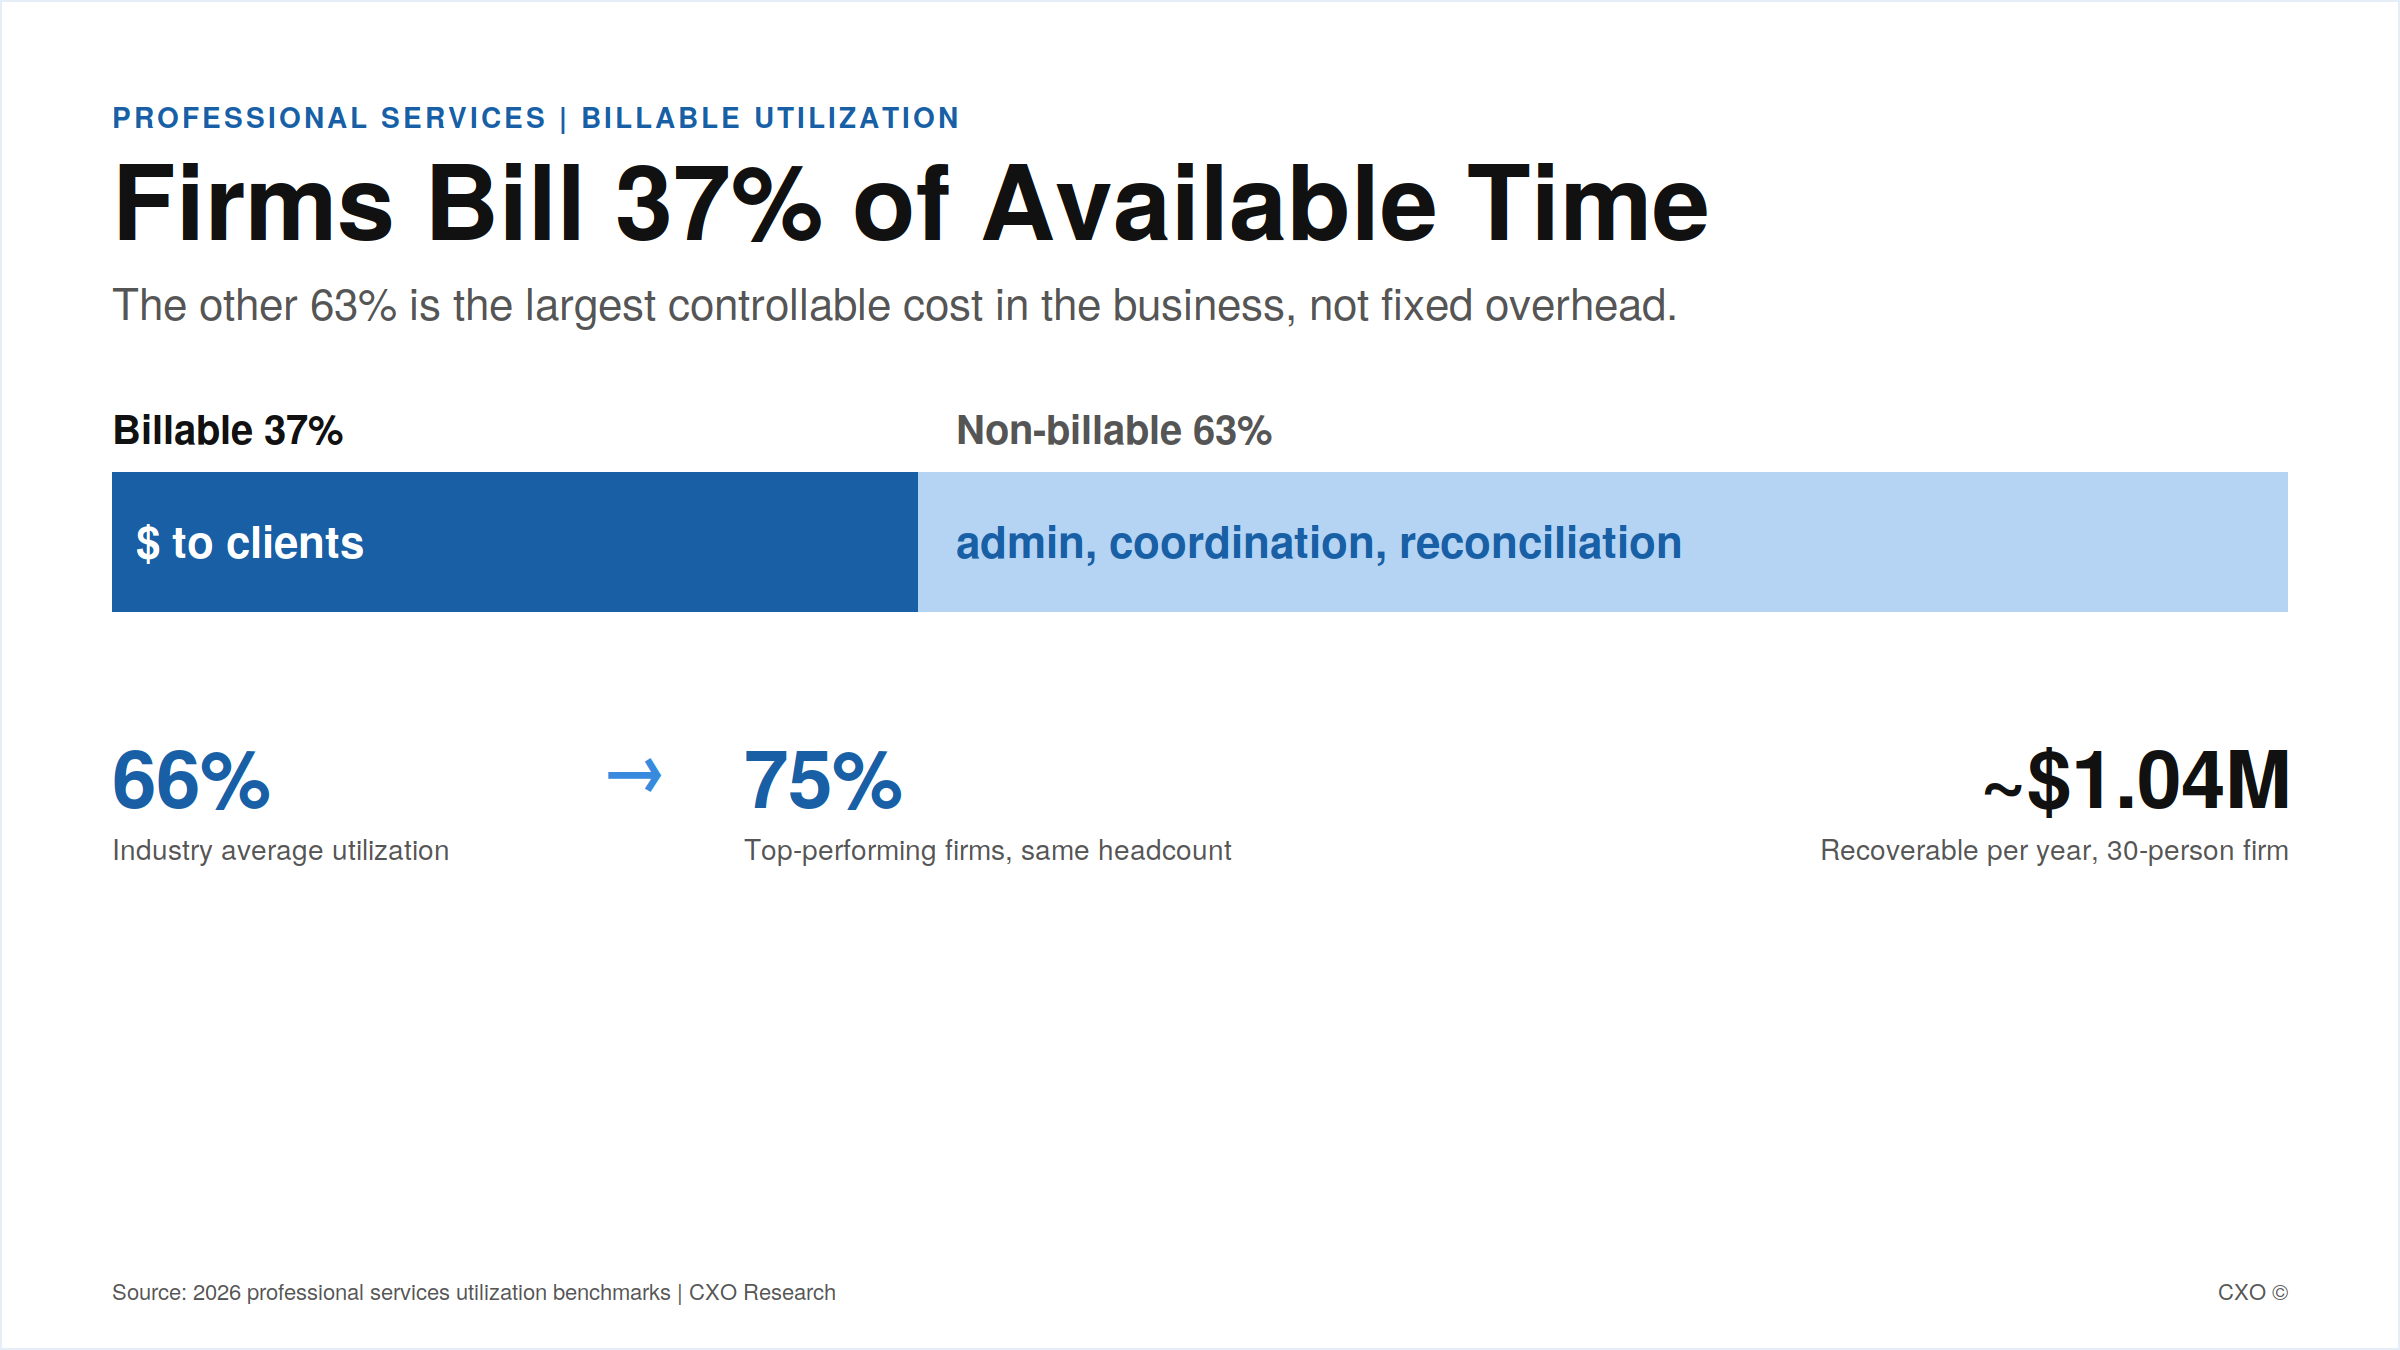
Split bar showing 37 percent of professional services time is billable and 63 percent non-billable, with utilization rising from 66 percent to 75 percent and roughly $1.04M recoverable at a 30-person firm

Your Partners Bill 37% of Their Day. The Other 63% Is Where Your Margin Is Hiding.

Professional services firms bill about 37% of available time while roughly 14 non-billable hours a week per person quietly erode margin. Here is where the money hides and how to reclaim it without hiring.
View Insight

Ready to put agentic AI to work?

See where automation can take the manual, repetitive work off your team. Book a discovery call and we'll map the highest-impact processes in your operation.

Book a discovery call