CXO Research

Insights

Agentic AI analysis, operational strategy, and implementation intelligence for financial services firms and growth-stage businesses.

Bar chart showing recoverable AR loss percentage from inconsistent collections follow-up at alternative lenders

18% of the Portfolio Is Paying for Itself. The Collections Team Just Doesn't Know It.

Manual collections processes leave 15–20% of recoverable AR uncollected. Here is what structured agentic automation changes and why the gap is widening in 2026.
View Insight
Visual showing the gap between companies using AI tools and companies that have redesigned workflows for autonomous agent execution

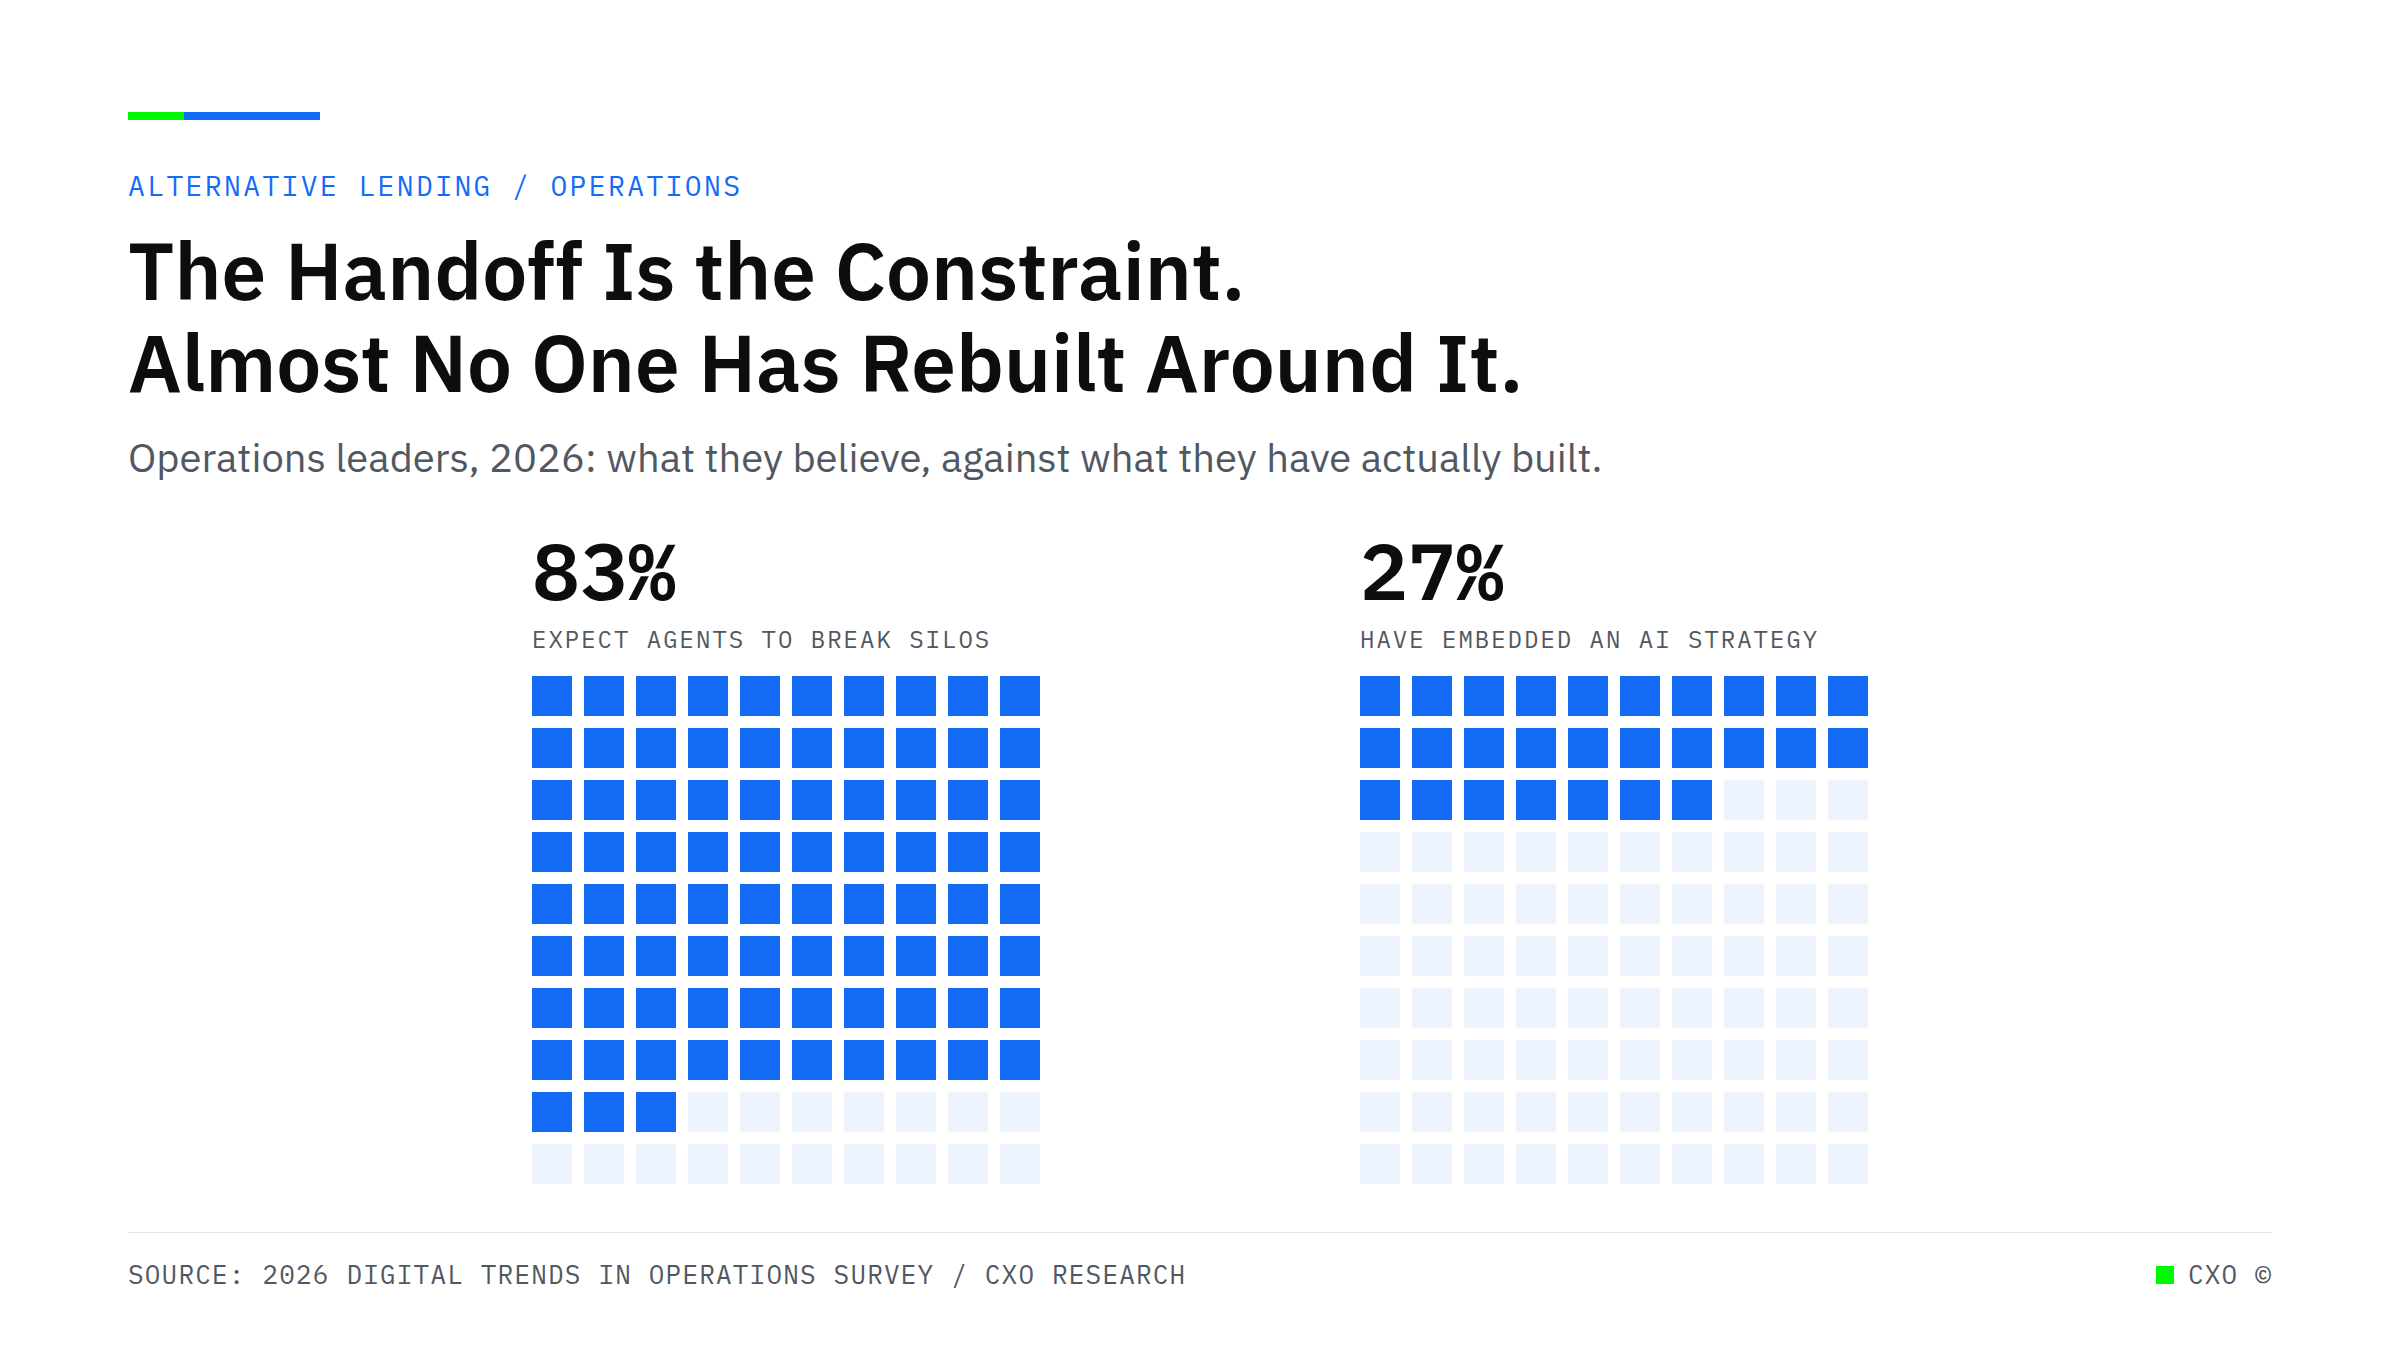
Your Org Chart Was Built to Coordinate Humans. That's Now a Competitive Liability.

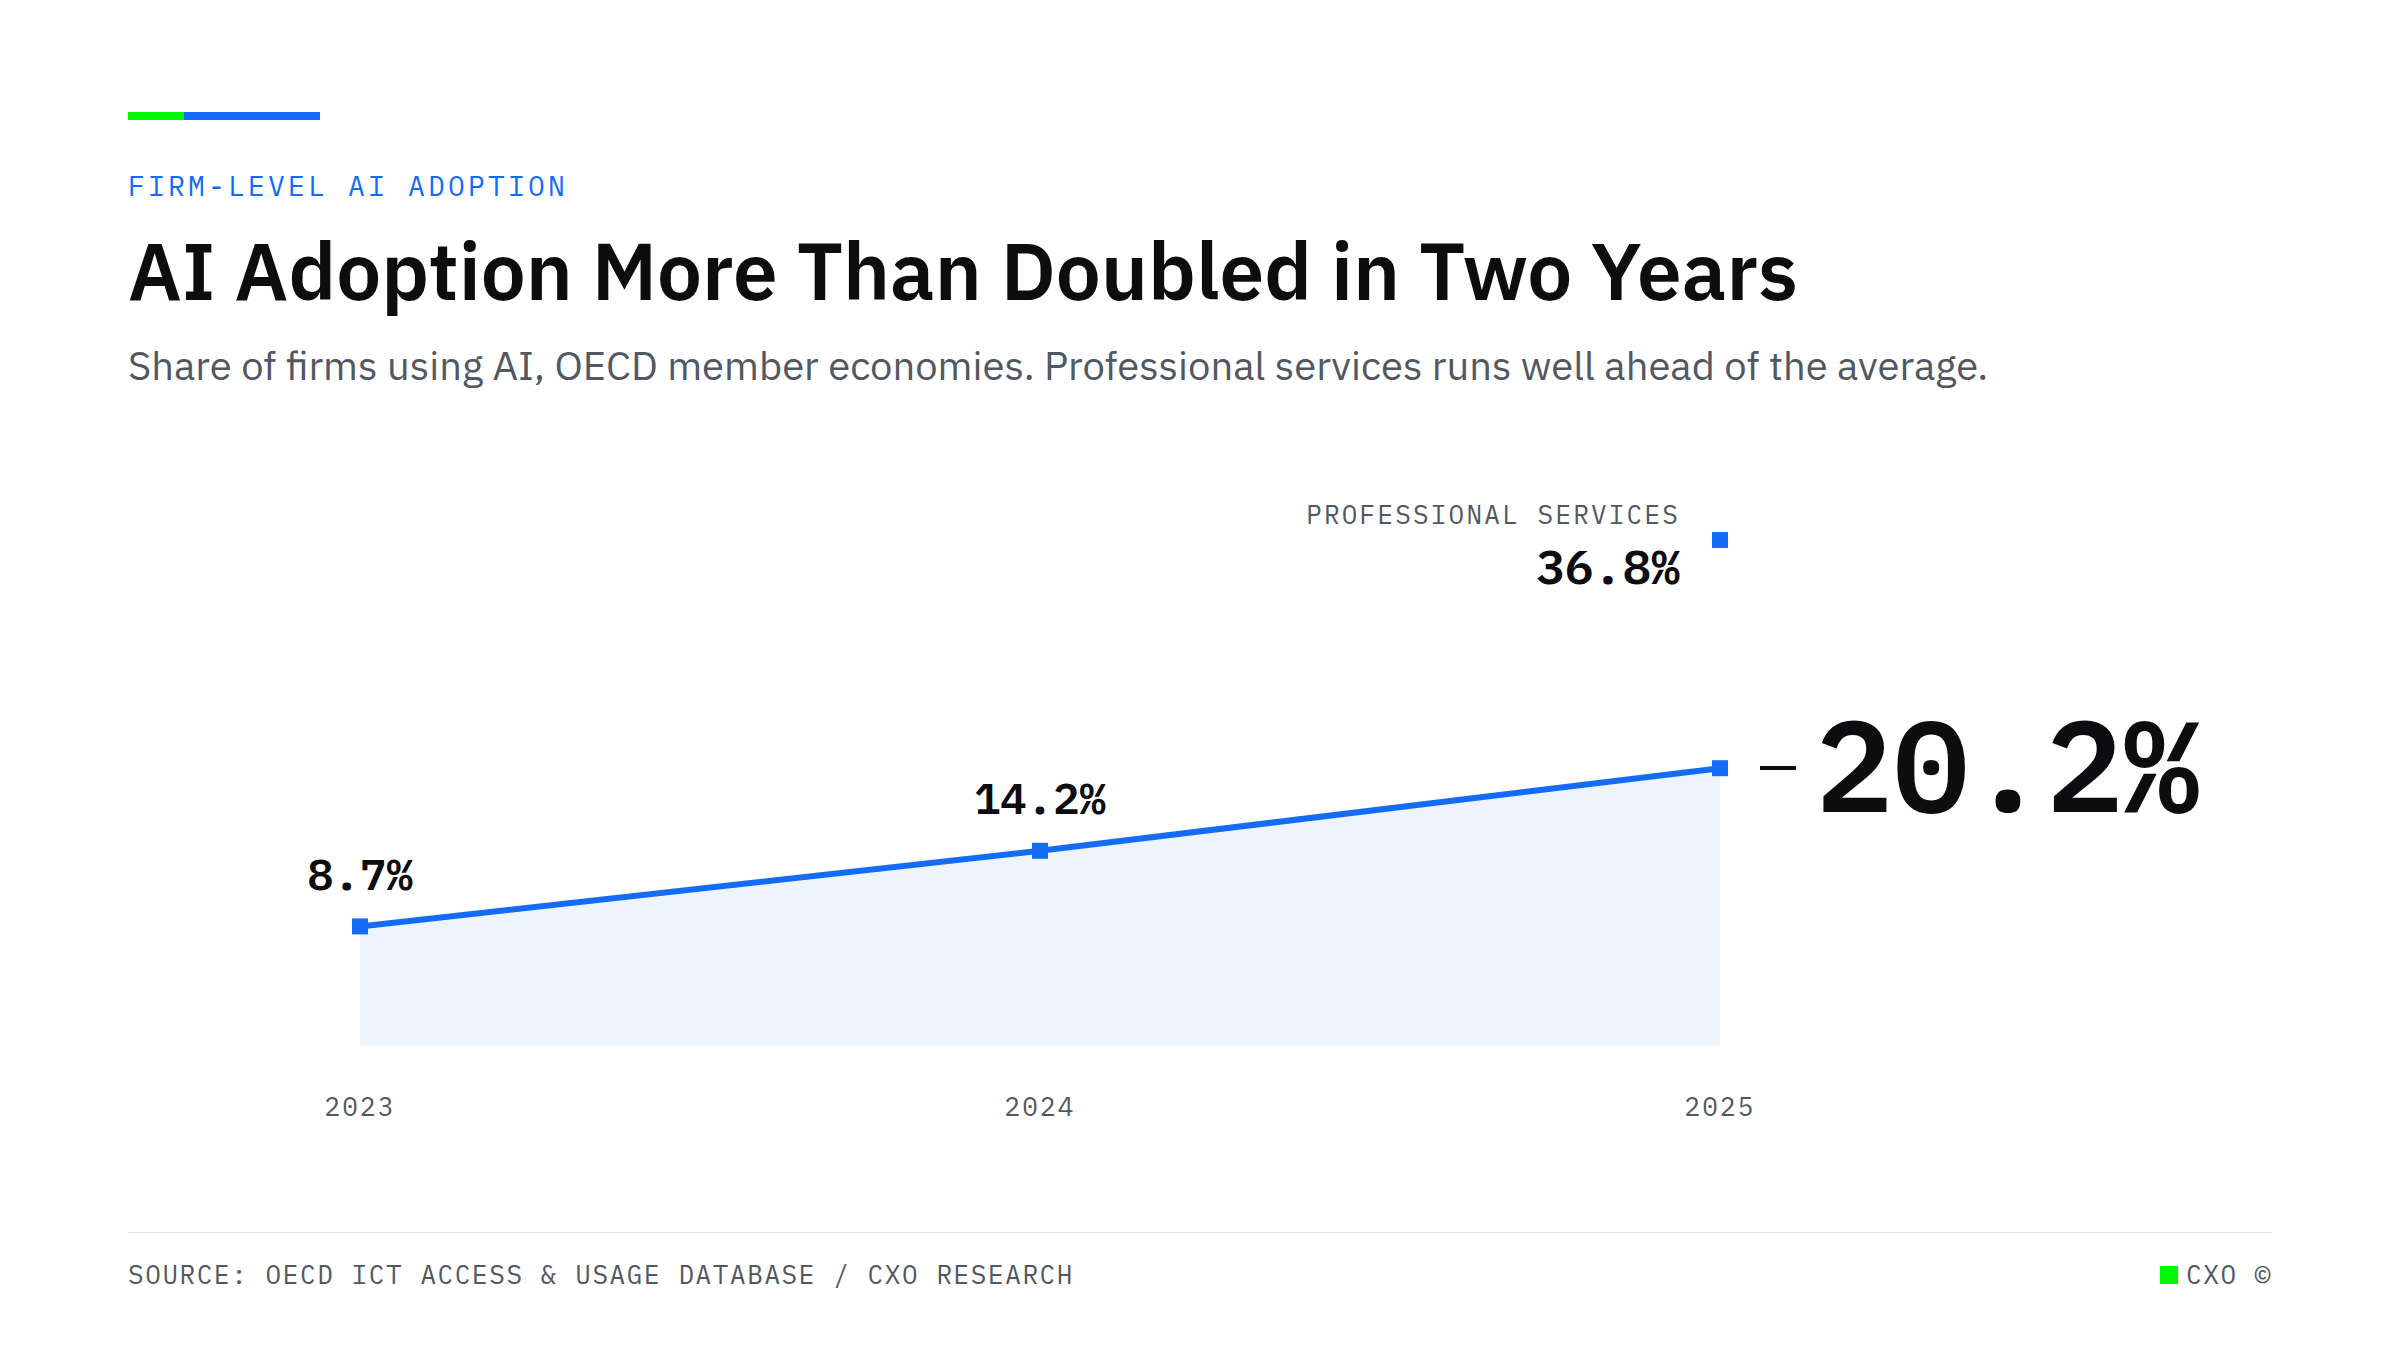
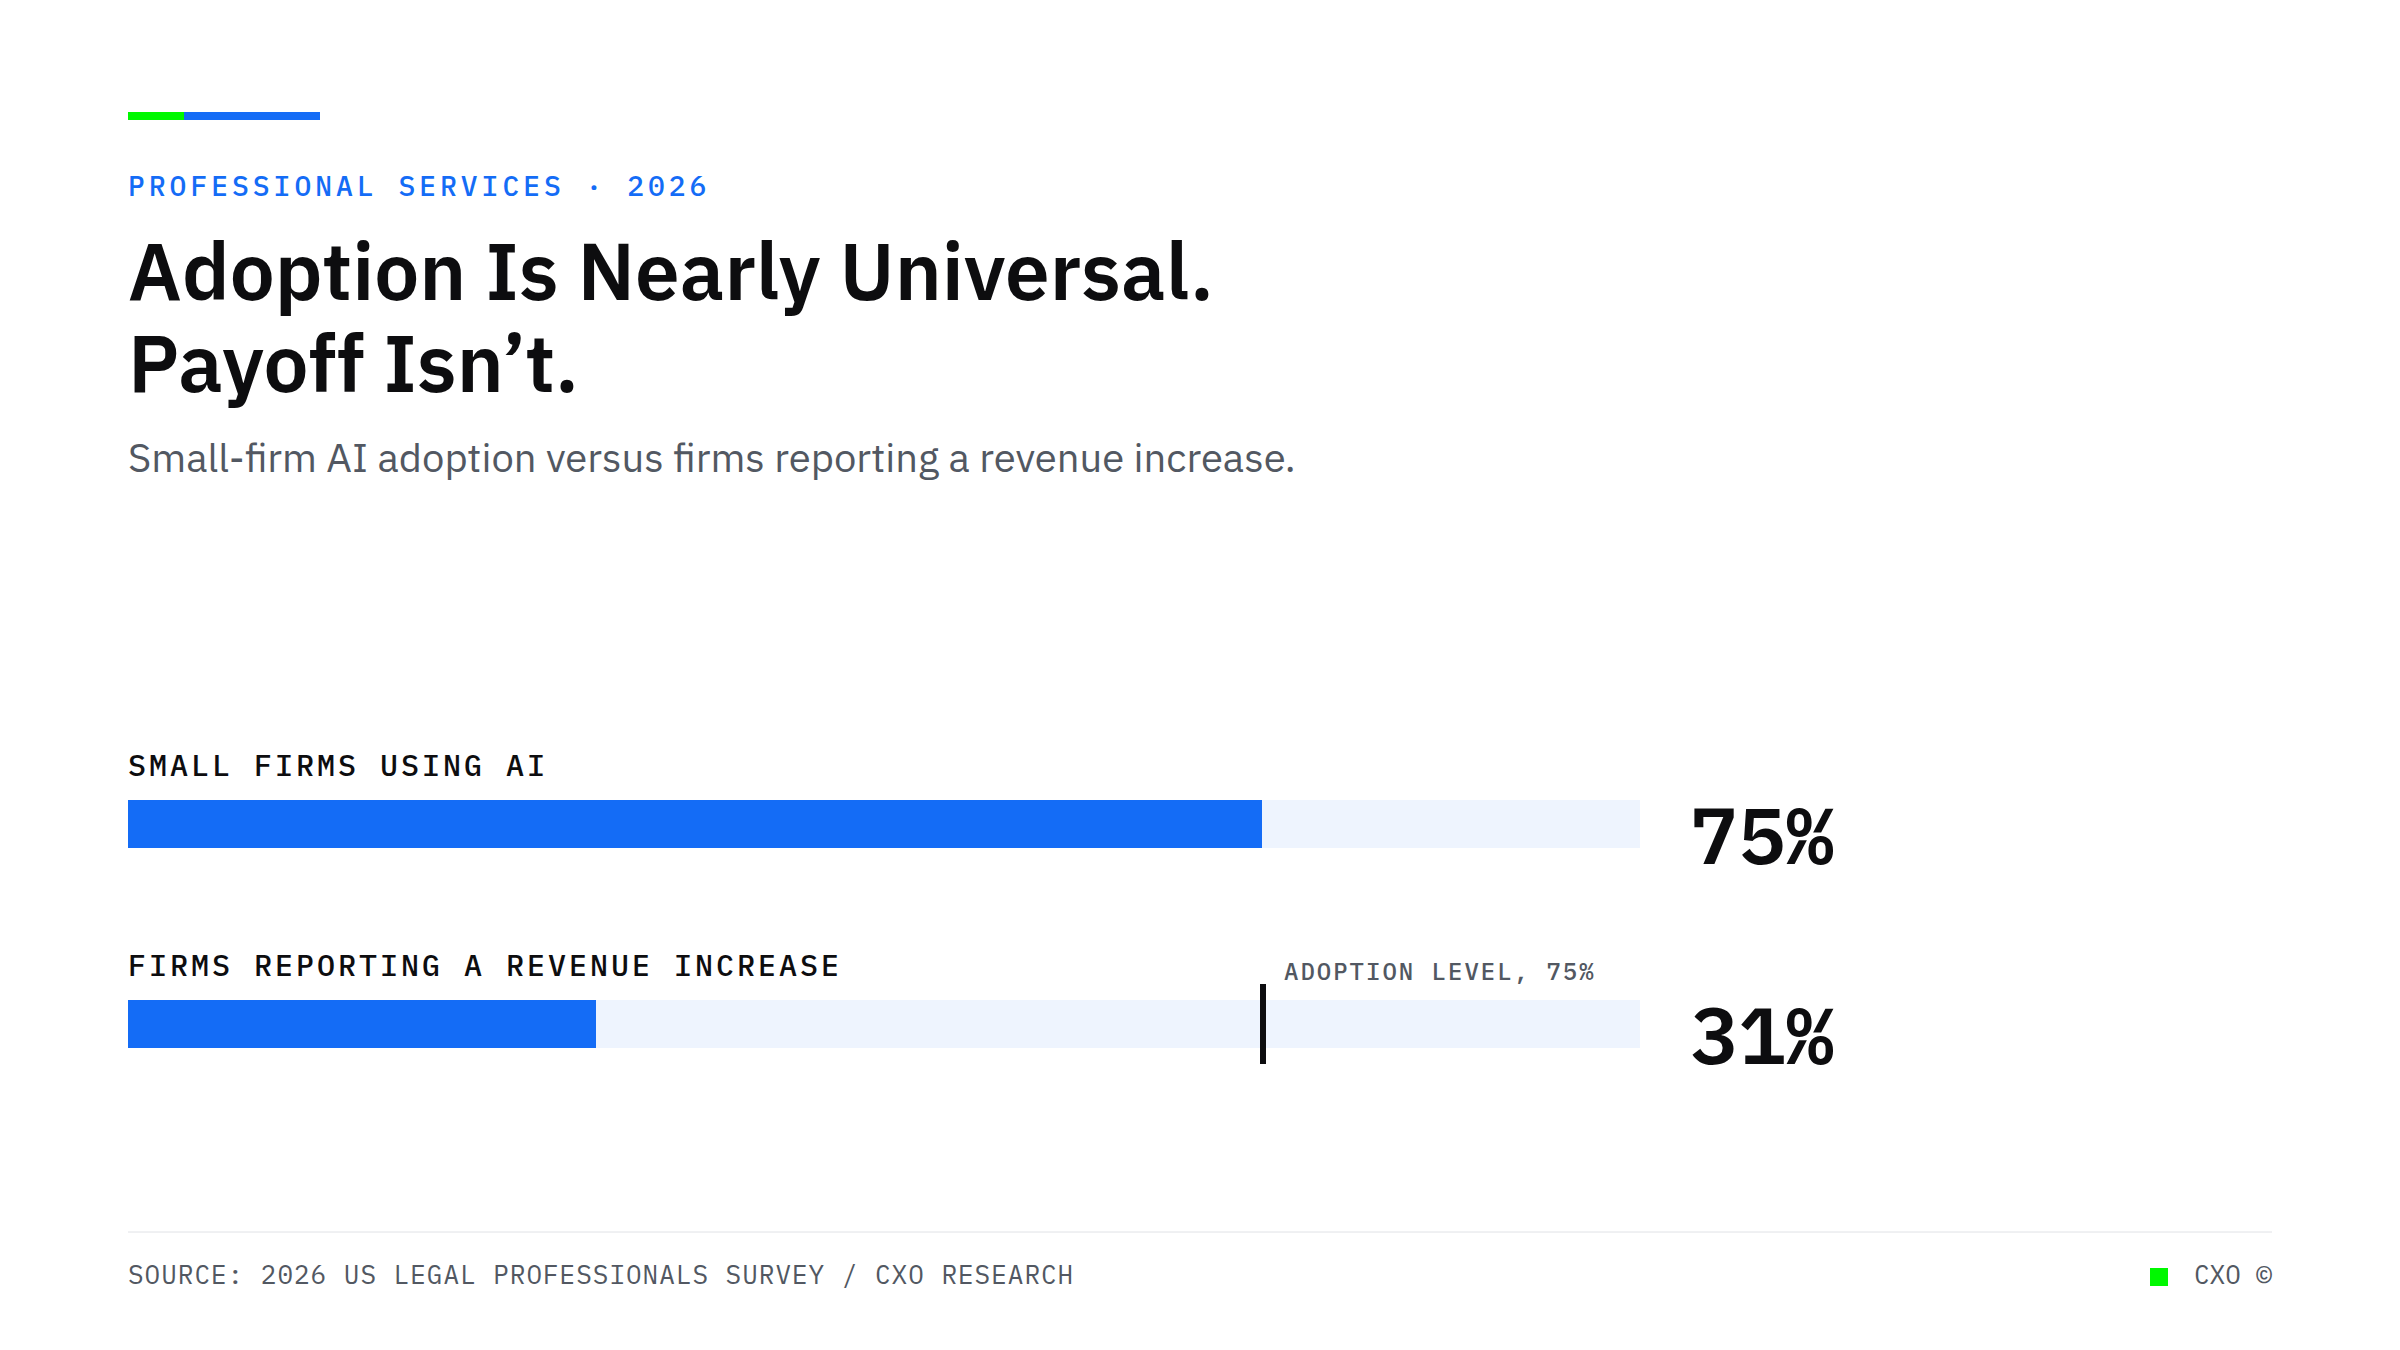
78% of companies use AI. 80% report no earnings impact. The problem isn't the technology. It's the workflow structure AI is running inside
View Insight
Bar chart showing the gap between companies experimenting with AI agents and companies that have scaled agentic AI to measurable operational value

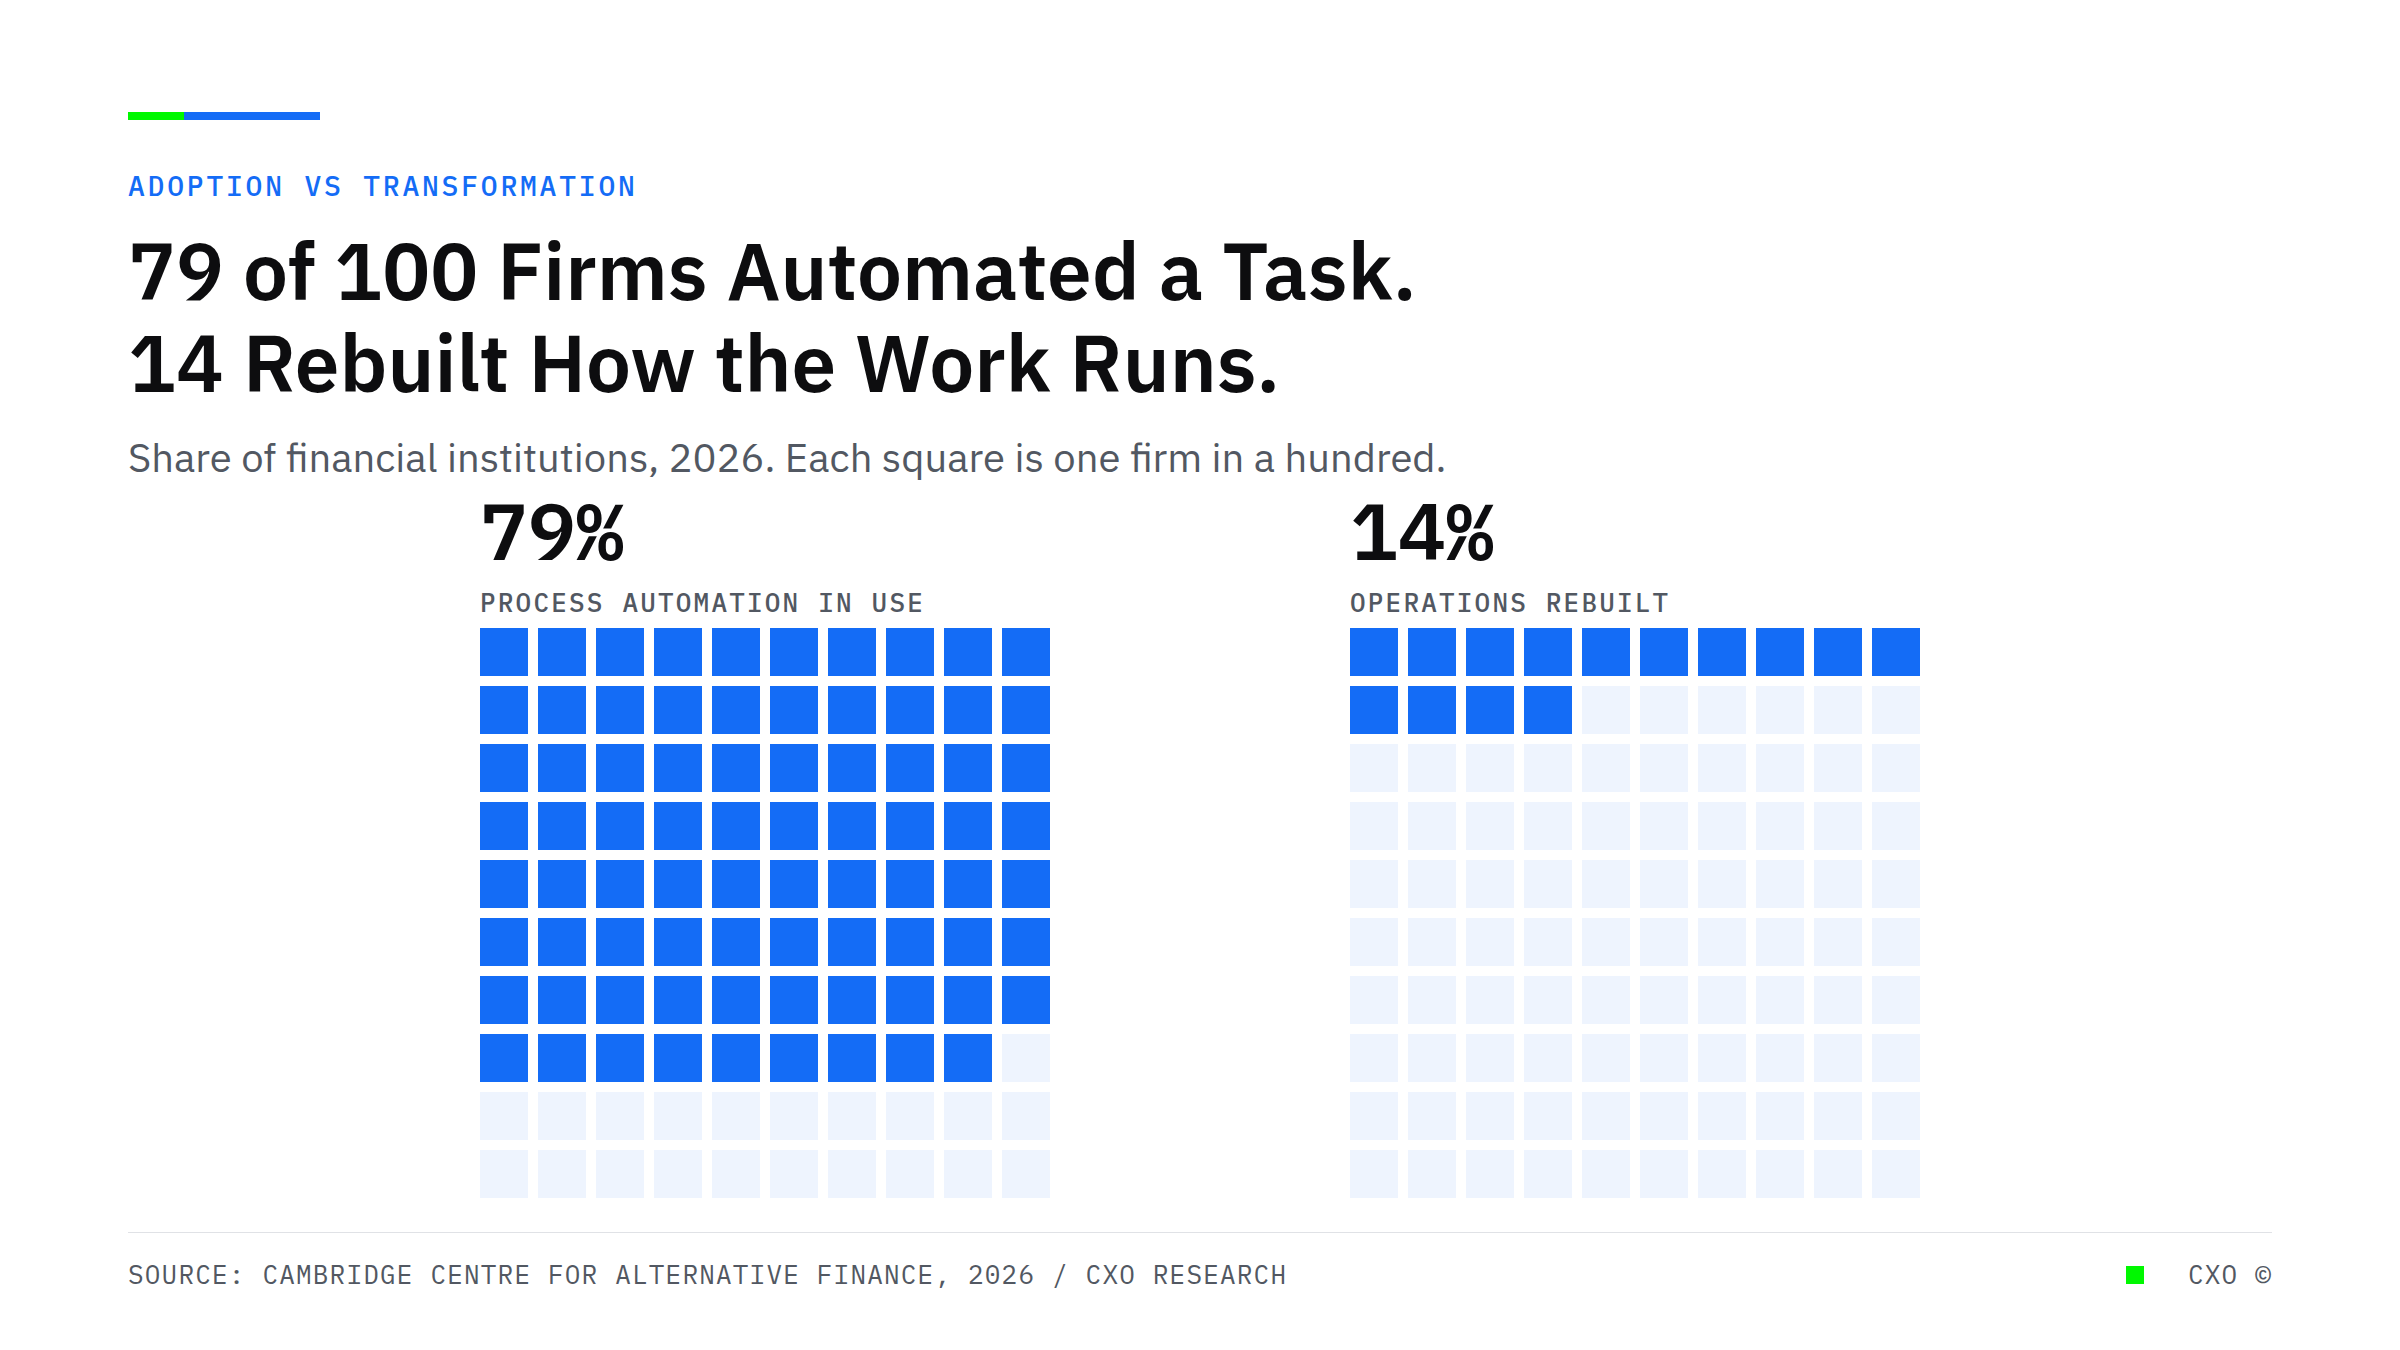
Only 10% of Companies Using AI Are Actually Changing Their Cost Structure

Nearly two-thirds of companies have tried AI agents. Fewer than 10% restructured their operations. Here's what the 10% actually did differently.
View Insight
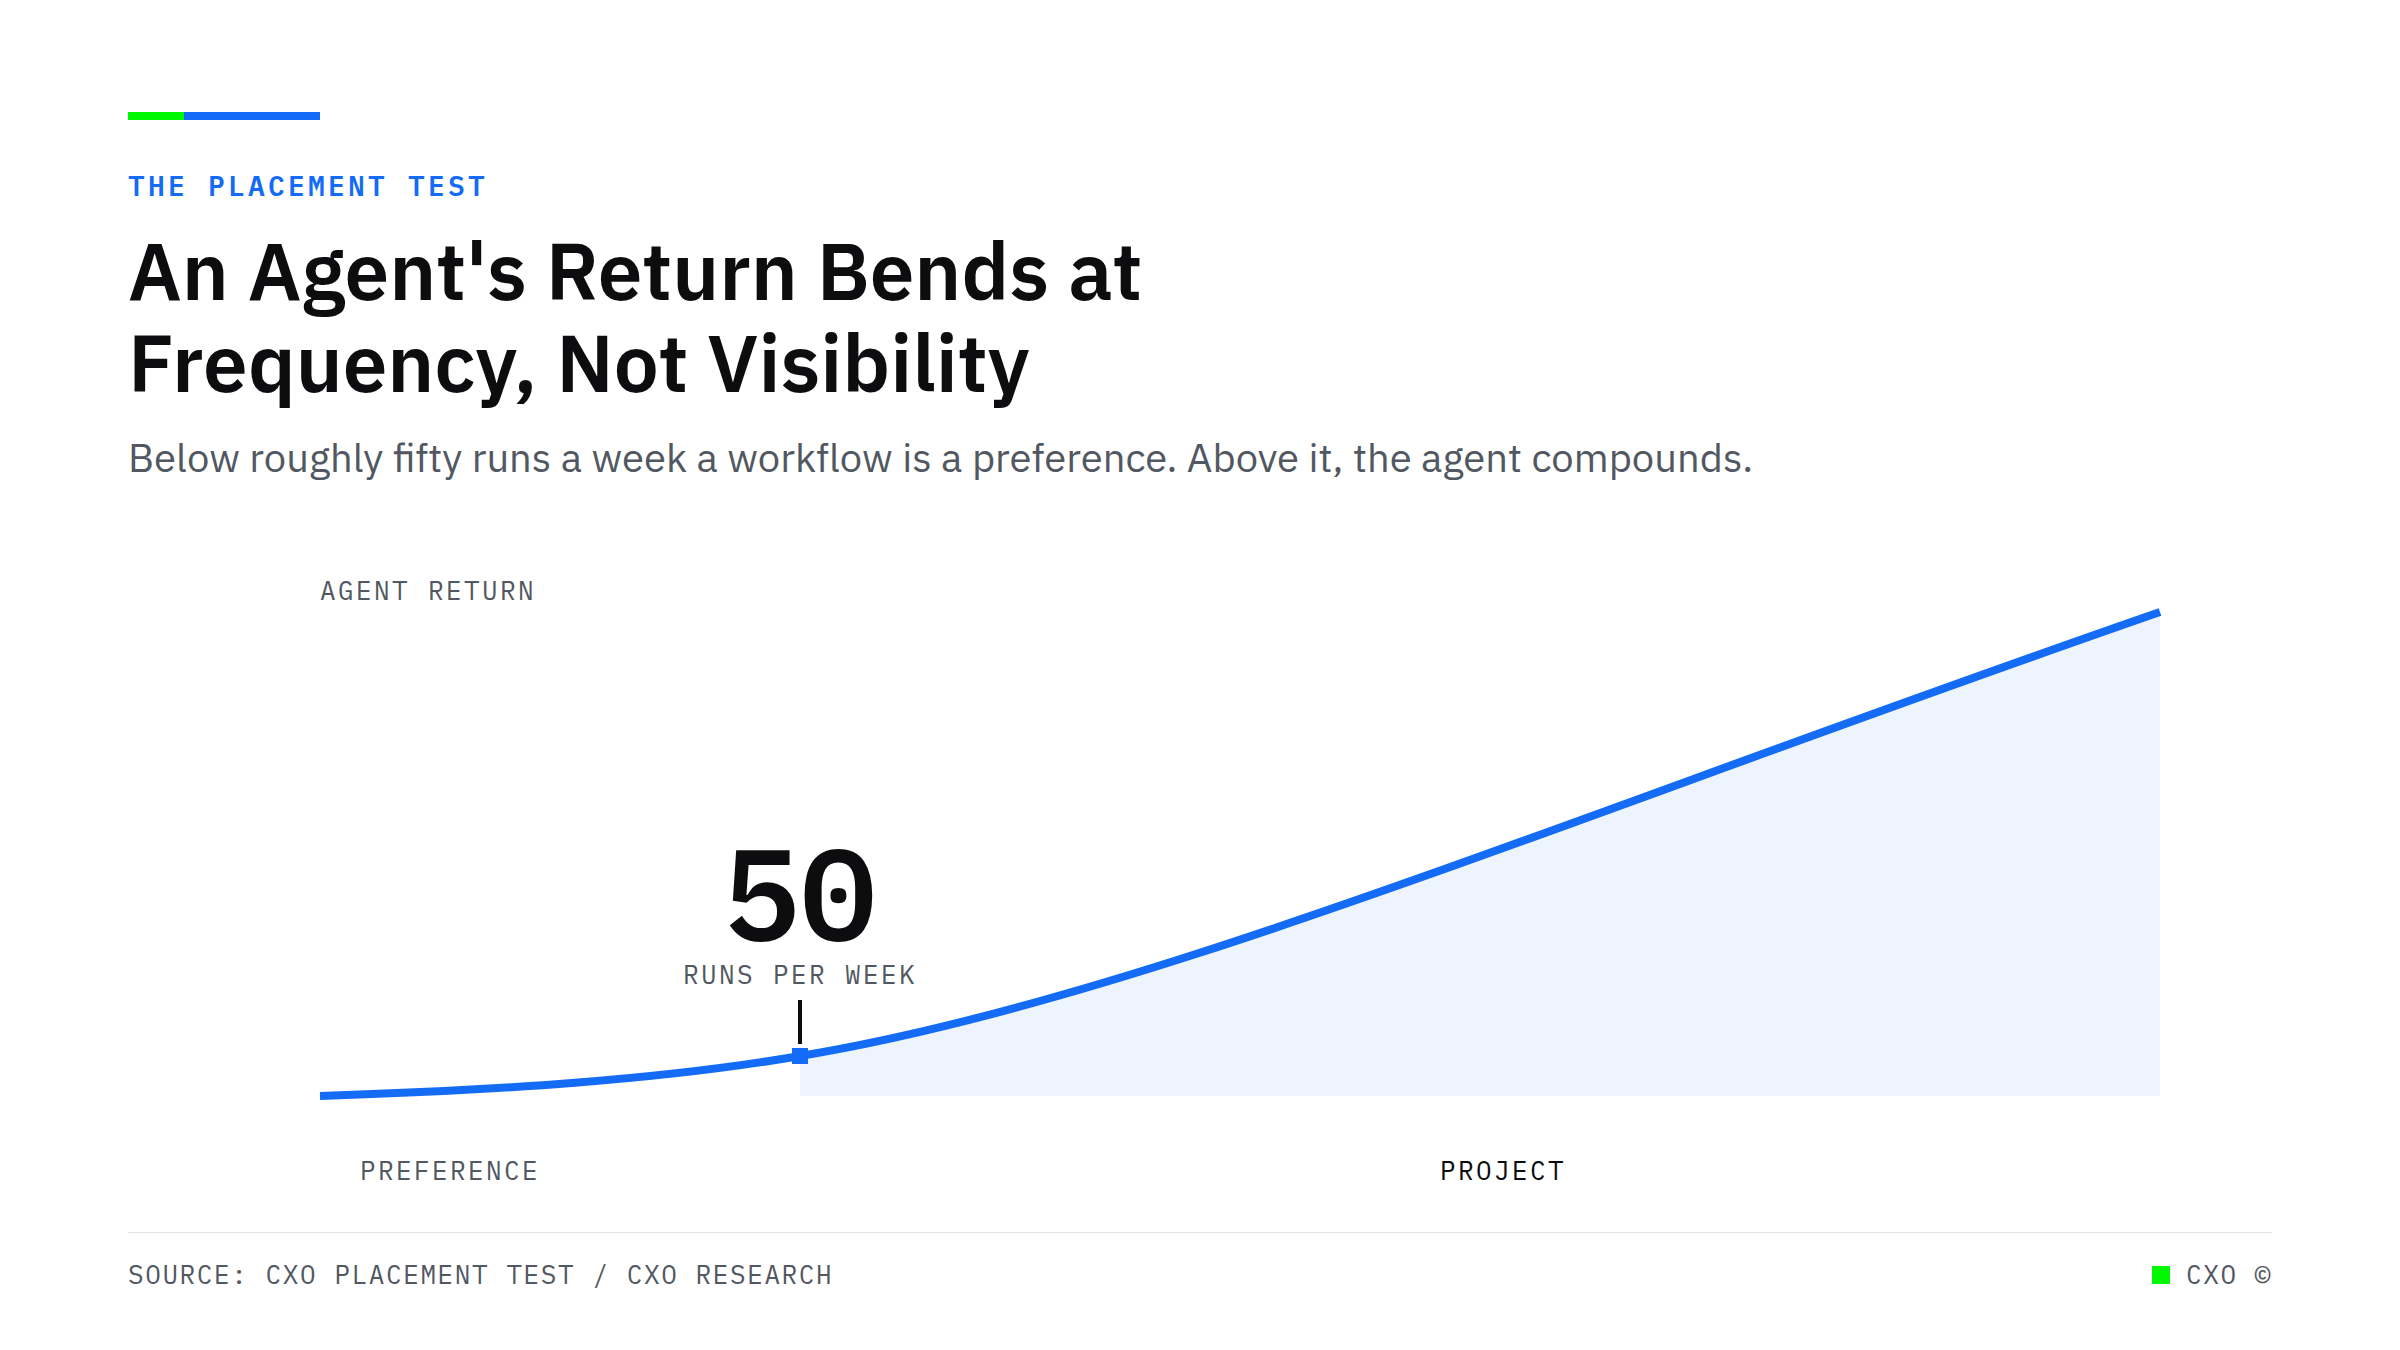
Bar chart showing agentic workflows cut per-loan processing cost 35 to 50 percent versus human-assisted AI

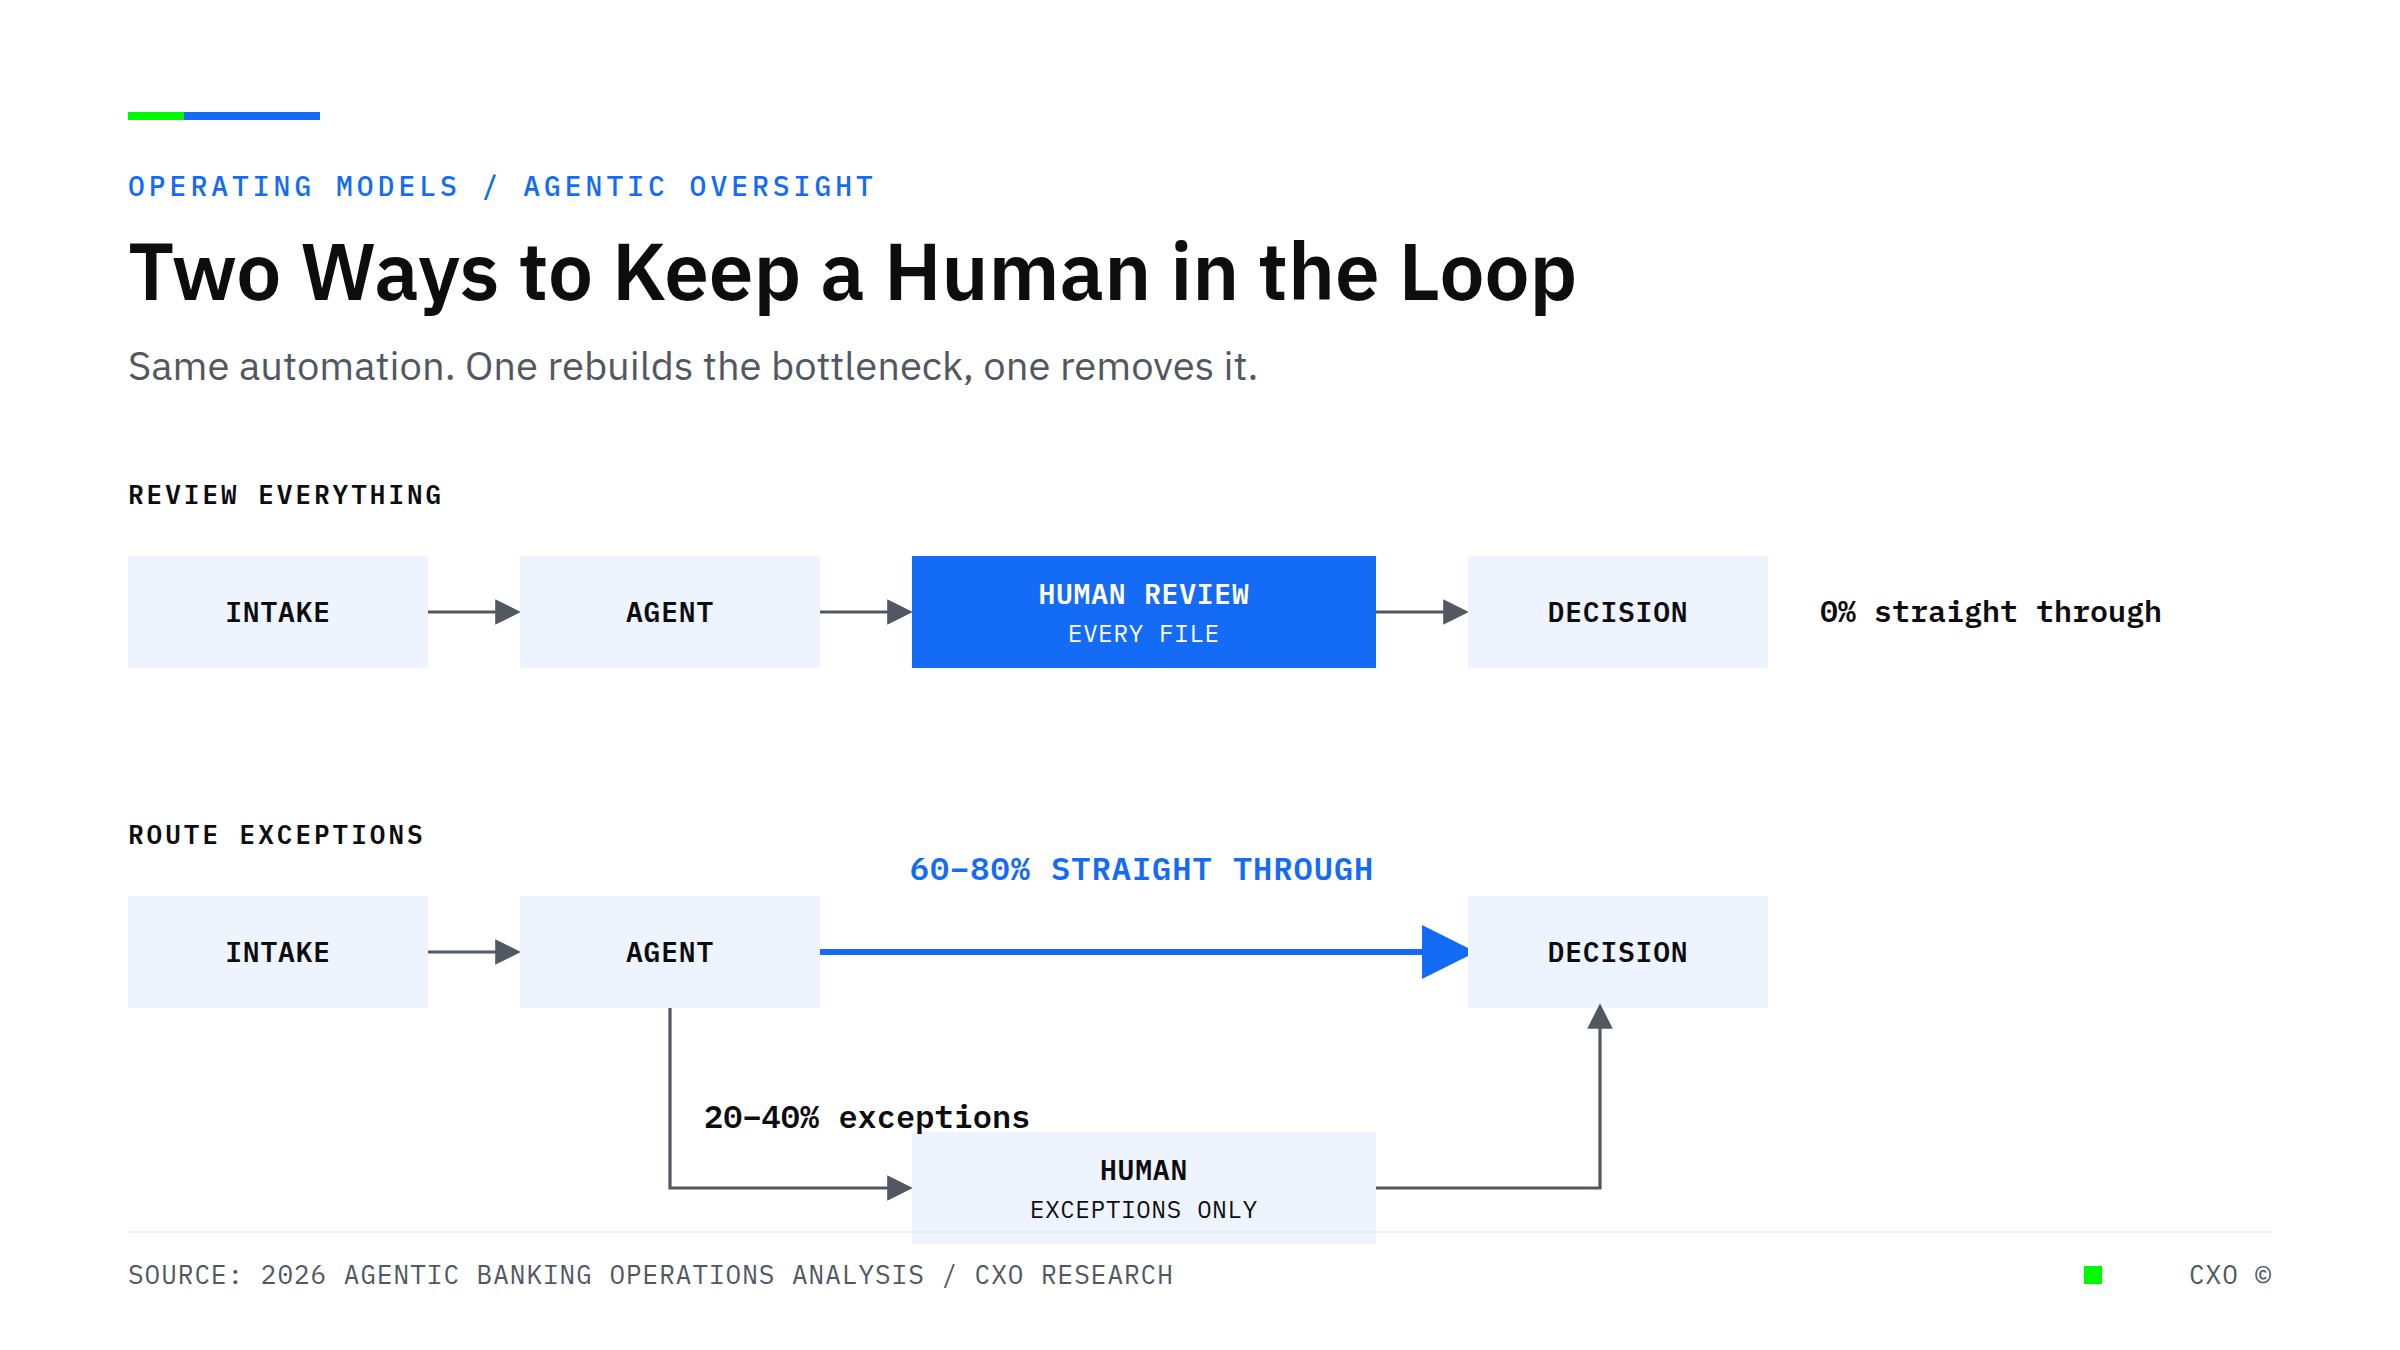
The Exception Queue Is the Most Expensive Line in Your Loan Operation

Agentic workflows cut per-loan processing cost 35 to 50% by eliminating the exception queue scripted automation creates. Here is the math most lenders never run.
View Insight
Split bar showing 37 percent of professional services time is billable and 63 percent non-billable, with utilization rising from 66 percent to 75 percent and roughly $1.04M recoverable at a 30-person firm

Your Partners Bill 37% of Their Day. The Other 63% Is Where Your Margin Is Hiding.

Professional services firms bill about 37% of available time while roughly 14 non-billable hours a week per person quietly erode margin. Here is where the money hides and how to reclaim it without hiring.
View Insight
Bar chart: debt recovery success falls from 65% within 48 hours to 15% after 14 days for alternative lenders.

The Recoverable AR You're Writing Off Is a Timing Failure, Not a Credit Failure

For alternative lenders, 15 to 20% of recoverable AR is lost to slow follow-up, not bad credit. See how contact timing drives recovery and how automated cadence closes the gap.
View Insight
Waterfall chart showing $510,000 in annual revenue lost by a $3M professional services firm through billing write-offs, invoice disputes, and uncollected AR due to process failures.

The Billing System Is Not Broken. The Process Around It Is.

The average professional services firm leaks 8–12% of annual revenue - not from bad clients, but from broken billing processes. Here is what it costs and how to fix it.
View Insight
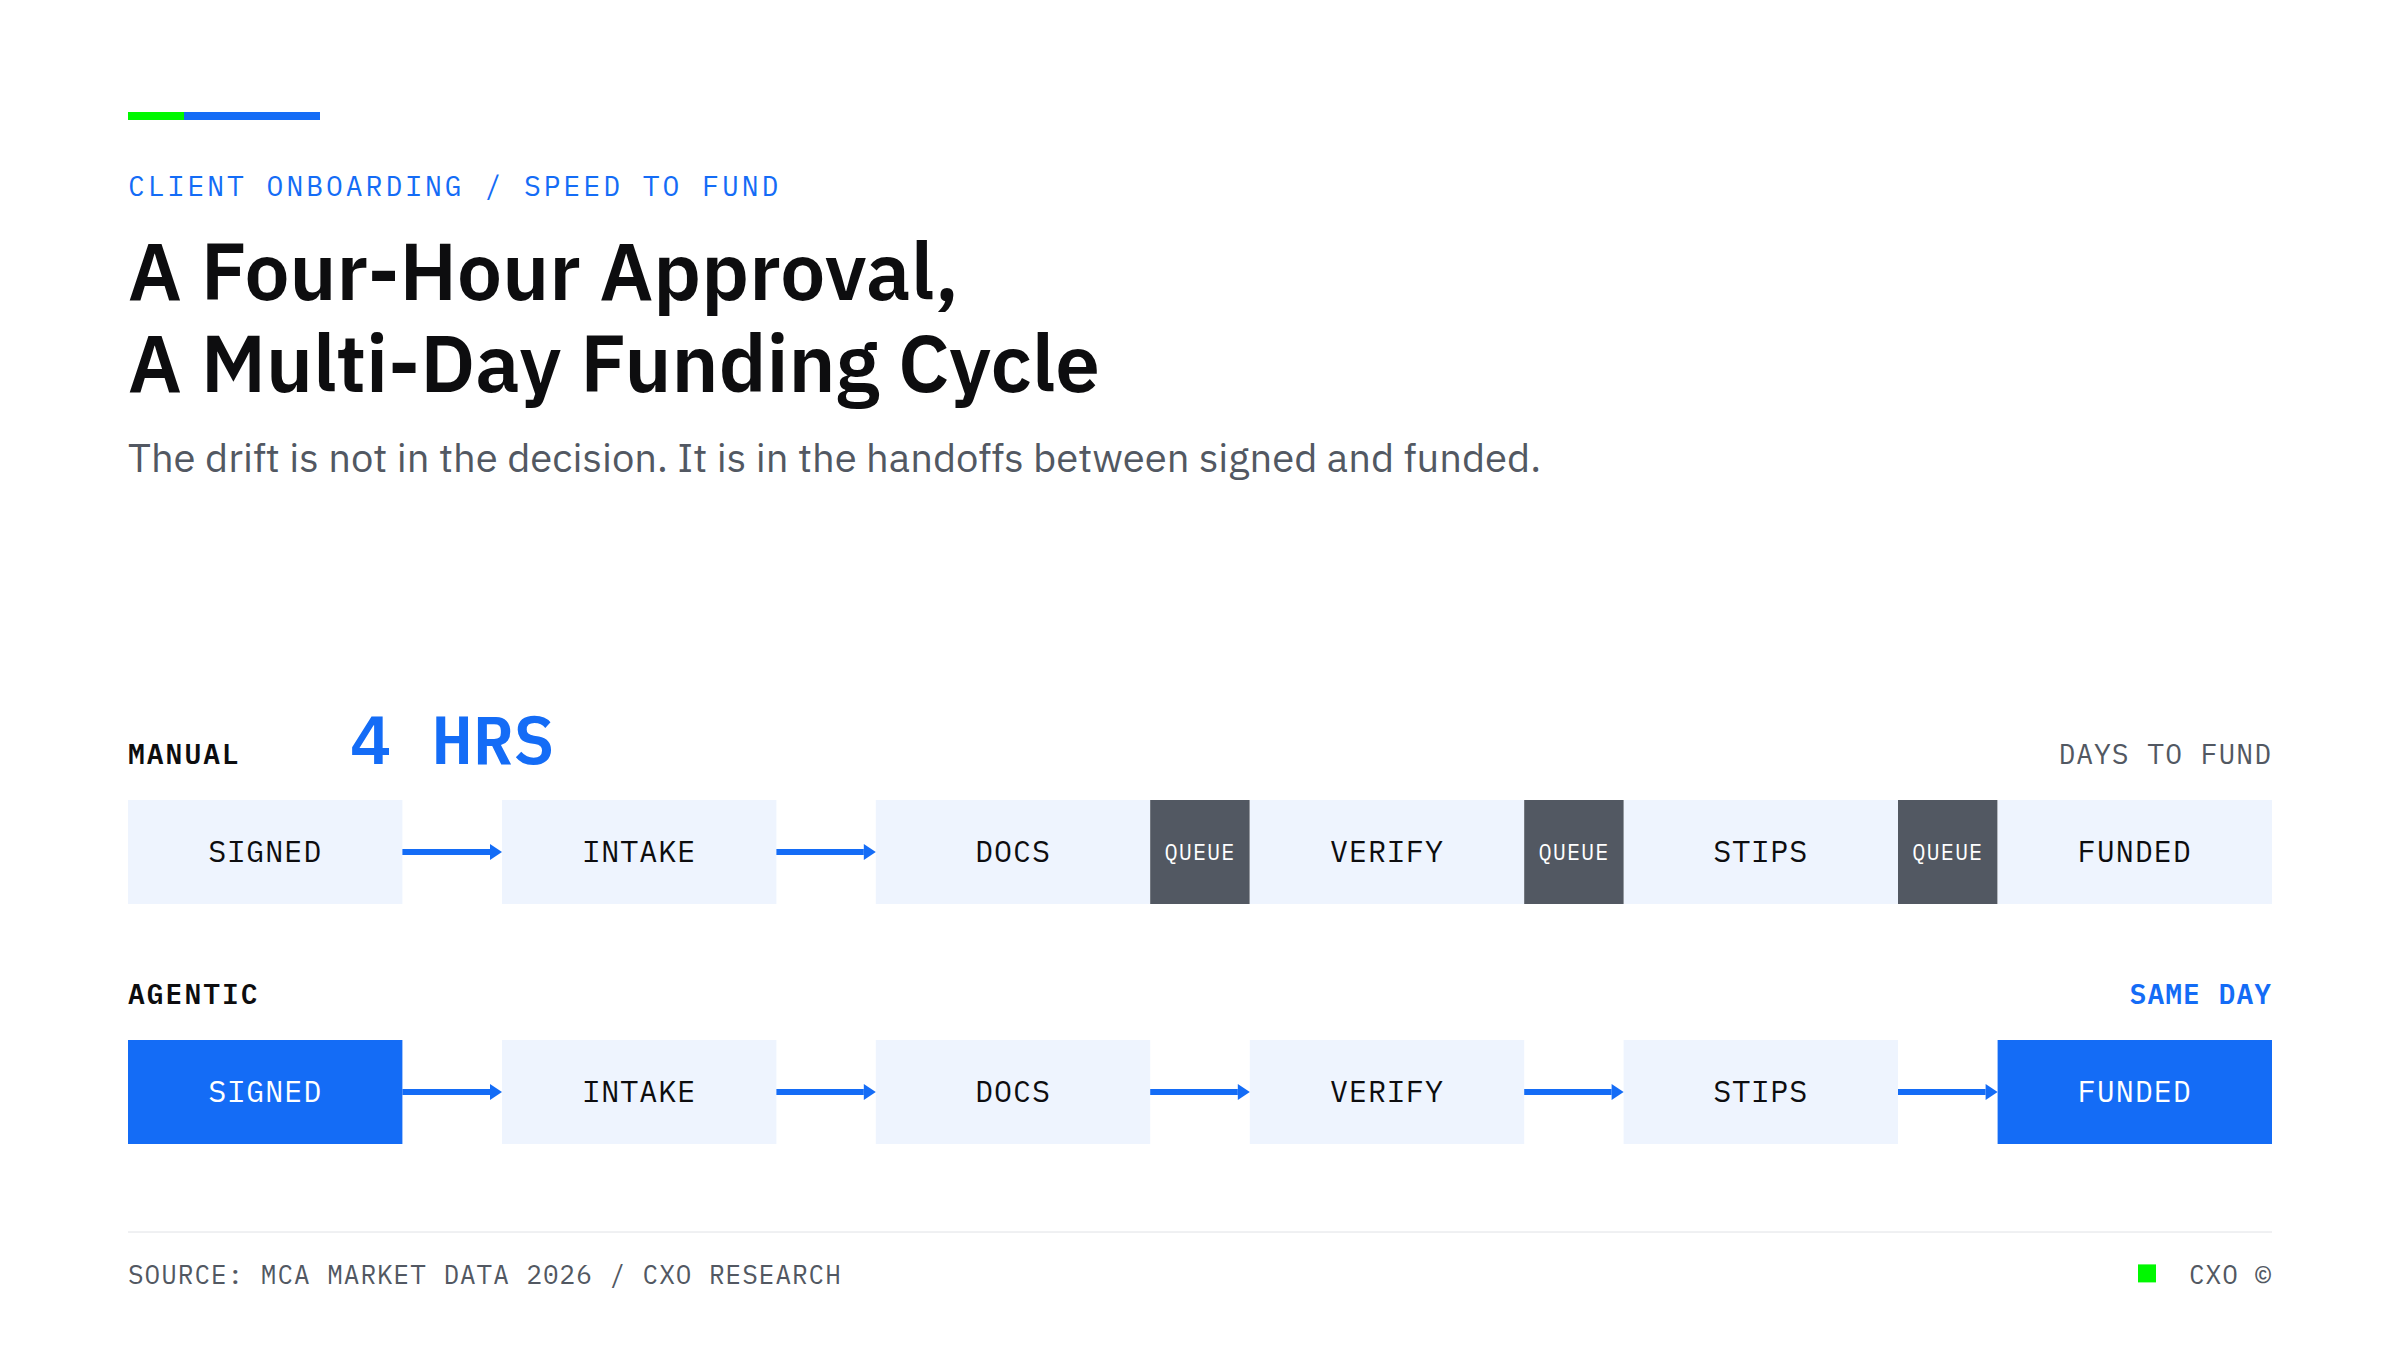
Horizontal bar chart comparing time to funding by lender type, showing MCA same-day funding against bank and SBA timelines of weeks to months

Off-the-Shelf Underwriting Was Built for W-2 Borrowers. You Don't Lend to Them.

Off-the-shelf underwriting was built for W-2 borrowers, not the cash-flow businesses alternative lenders fund. Here is where it leaks deals and how to fix it.
View Insight

Ready to put agentic AI to work?

See where automation can take the manual, repetitive work off your team. Book a discovery call and we'll map the highest-impact processes in your operation.

Book a discovery call